
On April 6, 2018, Guggenheim Investments closed the sale of its ETF business to Invesco, Ltd. The Guggenheim ETFs have been transitioned, or are in the process of being transitioned to become part of the Invesco fund family. Please visit invesco.com for information concerning the ETFs. Today we review the RPVRPG strategy.
On April 6, 2018, Guggenheim Investments closed the sale of its ETF business to Invesco, Ltd. The Guggenheim ETFs have been transitioned, or are in the process of being transitioned to become part of the Invesco fund family. Please visit invesco.com for information concerning the ETFs.
There are no changes to be made within either of the Dorsey Wright Invesco Models this week, as each of the current holdings continues to maintain positive relative strength within the respective universes.
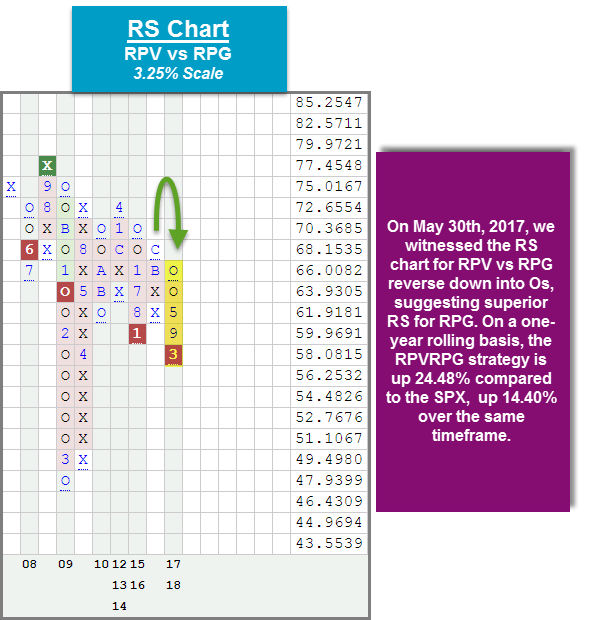
We continue to see growth dominate the asset class group scores page, as each growth style box has an average group score above 4.34 and resides in the strong “blue zone.” In addition, we’ve seen small, mid, and large cap growth size and style boxes make their way up into the top four positions in the DALI US Size & Style rankings. It is clear that growth continues to maintain leadership over value, no matter what the market capitalization category. One of the ETF strategies offered within our ETF Models page examines the relative strength relationship between pure value, pure growth, and cash. Specifically, the Value/Growth Portfolio RPVRPG uses the Invesco S&P 500 Pure Value ETF RPV as a proxy for value and the Invesco S&P 500 Pure Growth ETF RPG as a proxy for growth. When the relative strength chart comparing the two is in a column of Xs, it tells us that value is in favor and RPV is owned within the strategy. On the other hand, if the RS chart reverses down into a column of Os, RPG is held. The only exception would be if RPV or RPG (whichever is in favor) is showing weak RS when compared to cash MNYMKT. In such a case, the model moves 100% to cash. A little over a year ago on May 30th, 2017, we witnessed the relative strength chart (pictured below) reverse down into a column of Os, suggesting superior RS for RPG. As a result, the RPG has been held within this strategy ever since. In March of this year, the RS calculation continued to decrease, resulting in the completion of an RS sell signal, confirming growth’s strength versus value on a long-term basis. So far this year, RPG has outperformed RPV by more than 9% and on a one-year rolling basis, the RPVRPG strategy is up 24.48% compared to the S&P 500 Index SPX, up 14.40% over the same time frame (through 6/11). You can follow this Value/Growth Portfolio under the Models page using the tracking symbol RPVRPG and set email alerts for future shifts in relative strength.
The performance numbers above are price returns and do not include dividends or all transaction costs. Past performance is not indicative of future results. Potential for profits is accompanied by possibility of loss. The relative strength strategy is not a guarantee. There may be times when all investments within the investable universe are out of favor or depreciate in value.
