Most Requested Symbols

Action following the Presidential Election in Brazil has brought notable near-term technical damage to the broader Latin American space.
Take a trip, if you dare, to NDW's House of Horror. Here we review the scary technical pictures for several candy based companies ahead of Halloween
NDW Morning Pulse - October 30, 2026
Below are highlights from the NDW Morning Update Video for the morning of 10/30. Access the video on the NDW Morning Update Video page.

Brazilian and Latin American equities dropped on Monday (10/26) for the worst day since March 2020 after the surprise reelection of President Luiz Inacio Lula da Silva to a fourth term. The surprise comes after Brazilian and Latin American equities had rallied in recent weeks thinking Senator Flavio Bolsonaro (the son of former President Jair Bolsonaro) was the top candidate after the opening round of Brazil’s presidential elections earlier this month. While Bolsonaro’s approach to tighter fiscal policy had given markets a boost, Lula’s reelection brought concerns about rising debt and the new administration’s fiscal approach to lower borrowing costs. Though the Lula administration has pointed to a repositioning by investors for cause of the recent deterioration and that the fundamental picture remains sound, the damage to the technical picture for Brazil and broader Latin America in the near-term has been significant.
Following trading on 10/29, international equities fell below domestic equities within our longer-term to move into second within the NDW DALI Asset Class Rankings. Much of the responsibility for the change comes from the abrupt deterioration within Brazil and broader Latin America impacting the asset class ranks in DALI and the Asset Class Group Scores. Though the longer-term rankings within the NDW DALI International Equity Rankings still have Latin America sitting in first, it is worth bearing in mind that many Latin American representatives saw relative strength (RS) charts reverse into Os earlier this week and bring RS charts to within a box or two of a potential RS sell. Additional downside from here can push the RS charts to see the signal switch to sell, and with the multitude residing near the cusp, a potential change in Latin America’s ranking could be in the offing. On the Asset Class Group Scores page, which averages the fund scores of all ETFs and mutual funds on the NDW platform, the Latin American group fell down from 4.25 as of 10/23 down to 2.02 as of 10/29. This marks the lowest group score level since April 2025 and brings the group down to rank low within the Non-US View on the ACGS page with the likes of international equity income related groups, India, and China.

The technical picture for the iShares MSCI Brazil ETF (EWZ) offers a view of recent action within Brazilian equities. After seeing a second buy signal and trend reversal earlier in October, EWZ moved to within a couple boxes of its all-time chart high in the low $40s. Following the announcement of the Lula’s reelection on Monday (10/26), EWZ fell from $43 to $31.50 intraday Monday (10/26), marking the lowest level since January this year. Though a brief reversal ensued on 10/27, Wednesday’s (10/28) trading brought the chart back into Os, marking another lower top since the recent peak. The 19% drop on 10/26 brought the market and peer relative strength charts back into Os, highlighting near-term underperformance, while the continued negative action Wednesday (10/28) brought the market RS chart to within one box of an RS sell signal. Along with seeing action on the market and peer RS charts, EWZ moved to an RS sell signal against the NDW U.S. Money Market (MNYMKT) proxy following Wednesday’s (10/28) trading. EWZ has now fallen to its most oversold level since December 2024, and the ETF’s fund score has dropped to its lowest level since August 2026.

Within broader Latin America, the only remaining country to still maintain a positive overall technical picture is Colombia with the Global X MSCI Colombia ETF (COLO) holding a 5.77 fund score (out of 6), though the fund did give a second sell signal following news of the surprise election in Brazil. Peru, through the iShares MSCI Peru and Global Exposure (EPU), witnessed a third sell signal prior to the Brazilian elections, while Chile and Argentina, by way of the iShares MSCI Chile ETF (ECH) and Global X MSCI Argentina ETF (ARGT), violated notable long-term support, marking their lowest levels since October 2025. Broadly speaking, the iShares S&P Latin America 40 ETF (ILF) witnessed a shift into a negative trend and fell down to support at $32.50 on 10/26. Like EWZ, ILF reversed down into Os on the market and peer RS charts following action on 10/26 and now sits within one box of a potential market RS sell signal. Along with seeing action on the market and peer RS charts, ILF moved to an RS sell signal against the NDW U.S. Money Market (MNYMKT) proxy following Thursday’s (10/29) trading.

Brazil’s election has clearly caused enough concern for investors to impact the technical picture of the country and the broader region in the near-term. At the moment, the deterioration within Latin America has brought about a potential leadership change within the broader international equity space. Broadly speaking, with domestic and international equities still maintaining the top two spots and commodities sitting in third, DALI still maintains a risk-on posture. Though as has been highlighted, the rotation of a region or sector within the market out of a leadership position can cause impacts elsewhere in the longer-term rankings. Bear in mind, NDW users can set alerts for not only price or chart action on trend charts, but for action on relative strength charts, as well as changes to the NDW DALI Rankings and Asset Class Group Scores page in order to stay abreast to potential changes.
This weekend is Halloween, ushering in scary movies, costume parties, and of course…. lots and lots of sugar. Whether you are sneaking in a KitKat after everyone else has gone to bed or simply making sure you are all stocked up before the drove of ghosts & ghouls demand a “trick or treat,” you’ve probably gone out and purchased a bit of candy over the last few weeks. Around the NDW office, there are a few analysts with a bit of a sweet tooth. Favorites include the likes of Reese’s Peanut Butter Cups and Sour Patch Kids. Alongside the likes of car brands, airlines, and other eateries, candy is one of the most well known “buy what you know” options, meaning there might be one of your clients who is interested in (or already has) exposure towards their favorite chocolate maker. Today’s article will cover just a handful of these names, which unfortunately pack a bit more of a “trick” than “treat” for this Halloween.
If you have gone out and purchased candy this year, you might have noticed a higher price tag alongside the bags of sugar you’ll be handing out. Cocoa is obviously a main ingredient in chocolate, and while prices for CC/ trade well off their relative highs in 2025, ABC news projects that candy prices are still ~15% higher in 2026 compared to 2025. Talk about a Halloween scare! While there are several reasons for why this might be, the most likely scenario is the fact that highly volatile cocoa prices in 2024-2025 saw many highly dependent companies lock in higher prices to hedge against further increases. A 100-point chart for CC/ is included below. With a somewhat clear point of support around $5,000 p/ton down below current levels, it remains rather rangebound as we move into November. On the commodities front, agriculture options have taken a backseat to other energy focused areas so leadership here is spotty at best.

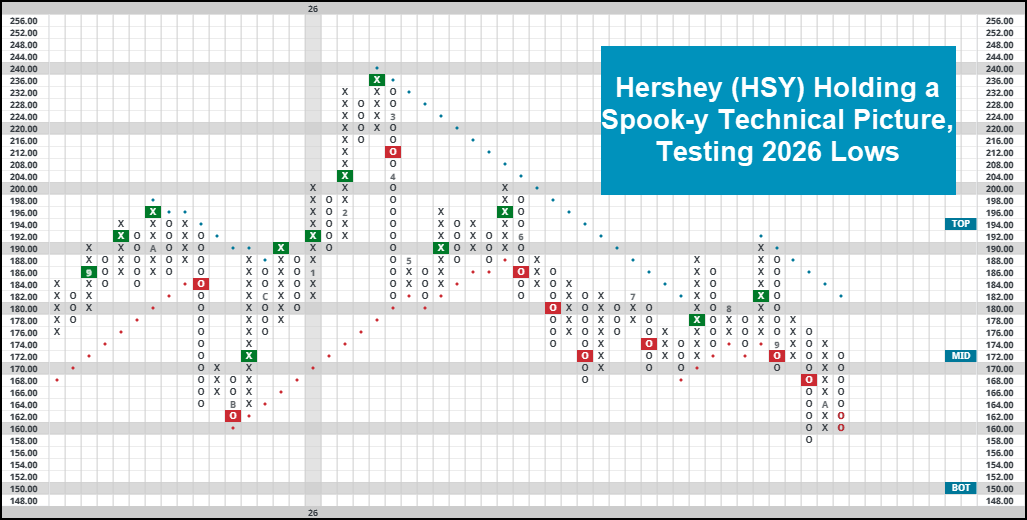
The most famous (at least around our office in Richmond) candy company is privately owned and operated. Mars, whose brands include the likes of M&M’s, Snickers, Twix, Milky Way, 3 Musketeers, and many more, have something for virtually everyone, although you can’t go out and buy a piece of them directly like some of the other names we will go and look at. Perhaps the most “obvious” of our Halloween focused list today is Hershey (HSY). While a king size chocolate bar might be at the top of your list this weekend, the stock leaves much to be desired for now. It sits on a pair of sell signals, in a negative trend and earns a poor 0/5 technical attribute rating as of 10/29. Support and resistance are included below.
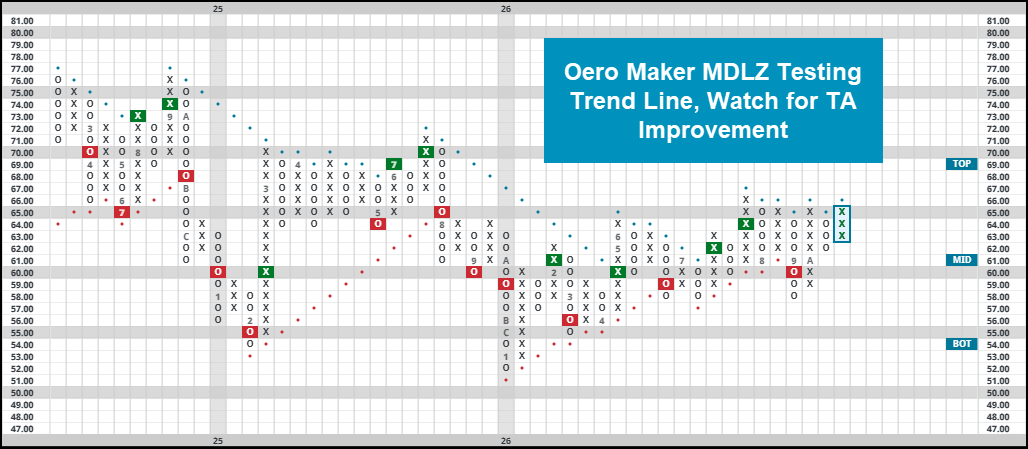
While best known for their flagship Oreo brand, Mondelez (MDLZ) has its fair share of candies you’ll likely find in your tick or treat pail this weekend. Including the likes of Sour Patch Kids, Swedish Fish, Cadbury and more, Mondelez has exposure outside of the pure chocolate portfolio. While it does remain a low attribute 1/5’er, its performance is better than several other pure chocolate producers (like previously mentioned Hershey). Mondelez has picked up just over 16% so far this year and will look to challenge some resistance overhead in the upper $60’s, as marked above. It is worth noting that most of the chocolate producers have very similar technical pictures at the time of this writing. Besides those of you with a sugar rush, convincing yourself any of them are strong would be quite difficult.
But of course, come Monday morning, all the sugar will catch up with us and Google searches for GLP-1’s will be on the rise across the nation. Eli Lilly LLY trades at all time highs, having recently reported strong earnings surrounding their flagship Zepbound product. LLY is a 5/5’er to close out October, having picked up over 25% so far this year. It sits near the top of its trading band but could be considered on light pullbacks towards a range of resistance between $1264 and $1312.
Happy Halloween from the NDW Team!


| Symbol | Name | Price | Yield | PnF Trend | RS Signal | RS Col. | Fund Score | 200 Day MA | Weekly Mom |
|---|---|---|---|---|---|---|---|---|---|
| DIA | State Street SPDR Dow Jones Industrial Average ETF Trust | 522.73 | 1.42 | Positive | Sell | X | 3.91 | 505.82 | + 2W |
| EEM | iShares MSCI Emerging Markets ETF | 62.72 | 1.94 | Positive | Buy | O | 3.29 | 63.86 | - 5W |
| EFA | iShares MSCI EAFE ETF | 104.35 | 3.08 | Positive | Sell | X | 3.73 | 103.22 | - 8W |
| IJH | iShares S&P MidCap 400 Index Fund | 74.20 | 1.25 | Positive | Buy | O | 4.15 | 72.99 | + 1W |
| IJR | iShares S&P SmallCap 600 Index Fund | 142.01 | 1.26 | Positive | Sell | X | 4.08 | 137.10 | + 1W |
| QQQ | Invesco QQQ Trust | 715.34 | 0.46 | Positive | Buy | O | 4.46 | 679.16 | - 3W |
| RSP | Invesco S&P 500 Equal Weight ETF | 220.04 | 1.53 | Positive | Sell | O | 3.63 | 207.69 | + 2W |
| SPY | State Street SPDR S&P 500 ETF Trust | 769.36 | 0.99 | Positive | Buy | X | 5.09 | 728.53 | - 8W |
| XLG | Invesco S&P 500 Top 50 ETF | 62.93 | 0.67 | Positive | Sell | X | 3.85 | 60.67 | - 3W |
Average Level
-0.13
| < - -100 | -100 - -80 | -80 - -60 | -60 - -40 | -40 - -20 | -20 - 0 | 0 - 20 | 20 - 40 | 40 - 60 | 60 - 80 | 80 - 100 | 100 - > |
|---|---|---|---|---|---|---|---|---|---|---|---|
|
Buy signalQQQ
|
Buy signalSPY
|
||||||||||
|
Buy signaliwm
|
Buy signalief
|
||||||||||
|
Buy signalxlg
|
Sell signalagg
|
||||||||||
|
Buy signalGCC
|
Buy signalijr
|
||||||||||
|
Sell signalVOOG
|
Sell signallqd
|
Sell signalshy
|
Buy signalrsp
|
||||||||
|
Buy signalgld
|
Buy signalONEQ
|
Buy signalIJH
|
Buy signalicf
|
Buy signalGSG
|
Buy signalVOOV
|
||||||
|
Sell signalfxe
|
Sell signalEEM
|
Sell signalhyg
|
Buy signalefa
|
Buy signaldia
|
Buy signaltlt
|
Sell signaldvy
|
Buy signaldx/y
|
Buy signalUSO
|
|||
| < - -100 | -100 - -80 | -80 - -60 | -60 - -40 | -40 - -20 | -20 - 0 | 0 - 20 | 20 - 40 | 40 - 60 | 60 - 80 | 80 - 100 | 100 - > |
| AGG | iShares US Core Bond ETF |
| USO | United States Oil Fund |
| DIA | SPDR Dow Jones Industrial Average ETF |
| DVY | iShares Dow Jones Select Dividend Index ETF |
| DX/Y | NYCE U.S.Dollar Index Spot |
| EFA | iShares MSCI EAFE ETF |
| FXE | Invesco CurrencyShares Euro Trust |
| GLD | SPDR Gold Trust |
| GSG | iShares S&P GSCI Commodity-Indexed Trust |
| HYG | iShares iBoxx $ High Yield Corporate Bond ETF |
| ICF | iShares Cohen & Steers Realty ETF |
| IEF | iShares Barclays 7-10 Yr. Tres. Bond ETF |
| LQD | iShares iBoxx $ Investment Grade Corp. Bond ETF |
| IJH | iShares S&P 400 MidCap Index Fund |
| ONEQ | Fidelity Nasdaq Composite Index Track |
| QQQ | Invesco QQQ Trust |
| RSP | Invesco S&P 500 Equal Weight ETF |
| IWM | iShares Russell 2000 Index ETF |
| SHY | iShares Barclays 1-3 Year Tres. Bond ETF |
| IJR | iShares S&P 600 SmallCap Index Fund |
| SPY | SPDR S&P 500 Index ETF Trust |
| TLT | iShares Barclays 20+ Year Treasury Bond ETF |
| GCC | WisdomTree Continuous Commodity Index Fund |
| VOOG | Vanguard S&P 500 Growth ETF |
| VOOV | Vanguard S&P 500 Value ETF |
| EEM | iShares MSCI Emerging Markets ETF |
| XLG | Invesco S&P 500 Top 50 ETF |

| Symbol | Company | Sector | Current Price | Action Price | Target | Stop | Notes |
|---|---|---|---|---|---|---|---|
| CENTA | Central Garden & Pet Company | Household Goods | $38.77 | mid-to-hi 30s | 48 | 31 | 4 for 5'er, favored HOUS sector, LT pos peer RS, spread quad top, buy on pullback, Earn. 11/25 |
| SWK | Stanley Black & Decker, Inc. | Machinery and Tools | $103.61 | hi 80s - mid 90s | 111 | 75 | 4 for 5'er., top 20% of MACH sector matrix, quad top, 3.6% yield Earn. 11/4 |
| WDAY | Workday Inc. | Software | $195.46 | low 190s to hi 200s | 230 | 178 | 4 for 5'er, Top half of SOFT sector matrix, Pos. LT Mkt. RS, Pos. Trend. |
| PANW | Palo Alto Networks Inc | Software | $380.57 | 360s - 380s | 472 | 308 | 4 for 5'er, top half of favored SOFT sector matrix, LT pos peer RS, Earn. 11/19 |
| WSM | Williams-Sonoma, Inc. | Retailing | $259.86 | 240s - 250s | 344 | 212 | 5 for 5'er, top 25% of RETA sector matrix, LT pos peer & mkt RS, R-R>2.0, Earn. 11/18 |
| A | Agilent Technologies, Inc | Healthcare | $181.15 | 170s - 180s | 196 | 154 | 4 for 5'er, top quartile of Healthcare matrix, Pos. LT Peer RS, One Box from Mkt. RS Buy, Earn. 11/25 |
| CACI | CACI International Inc. | Computers | $674.37 | 630s - 660s | 776 | 568 | 4 for 5'er, top third of COMP sector matrix, LT pos market RS, spread quadruple top |
| EHC | Encompass Health Corp. | Healthcare | $131.49 | low 120s - low 130s | 151 | 108 | 4 for 5'er, Pos. LT. Mkt. and Peer RS, top half of Healthcare matrix, ATH on 10/29. |
| Symbol | Company | Sector | Current Price | Action Price | Target | Stop | Notes |
|---|---|---|---|---|---|---|---|
| AVGO | Broadcom Ltd | Semiconductors | $345.00 | (320s - 340s) | 264 | 384 | 1 for 5'er, unfavored SEMI sector matrix, new market RS sell signal, negative trend flip |
| Symbol | Company | Sector | Current Price | Action Price | Target | Stop | Notes |
|---|---|---|---|---|---|---|---|
| NVDA | NVIDIA Corporation | Semiconductors | $213.66 | 220 - 240 | 300 | 204 | NVDA Has fallen to a sell signal. OK to hold here. Maintain $204 stop. Earn. 11/17 |
| SN | SharkNinja, Inc. | Household Goods | $209.12 | hi 170s - 180s | 222 | 156 | SN has moved into heavily overbought territory. OK to hold here. Raise stop to $176. Earn. 11/4 |
| URBN | Urban Outfitters, Inc. | Retailing | $92.19 | 79 - 85 | 99 | 71 | URBN has moved into heavily overbought territory. OK to hold here. Raise stop to $77 Earn. 11/24 |
| ASH | Ashland Inc. | Chemicals | $74.38 | hi 60s - mid 70s | 86 | 62 | Removed for earnings. Earn. 11/3 |
| BBY | Best Buy Co., Inc. | Retailing | $100.39 | low-to-mid $90s | 119 | 76 | BBY has fallen to a sell signal. OK to hold here. Raise stop to $83. Earn. 11/24 |
| Comment | |||||||
|---|---|---|---|---|---|---|---|
|
|
|||||||
AVGO Broadcom Ltd R ($324.18) - Semiconductors - AVGO is a 1 for 5'er and member of the unfavored semiconductors matrix that recently fell to a market RS sell signal for the first time since 2013. On its default chart, AVGO fell to a sell signal and a negative trend when it broke a double bottom at $340 and now sits one box away from giving second consecutive sell signal with a double bottom break at $320, which would take out all support the stock has found since March. Short exposure may be added in the $320s to $340s and we will set our initial stop at $384, which would take out two levels of resistance on AVGO's chart and move it to a positive trend. We will use the bearish price objective, $264, as our target price.
| 432.00 | X | • | 432.00 | ||||||||||||||||||||||||||
| 424.00 | X | O | • | 424.00 | |||||||||||||||||||||||||
| 416.00 | • | X | O | • | Top | 416.00 | |||||||||||||||||||||||
| 408.00 | • | • | X | O | • | 408.00 | |||||||||||||||||||||||
| 400.00 | X | • | • | • | • | X | O | • | 400.00 | ||||||||||||||||||||
| 396.00 | X | O | X | • | X | • | X | • | X | O | • | 396.00 | |||||||||||||||||
| 392.00 | X | O | X | O | X | O | X | O | X | O | • | 392.00 | |||||||||||||||||
| 388.00 | X | O | X | O | X | O | X | O | X | O | • | 388.00 | |||||||||||||||||
| 384.00 | X | O | O | X | O | X | 8 | X | O | • | • | 384.00 | |||||||||||||||||
| 380.00 | X | X | O | X | O | X | O | X | O | • | X | • | 380.00 | ||||||||||||||||
| 376.00 | X | O | X | O | X | O | X | O | • | O | X | • | X | O | • | 376.00 | |||||||||||||
| 372.00 | X | O | X | • | O | X | O | • | O | X | X | O | X | X | O | • | 372.00 | ||||||||||||
| 368.00 | X | O | X | • | O | X | • | O | X | O | X | O | X | O | X | O | 368.00 | ||||||||||||
| 364.00 | X | O | • | O | X | • | O | X | O | X | 9 | X | O | X | X | O | 364.00 | ||||||||||||
| 360.00 | • | • | O | • | O | O | X | O | X | O | X | O | X | X | O | 360.00 | |||||||||||||
| 356.00 | • | O | X | O | X | O | X | O | X | O | X | O | Mid | 356.00 | |||||||||||||||
| 352.00 | O | O | X | O | X | O | X | O | X | O | X | 352.00 | |||||||||||||||||
| 348.00 | O | X | O | X | O | A | X | O | X | O | 348.00 | ||||||||||||||||||
| 344.00 | O | O | X | O | • | O | X | O | 344.00 | ||||||||||||||||||||
| 340.00 | O | X | • | O | X | O | 340.00 | ||||||||||||||||||||||
| 336.00 | O | O | X | 336.00 | |||||||||||||||||||||||||
| 332.00 | O | X | 332.00 | ||||||||||||||||||||||||||
| 328.00 | O | X | 328.00 | ||||||||||||||||||||||||||
| 324.00 | O | 324.00 |
| AEM Agnico-Eagle Mines Ltd. ($163.96) - Precious Metals - AEM gave a second consecutive sell signal and fell to a negative trend Friday when it broke a double bottom at $170 and continued lower to $162. The negative trend change will drop AEM to a 1 for 5'er. From here, the next level of support on AEM's chart sits at $144. |
| CRS Carpenter Technology Corporation ($282.99) - Steel/Iron - After giving six consecutive sell signals, CRS returned to a buy signal Friday when it broke a double top at $296. The outlook for the stock remains negative, however, as CRS is a 1 for 5'er that ranks at the bottom of the steel/iron sector matrix. |
| GFI Gold Fields Limited (South Africa) ADR ($32.51) - Precious Metals - GFI gave a second consecutive sell signal and fell to a negative trend Friday when it broke a double bottom at $34. The negative trend change will drop the stock to 1 for 5'er. From here, the next level of support on GFI's chart sits at $32. |
| GM General Motors ($87.25) - Autos and Parts - GM broke a triple top at $86 to end a series of six sell signals that began in August as shares rallied to $88. The move also penetrates the bearish resistance line and will shift the trend back to positive, increasing GM up to 4 for 5'er. Okay to consider here on the breakout or on a pullback to the mid-$80s. Note resistance at current chart levels along with prior highs in the low $90s. Support resides at $75, which was held recently and dates back to July of htis year. |
| INTC Intel Corporation ($63.78) - Semiconductors - INTC plummeted more than 30% on the day, moving to a sell signal with a break at $84. The low attribute stock continues to be one to avoid. That said, it is in heavily oversold territory, so it could rebound slightly or consolidate for anyone that hasn't sold yet. |
| LYV Live Nation Entertainment Inc. ($177.47) - Leisure - LYV broke a double top at $178 to complete a bullish catapult and penetrate the bearish resistance line, flipping the trend back to positive. The trend change will increase LYV up to a 5 for 5'er, and the stock also ranks within the top half of the Leisure sector matrix. Okay to consider here on the breakout or on a pullback to the lower $170s. Note the prior chart highs at $188. Support lies in the $166 to $170 range. |
| MSI Motorola Solutions Inc. ($491.98) - Telephone - MSI broke a triple top buy signal with today's action, completing a bullish shakeout pattern on its default chart. The 4/5'er is up nearly 30% so far in 2026 and has been ushered nicely along its bullish support line below current levels. While we are near the top of the trading band and facing resistance at all time highs at $504, the name remains a technically defendable option with a 4/5 TA score heading into November. |
| NVDA NVIDIA Corporation ($204.64) - Semiconductors - Shares of NVDA broke a double bottom at $208, moving to a sell signal. Action today caused it to also flip its trend to negative, bringing it down to hold territory as a 3 for 5'er. Those with positions can continue holding for now but should watch for signs of further weakness. |
| OLN Olin Corp ($17.49) - Chemicals - OLN gave an initial buy signal Friday when it broke a double top at $17. The outlook for the stock remains negative however, as OLN is a 0 for 5'er. From here, the next level of resistance sits at $24, where OLN's bearish resistance line also currently sits. |
| PM Philip Morris International Inc. ($208.50) - Food Beverages/Soap - PM inched higher to complete a double top break at $212, marking a new intraday all-time high. The 5 for 5'er moved up from a 4 with its latest move, after reversing back into a positive trend. Additionally, the stock ranks in the top decile of the food beverages/soap sector matrix and offers a yield above 3%. Long exposure can be made here. Initial strong support can be seen between $182-$184. |
| SKYW Skywest Inc ($82.14) - Aerospace Airline - After returning to a buy signal and seeing a positive trend change on 10/29, SKYW reversed into Os and fell 14%, giving a sell signal and shifting the trend by to negative at $91 as shares fell to $83. This will drop the stock down to a 2 for 5'er in attribute rating and brings the chart down to levels not seen since June. From here, the May chart lows reside at $78. |
The option suggestions featured here are pulled from the NDW Options Ideas tool. These are just a sample of the ideas that can be found there. The Options Idea tool contains numerous additional income and speculative plays. It also offers relative strength-based screens targeting the highest (and lowest) relative strength stocks and ETFs that have recently moved counter to their longer-term trend. To access or subscribe to the Options Ideas tool, click here.
Call
Financials Select Sector SPDR Fund (XLF) Jan 15 $56 Call

| Bid/Ask Spread | 7.08% |
| Delta | 59.5 |
| Gamma | 8.9 |
| Implied Volatility | 16.99% |
| Expiry Date | 77 |
| Earnings Date | - |
Put
GameStop Corporation (GME) Jan 15 $24 Put

| Additional Data: | |
| Bid/Ask Spread | 15.18% |
| Delta | -46.33 |
| Gamma | 6.84 |
| Implied Volatility | 53.09% |
| Expiry Date | 77 |
| Earnings Date | 12/8/2026 |
Income
Microsoft Corp (MSFT) Nov 27 $495 Put

| Additional Data: | |
| Ann. Static Return | 17.84% |
| Bid/Ask Spread | 9.38% |
| Delta | 24.6 |
| Gamma | -0.72 |
| Implied Volatility | 27.68% |
| Expiry Date | 28 |
| Earnings Date | 1/27/2027 |
Daily Equity & Market Analysis
Loading, Please Wait...

