Most Requested Symbols

October has a long history of testing investors’ nerves. So far this month, investors have rotated to safety.
NDW Morning Pulse - October 27, 2026
Below are highlights from the NDW Morning Update Video for the morning of 10/26/2026. Access the video on the NDW Morning Update Video page.

October has a long history of testing investors’ nerves. From infamous crashes to sudden reversals, the month has earned a reputation for delivering surprises when confidence is highest. While 2026 hasn't produced a headline-grabbing selloff, the market's underlying behavior suggests something more noteworthy may be happening beneath the surface.
At a glance, the market appears relatively normal, with the S&P 500 down a mere 0.4% this October. However, as has been a common theme, there’s been massive dispersion, with significant gains in some areas offsetting declines in others. Even more notably, the most risk-on areas of the market have sold off while most of its defensive groups have picked up steam, signaling a rotation to safety by the market.
When buyers move away from risk-on areas in favor of other groups, it can often signal rising fear or declining confidence in the broader market. So far this month, technology is down more than 5%, dragging the S&P 500 lower. Meanwhile, consumer staples, often viewed as the most defensive sector, is up a whopping 9.5%. While a single digit gain may sound modest in a vacuum, that puts the sector on track for its 2nd-best calendar-month return of all time, trailing only December 2021.

Over the last month, staples have outperformed the market by more than 10%, something that has occurred only a handful of other times, many of which preceded market declines. Previous “flight-to-safety” events like this occurred during the dot com bubble, the Great Financial Crisis, and the 2022 bear market. In general, market returns have been muted following such instances, with the S&P 500 averaging a return of only 5% one year later. More concerning, those returns were negative most of the time, with the median return coming in at negative 5%.

The good news is that similar defensive rotations over the past few years did not mark the end of the current bull market. In the most recent three instances, the S&P 500 has averaged a six-month return of nearly 20%. So, while investors may want to exercise greater caution given recent action, this signal alone is not an automatic dealbreaker for the bull case.
Additionally, recent action makes much more sense in the context of September. Last month, technology rose 5%, while the other ten major sectors all finished in the red. As a result, technology outperformed the average stock by nearly 10%, as represented by the S&P 500 Equal Weight (SPXEWI). So far this month, technology is leading the way to the downside with a decline of 5%. Conversely, the S&P 500 Equal Weight is up 4%, with eight of the eleven sectors posting gains. In many ways, October has been almost a complete reversal of what investors experienced the prior month

Trend following relies upon the notion that the leaders will continue to lead, but a single month’s worth of action is more likely to be noise than substance. The benefit of relative strength is that it allows investors to focus on the longer-term leadership trends across the market. In the current environment, technology continues to display relative strength, sitting near the top of DALI’s rankings. In contrast, most defensive areas (excluding healthcare), continue to lack relative strength, with consumer staples rounding out the bottom of DALI. Technology did fall from the number-one spot, while energy has climbed back near the top, so there’s have already been adjustments by relative strength. However, with the weight of the evidence still favoring technology and the broader market, particularly over intermediate- and long-term time frames, investors should remain patient until those trends show sustained deterioration.

Average Level
-14.36
| < - -100 | -100 - -80 | -80 - -60 | -60 - -40 | -40 - -20 | -20 - 0 | 0 - 20 | 20 - 40 | 40 - 60 | 60 - 80 | 80 - 100 | 100 - > |
|---|---|---|---|---|---|---|---|---|---|---|---|
|
Buy signalIJH
|
|||||||||||
|
Buy signalQQQ
|
Sell signallqd
|
Buy signalicf
|
|||||||||
|
Buy signalONEQ
|
Buy signaldia
|
Sell signalshy
|
|||||||||
|
Sell signalhyg
|
Buy signaliwm
|
Buy signalijr
|
Buy signalgcc
|
Buy signalrsp
|
|||||||
|
Sell signalEEM
|
Buy signalefa
|
Buy signalxlg
|
Buy signalief
|
Sell signaldvy
|
Buy signalGSG
|
||||||
|
Sell signalfxe
|
Buy signalgld
|
Sell signalVOOG
|
Buy signalSPY
|
Sell signalagg
|
Buy signaltlt
|
Buy signalVOOV
|
Buy signaldx/y
|
Buy signalUSO
|
|||
| < - -100 | -100 - -80 | -80 - -60 | -60 - -40 | -40 - -20 | -20 - 0 | 0 - 20 | 20 - 40 | 40 - 60 | 60 - 80 | 80 - 100 | 100 - > |
| AGG | iShares US Core Bond ETF |
| USO | United States Oil Fund |
| DIA | SPDR Dow Jones Industrial Average ETF |
| DVY | iShares Dow Jones Select Dividend Index ETF |
| DX/Y | NYCE U.S.Dollar Index Spot |
| EFA | iShares MSCI EAFE ETF |
| FXE | Invesco CurrencyShares Euro Trust |
| GLD | SPDR Gold Trust |
| GSG | iShares S&P GSCI Commodity-Indexed Trust |
| HYG | iShares iBoxx $ High Yield Corporate Bond ETF |
| ICF | iShares Cohen & Steers Realty ETF |
| IEF | iShares Barclays 7-10 Yr. Tres. Bond ETF |
| LQD | iShares iBoxx $ Investment Grade Corp. Bond ETF |
| IJH | iShares S&P 400 MidCap Index Fund |
| ONEQ | Fidelity Nasdaq Composite Index Track |
| QQQ | Invesco QQQ Trust |
| RSP | Invesco S&P 500 Equal Weight ETF |
| IWM | iShares Russell 2000 Index ETF |
| SHY | iShares Barclays 1-3 Year Tres. Bond ETF |
| IJR | iShares S&P 600 SmallCap Index Fund |
| SPY | SPDR S&P 500 Index ETF Trust |
| TLT | iShares Barclays 20+ Year Treasury Bond ETF |
| GCC | WisdomTree Continuous Commodity Index Fund |
| VOOG | Vanguard S&P 500 Growth ETF |
| VOOV | Vanguard S&P 500 Value ETF |
| EEM | iShares MSCI Emerging Markets ETF |
| XLG | Invesco S&P 500 Top 50 ETF |

| Symbol | Company | Sector | Current Price | Action Price | Target | Stop | Notes |
|---|---|---|---|---|---|---|---|
| CENTA | Central Garden & Pet Company | Household Goods | $39.11 | mid-to-hi 30s | 48 | 31 | 4 for 5'er, favored HOUS sector, LT pos peer RS, spread quad top, buy on pullback |
| NVDA | NVIDIA Corporation | Semiconductors | $210.96 | 220 - 240 | 300 | 204 | 4 for 5'er, top third of Semis matrix, pos. ST Mkt and Peer RS, ATH on 10/2, Earn. 11/17 |
| SN | SharkNinja, Inc. | Household Goods | $196.38 | hi 170s - 180s | 222 | 156 | 5 for 5'er, top 10% of HOUS sector matrix, multiple buy signals, Earn. 11/4 |
| URBN | Urban Outfitters, Inc. | Retailing | $86.55 | 79 - 85 | 99 | 71 | 4 for 5'er w/recent pos. trend change, Pos. LT Mkt. and Peer RS, Top quartile of Retail matrix, Matched ATH on 10/13. |
| ASH | Ashland Inc. | Chemicals | $72.99 | hi 60s - mid 70s | 86 | 62 | 5 for 5'er, top 10% of CHEM sector matrix, RS buy signal, bearish signal reversal, 2.4% yield, Earn. 11/3 |
| SWK | Stanley Black & Decker, Inc. | Machinery and Tools | $99.24 | hi 80s - mid 90s | 111 | 75 | 4 for 5'er., top 20% of MACH sector matrix, quad top, 3.6% yield Earn. 11/4 |
| WDAY | Workday Inc. | Software | $209.99 | low 190s to hi 200s | 230 | 178 | 4 for 5'er, Top half of SOFT sector matrix, Pos. LT Mkt. RS, Pos. Trend. |
| BBY | Best Buy Co., Inc. | Retailing | $99.87 | low-to-mid $90s | 119 | 76 | 4 for 5'er, top 20% of RETA sector matrix, one box from market RS buy signal, 4.2% yield |
| RBRK | Rubrik, Inc. Class A | Software | $128.74 | lo 110 - mid 120 | 144 | 104 | 5 for 5'er, Top decile of Software matrix, Pos. LT Mkt. and Peer RS, Pos. trend. |
| PANW | Palo Alto Networks Inc | Software | $380.55 | 360s - 380s | 472 | 308 | 4 for 5'er, top half of favored SOFT sector matrix, LT pos peer RS, |
| WSM | Williams-Sonoma, Inc. | Retailing | $252.47 | 240s - 250s | 344 | 212 | 5 for 5'er, top 25% of RETA sector matrix, LT pos peer & mkt RS, R-R>2.0, Earn. 11/18 |
| Symbol | Company | Sector | Current Price | Action Price | Target | Stop | Notes |
|---|
| Comment | |||||||
|---|---|---|---|---|---|---|---|
|
|
|||||||
WSM Williams-Sonoma, Inc. R ($248.80) - Retailing - WSM is a 5 for 5'er that ranks in the top quartile of the retailing sector matrix and has been on peer and market RS buy signals since 2023. After falling to a sell signal in September, WSM found support at $200 and rallied, returning to a buy signal earlier this month when it broke a double top at $252. Long exposure may be added in the $240s to $250s and we will set our initial stop at $212, which would take out two levels of support on WSM's default chart. We will use the bullish price objective, $344, as our target price, giving us a reward-to-risk ratio north of 2.0. WSM also carries a 1.2% yield and is expected to report earnings on 11/18.
| 260.00 | X | 260.00 | |||||||||||||||||||||||||||
| 256.00 | X | 256.00 | |||||||||||||||||||||||||||
| 252.00 | X | X | 252.00 | ||||||||||||||||||||||||||
| 248.00 | X | O | X | X | 248.00 | ||||||||||||||||||||||||
| 244.00 | X | 8 | O | X | O | X | 244.00 | ||||||||||||||||||||||
| 240.00 | X | O | X | O | X | O | X | 240.00 | |||||||||||||||||||||
| 236.00 | X | O | X | O | X | O | A | Mid | 236.00 | ||||||||||||||||||||
| 232.00 | X | 7 | X | X | O | X | O | X | 232.00 | ||||||||||||||||||||
| 228.00 | X | O | X | O | X | O | X | O | X | 228.00 | |||||||||||||||||||
| 224.00 | X | O | X | O | X | O | 9 | X | 224.00 | ||||||||||||||||||||
| 220.00 | X | O | X | O | X | O | 220.00 | ||||||||||||||||||||||
| 216.00 | X | O | O | 216.00 | |||||||||||||||||||||||||
| 212.00 | • | X | 212.00 | ||||||||||||||||||||||||||
| 208.00 | X | • | X | X | 208.00 | ||||||||||||||||||||||||
| 204.00 | X | X | O | • | X | O | X | 204.00 | |||||||||||||||||||||
| 200.00 | X | O | X | O | • | X | O | X | 200.00 | ||||||||||||||||||||
| 198.00 | X | O | X | O | X | 6 | 198.00 | ||||||||||||||||||||||
| 196.00 | X | X | O | O | X | Bot | 196.00 | ||||||||||||||||||||||
| 194.00 | • | X | X | O | X | O | X | 194.00 | |||||||||||||||||||||
| 192.00 | • | X | O | X | O | X | O | X | 192.00 | ||||||||||||||||||||
| 190.00 | • | X | O | X | O | • | O | X | 190.00 | ||||||||||||||||||||
| 188.00 | • | X | O | X | • | O | X | X | 188.00 | ||||||||||||||||||||
| 186.00 | • | X | O | • | O | X | O | X | • | 186.00 | |||||||||||||||||||
| 184.00 | O | X | X | X | • | O | X | O | X | • | 184.00 | ||||||||||||||||||
| 182.00 | O | X | O | X | O | X | • | O | X | O | X | • | 182.00 | ||||||||||||||||
| 180.00 | O | X | O | X | O | X | • | 5 | X | O | X | • | 180.00 | ||||||||||||||||
| 178.00 | O | X | 4 | • | O | • | O | X | O | X | • | 178.00 | |||||||||||||||||
| 176.00 | O | • | • | • | O | O | X | • | 176.00 | ||||||||||||||||||||
| 174.00 | • | O | X | • | 174.00 | ||||||||||||||||||||||||
| 172.00 | O | X | • | 172.00 | |||||||||||||||||||||||||
| 170.00 | O | X | • | 170.00 | |||||||||||||||||||||||||
| 168.00 | O | X | • | 168.00 | |||||||||||||||||||||||||
| 166.00 | O | • | 166.00 |
| DDOG Datadog Inc Class A ($280.24) - Software - Shares of DDOG broke a double top at $280 to move back to a buy signal. The 5 for 5'er regained near-term relative strength in September, putting it firmly back into buy territory for now. From here, initial support lies at $256 then $244, with initial resistance found at $300 from all-time highs. |
| TGT Target Corporation ($147.82) - Retailing - TGT broke a triple bottom at $150 for a second sell signal since peaking at $170 in August as shares fell to $148. The stock continues to remain at 3 for 5'er with a positive trend and positive near-term market and peer RS. From here, the bullish support line sits at $144, while additional can be found at $134. |
| VSXY Victoria's Secret & Company ($94.57) - Retailing - VSXY broke a triple top at $94 for a second buy signal as shares rallied to $96. The stock has maintained a 5 technical attribute rating since late September after seeing the trend flip back to positive and the market and peer RS charts return to Xs, highlighting near-term strength. Okay to consider here on the breakout or on a pullback to the upper $80s. Initial support lies in the $86 to $87 range, while additional can be found in the lower $80s. |

The option suggestions featured here are pulled from the NDW Options Ideas tool. These are just a sample of the ideas that can be found there. The Options Idea tool contains numerous additional income and speculative plays. It also offers relative strength-based screens targeting the highest (and lowest) relative strength stocks and ETFs that have recently moved counter to their longer-term trend. To access or subscribe to the Options Ideas tool, click here.
Call
Chubb Ltd (CB) Jan 15 $350 Call

| Additional Data: | |
| Bid/Ask Spread | 11.96% |
| Delta | 63.7 |
| Gamma | 1.08 |
| Implied Volatility | 19.90% |
| Expiry Date | 81 |
| Earnings Date | 2/2/2027 |
Put
CIENA Corp (CIEN) Jan 15 $340 Put

| Additional Data: | |
| Bid/Ask Spread | 4.91% |
| Delta | -42.99 |
| Gamma | 0.34 |
| Implied Volatility | 74.66% |
| Expiry Date | 81 |
| Earnings Date | 12/10/2026 |
Income
Spotify Technology (SPOT) Nov 27 $535 Short Put
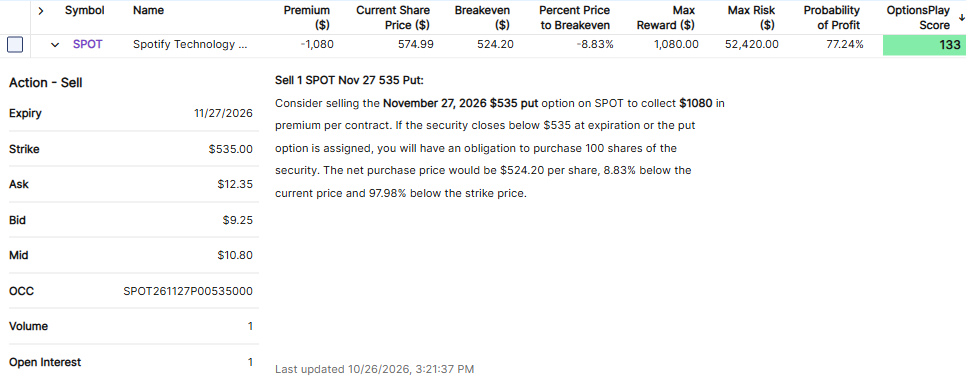
| Additional Data: | |
| Ann. Static Return | 23.45% |
| Bid/Ask Spread | 33.51% |
| Delta | 24.64 |
| Gamma | -0.45 |
| Implied Volatility | 38.48% |
| Expiry Date | 32 |
| Earnings Date | 2/9/2027 |
Daily Equity & Market Analysis
Loading, Please Wait...

