Most Requested Symbols

June is typically quite strong, but SPX has been trading well above its 50-day moving average for quite some time now... what does this mean for markets as we close out Q2?
With the Nasdaq-100 hitting 30,000, moments like these are a good time to reflect on how we got here and to frame expectations around where we might be headed next.
Weekly Rundown Video – May 27, 2026
Weekly rundown with NDW analyst team covering all major asset classes.
Weekly rundown with NDW analyst team covering all major asset classes.
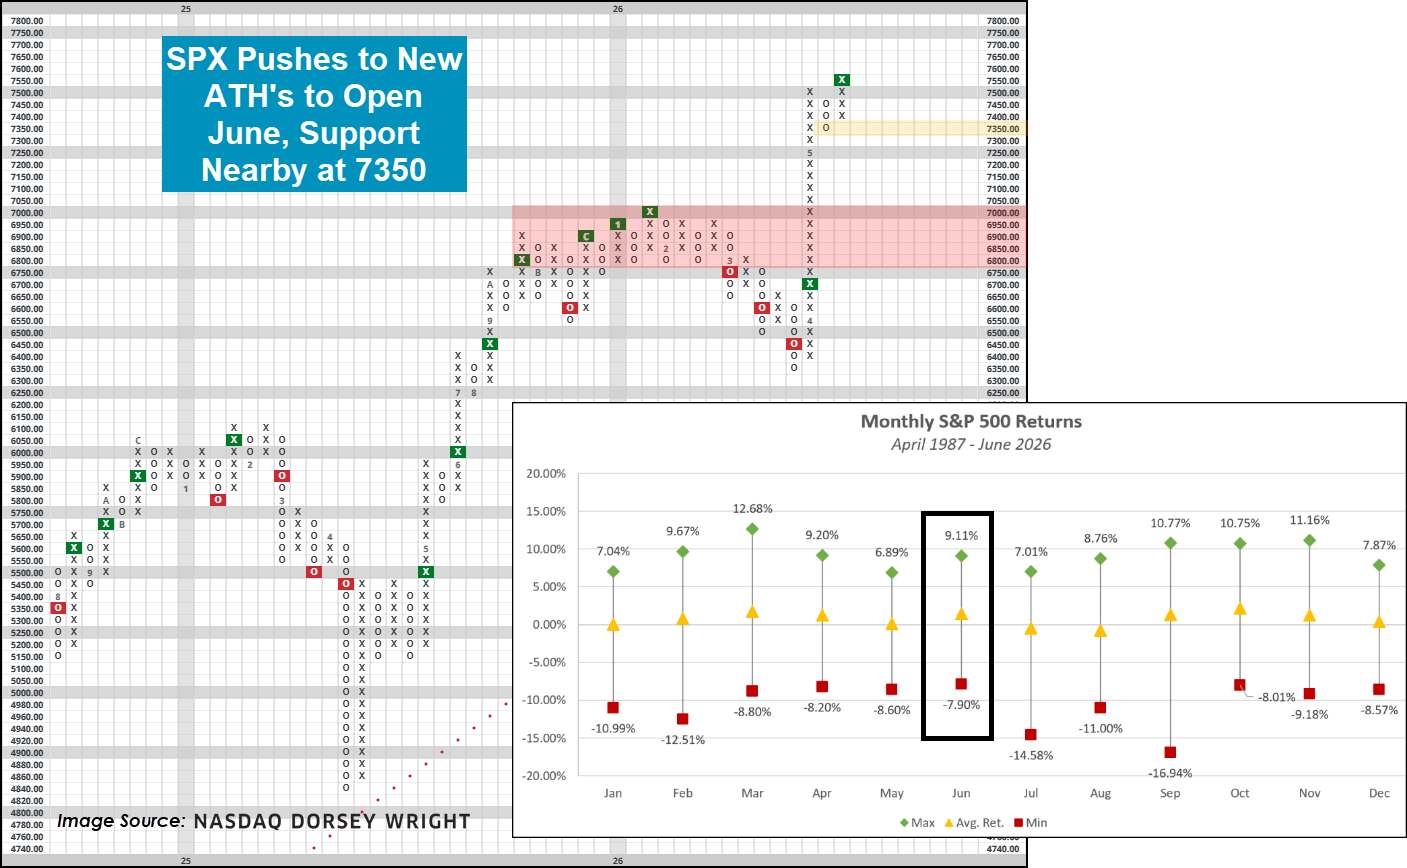
The S&P 500 continues to chug along, almost at merciless pace as we open up the month of June. With action on last Friday, SPX posted its second buy signal on its default chart, establishing action above 7,500 for the first time ever as technology dominance continues to push global markets to new highs. Newly established support at 7,350 marks the only point of defense between current levels and pre-7,000 levels, and will undoubtedly be an important point to watch if we do see some sort of exhale in the near-term. Included below are the average monthly returns for the S&P 500 in each month of the year. Some general statistics about June:
Remember, averages are just that, averages. Actual performance is almost never exactly the same as your “historical” normal, but having context based on history can be useful in identifying major landmarks that may be on the horizon as we wrap up Q2.
Speaking of straying from normalcy, one factor in play this June worth monitoring is how extended major markets are. We have hit on this topic many times over the past few weeks as things have continued to run higher, but we will put a slightly different spin on it for today’s report. As of 6/1, SPX has spent 21 consecutive days trading more than 5% above its 50-day moving average (the “mid” point on the chart). This has happened a total of 15 times since 1970…. But only once since 2000 as markets rebounded off the 2009 lows. Forwards returns across various timeframes following such an achievement are quite good, seeing TR.SPXX advance by roughly 20% in the following year. Perhaps even more impressive are the strong batting averages, detailed by the “% POS” which suggests that TR.SPXX was positive by some metric just over 90% of the time. The least productive instance was in 1987 where the S&P 500 was off just under 5% exactly one year later, although a glance at the 6-month metric revealed there was still 21% left in the tank directly after the 21-day streak. Take today’s study as a reminder that more often than not, overbought markets (or at least markets trading well above their 50-day MA) get that way because the underlying strength is quite strong…. not weak. While there will ultimately always be arguments that things are overdone in the near-term, more often than not strong markets continue to be just that in the intermediate- to long-term.


Despite some struggles earlier this year, the Nasdaq-100 (NDX) and other growth areas have put together an incredible start to 2026, with the last two months being particularly historic. The index is up 20% since the start of the year, putting it on track for the fourth consecutive +20% year. However, with woes to start the year, the index has gained over 30% from its March lows, allowing NDX to set record highs above 30,000. This obviously isn’t the first milestone for the index, and it (hopefully) won’t be the last, but moments like these are a good time to reflect on how we got here and to frame expectations around where we might be headed next.
Looking at previous milestones, the Nasdaq-100 hit 19 landmarks levels in our study, with each level being 20% - 33% above the previous one. Most recently, it took 230 days to move from 25k to 30k, during which NDX gained an annualized return of 33.6%. While impressive, both of those numbers are relatively normal for a new milestone, falling closely in line with the median of 264 days and a 33.4% annualized return.

Looking at historical averages can also help estimate the timing of when the index might reach its next landmark. Given that the most recent milestone was hit on May 26th and that it takes a median of 264 days (72% of a full year) to achieve the next landmark, we should expect roughly even odds that NDX will hit its next milestone before Valentines Day (Feb 14th). That said, the average duration and annualized return are notably higher than the median, with several outliers throwing things off. It took nearly 17 years for NDX to rise above 5,000 after initially moving above 4,000, while the lead-up to the dot-com bubble saw three landmark levels with triple-digit annualized returns, making the median a better baseline comparison. However, with the average length to new levels coming in at 624 days (1.71 years), that would place the long-run average timing closer to early 2028, though this estimate is heavily influenced by a small number of extended cycles.

In addition to the Nasdaq-100 setting notable a milestone, its technical picture has also seen significant developments as of late. The index has rocketed higher after its gradual decline marked by four consecutive sell signals in February and March. NDX recently moved to its second buy signal last week following some pullback from an extended column of Xs, leaving it with initial support at 28,600. Its next tradition support lies much lower from 22,800 to 23,000, but previous resistance from 23,800 to 26,000 could also serve as future support area. While the index’s long-term picture is extremely solid, it does trade in heavily overbought territory with an overbought/oversold (OBOS) reading of 111%, implying a heightened probability of near-term consolidation, so it wouldn’t be surprising to see it cool off over the next couple of weeks.

The main reason for the index’s overbought posture is just how much it’s risen in recent months. From March 29th to May 29th, NDX is up an incredible 31.13%, putting it on par with some of the best two-month periods ever seen. In fact, there’s only been nine other occasions in which the index has gained more than 25% over a two-month span. The forward returns of NDX following those instances were mostly positive, averaging a one-year return of 23.5%, suggesting continued upside on average, though with an incredibly wide range of outcomes. The market has been down as much as 39% following such moves, as the only times this occurred was around the dot com bubble or coming off market bottoms (2009, 2020, 2025). Very few—if any—of those instances came during “normal” periods, meaning we should take these numbers with a grain of salt.

Regardless of whichever way the market moves after this, our current environment sits in extremely rare company, and investors probably shouldn’t expect the next year to be “normal” either if history has anything to say about it. Thankfully, the weight of the evidence continues to support a positive outlook on the market, especially within growth and technology areas, even as uncertainty and anxiety reside among investors. If domestic equities continue to hold their current levels of relative strength, we could be talking about the Nasdaq-100 hitting 40,000 sooner than investors expect.
Average Level
35.93
| < - -100 | -100 - -80 | -80 - -60 | -60 - -40 | -40 - -20 | -20 - 0 | 0 - 20 | 20 - 40 | 40 - 60 | 60 - 80 | 80 - 100 | 100 - > |
|---|---|---|---|---|---|---|---|---|---|---|---|
|
Sell signalgld
|
|||||||||||
|
Buy signalGSG
|
|||||||||||
|
Sell signaluso
|
Buy signalrsp
|
||||||||||
|
Sell signalief
|
Buy signalfxe
|
Buy signalhyg
|
Buy signaldia
|
Buy signalXLG
|
|||||||
|
Sell signalshy
|
Sell signalagg
|
Buy signaldvy
|
Buy signaliwm
|
Buy signalVOOG
|
|||||||
|
Sell signaltlt
|
Buy signalGCC
|
Buy signalicf
|
Buy signalIJH
|
Buy signalVOOV
|
Buy signalSPY
|
||||||
|
Sell signaldx/y
|
Sell signallqd
|
Buy signalefa
|
Buy signalijr
|
Buy signalEEM
|
Buy signalONEQ
|
Buy signalQQQ
|
|||||
| < - -100 | -100 - -80 | -80 - -60 | -60 - -40 | -40 - -20 | -20 - 0 | 0 - 20 | 20 - 40 | 40 - 60 | 60 - 80 | 80 - 100 | 100 - > |
| AGG | iShares US Core Bond ETF |
| USO | United States Oil Fund |
| DIA | SPDR Dow Jones Industrial Average ETF |
| DVY | iShares Dow Jones Select Dividend Index ETF |
| DX/Y | NYCE U.S.Dollar Index Spot |
| EFA | iShares MSCI EAFE ETF |
| FXE | Invesco CurrencyShares Euro Trust |
| GLD | SPDR Gold Trust |
| GSG | iShares S&P GSCI Commodity-Indexed Trust |
| HYG | iShares iBoxx $ High Yield Corporate Bond ETF |
| ICF | iShares Cohen & Steers Realty ETF |
| IEF | iShares Barclays 7-10 Yr. Tres. Bond ETF |
| LQD | iShares iBoxx $ Investment Grade Corp. Bond ETF |
| IJH | iShares S&P 400 MidCap Index Fund |
| ONEQ | Fidelity Nasdaq Composite Index Track |
| QQQ | Invesco QQQ Trust |
| RSP | Invesco S&P 500 Equal Weight ETF |
| IWM | iShares Russell 2000 Index ETF |
| SHY | iShares Barclays 1-3 Year Tres. Bond ETF |
| IJR | iShares S&P 600 SmallCap Index Fund |
| SPY | SPDR S&P 500 Index ETF Trust |
| TLT | iShares Barclays 20+ Year Treasury Bond ETF |
| GCC | WisdomTree Continuous Commodity Index Fund |
| VOOG | Vanguard S&P 500 Growth ETF |
| VOOV | Vanguard S&P 500 Value ETF |
| EEM | iShares MSCI Emerging Markets ETF |
| XLG | Invesco S&P 500 Top 50 ETF |

| Symbol | Company | Sector | Current Price | Action Price | Target | Stop | Notes |
|---|---|---|---|---|---|---|---|
| BPOP | Popular, Inc. | Banks | $148.53 | hi 130s - low 150s | 200 | 120 | 5 for 5'er, 18 of 174 in favored BANK sector matrix, LT pos peer & mkt RS, triple top, good R-R, 2% yield |
| GRMN | Garmin Ltd. | Leisure | $233.92 | mid 230s - mid 260s | 364 | 196 | 5 TA rating, LT pos trend and mkt RS buy, top 33% of LEIS sector matrix, buy-on-pullback |
| OSW | OneSpaWorld Holdings Ltd. | Leisure | $23.75 | 22 - 24 | 30.50 | 19 | 5 for 5'er, top half of LEIS sector matrix, LT pos peer & mkt RS, spread quintuple top |
| SKT | Tanger Inc. | Real Estate | $36.07 | mid-to-hi 30s | 48 | 31 | 5 for 5'er, top 25% of REAL sector matrix, LT pos peer & mkt RS, R-R~2.0, 3.2% yield |
| IBOC | International Bancshares Corporation | Banks | $72.19 | low-to-mid 70s | 93 | 63 | 4 for 5'er, favored BANK sector, LT pos peer & mkt RS, bearish signal reversal, R-R~2.0, 1.95% yield |
| MSGE | Madison Square Garden Entertainment Corp. | Leisure | $70.53 | 63 to 69 | 98 | 53 | 5 for 5'er since Nov. 2025; Top Decile of Leisure Matrix; Pos. Trend since May 2025; ATH 5/7. |
| LYV | Live Nation Entertainment Inc. | Leisure | $168.41 | low 160s to mid 170s | 202 | 142 | 4 for 5'er; Pos. Trend; Top Half of Leisure Matrix; Within one box of ATH. |
| MO | Altria Group Inc. | Food Beverages/Soap | $69.58 | low-to-mid 70s | 91 | 62 | 4 for 5'er, top quartile of FOOD sector matrix, one box from RS buy, bullish triangle, 5.9% yield |
| MPC | Marathon Petroleum Corp. | Oil Service | $248.77 | 240 - 260 | 360 | 208 | 4 for 5'er, pos. trend, top third of Oil Services matrix, pos. L-T Mkt and Peer RS. |
| VLO | Valero Energy Corp | Oil Service | $244.82 | mid 230s - hi 250s | 328 | 212 | 4 TA rating, top 50% of OILS sector matrix, LT pos trend, buy-on-pullback |
| C | Citigroup, Inc. | Banks | $125.90 | low 120s - low 130s | 188 | 102 | 5 for 5'er since July '25; top decile of Banks matrix; pos. trend since May '25. |
| AMAT | Applied Materials, Inc. | Semiconductors | $450.06 | 420s - low 450s | 576 | 376 | 4 for 5'er, favored SEMI sector matrix, LT pos peer & mkt RS, shakeout --> triple top, good R-R |
| CTRE | CareTrust REIT Inc | Real Estate | $40.82 | $38 - $43 | 62.50 | 34 | 5/5'er since Apr. '25, top quintile of Real Estate Matrix, pos. trend and buy signal since Jul. '23. |
| TT | Trane Technologies PLC | Building | $451.30 | 420s - 470s | 652 | 380 | 5 TA rating, LT pos trend and mkt RS buy, top 50% of Building sector matrix, buy-on-pullback |
| BTI | British American Tobacco Sp-Adr (United Kingdom) ADR | Food Beverages/Soap | $61.79 | hi 50s - low 60s | 92 | 51 | 4 for 5'er, top 25% of FOOD sector matrix, one box from mkt RS buy, buy on pullback, R-R~3.0, 5.3% yield |
| Symbol | Company | Sector | Current Price | Action Price | Target | Stop | Notes |
|---|
| Symbol | Company | Sector | Current Price | Action Price | Target | Stop | Notes |
|---|---|---|---|---|---|---|---|
| SBUX | Starbucks Corporation | Restaurants | $99.16 | hi 90s - mid 100s | 129 | 85 | SBUX has fallen to a sell signal. OK to hold here. Raise stop to $90. |
| CELC | Celcuity Inc. | Biomedics/Genetics | $133.04 | low $130 - low $140 | 216 | 116 | CELC has fallen to a sell signal OK to hold here. Maintain $116 stop. |
| Comment | |||||||
|---|---|---|---|---|---|---|---|
|
|
|||||||
BTI British American Tobacco Sp-Adr (United Kingdom) ADR R ($61.38) - Food Beverages/Soap - BTI is a 4 for 5'er that ranks in the top quintile of the food beverages/soap sector matrix and sits one box away from giving a market RS buy signal, which would promote it to a 5 for 5'er. After giving, two consecutive sell signals, BTI returned to a buy signal with a double top break at $61 in mid-May and continued higher, reaching a multi-year high at $67. The stock has subsequently pulled back to near the middle of its trading band, offering an entry point for long exposure. Positions may be added in the upper $50s to low $60s and we will set our initial stop at $51, which would violate BTI's bullish support line. We will use the bullish price objective, $92, as our target price, giving us a reward-to-risk ratio of roughly 3.0. BTI also carries a 5.3% yield.
| 24 | 25 | 26 | |||||||||||||||||||||||||||
| 67.00 | X | 67.00 | |||||||||||||||||||||||||||
| 66.00 | X | O | 66.00 | ||||||||||||||||||||||||||
| 65.00 | X | O | 65.00 | ||||||||||||||||||||||||||
| 64.00 | X | O | 64.00 | ||||||||||||||||||||||||||
| 63.00 | X | X | X | O | 63.00 | ||||||||||||||||||||||||
| 62.00 | X | O | X | O | X | O | 62.00 | ||||||||||||||||||||||
| 61.00 | 2 | O | X | O | X | X | 61.00 | ||||||||||||||||||||||
| 60.00 | X | O | X | 3 | X | O | 4 | X | Mid | 60.00 | |||||||||||||||||||
| 59.00 | X | X | O | O | X | O | X | O | 5 | 59.00 | |||||||||||||||||||
| 58.00 | X | O | X | X | O | X | O | X | O | X | 58.00 | ||||||||||||||||||
| 57.00 | X | O | X | O | X | O | O | O | X | 57.00 | |||||||||||||||||||
| 56.00 | X | O | X | O | X | O | X | 56.00 | |||||||||||||||||||||
| 55.00 | 8 | 9 | X | 1 | X | O | 55.00 | ||||||||||||||||||||||
| 54.00 | X | O | X | O | 54.00 | ||||||||||||||||||||||||
| 53.00 | X | O | B | 53.00 | |||||||||||||||||||||||||
| 52.00 | X | O | X | • | 52.00 | ||||||||||||||||||||||||
| 51.00 | X | A | X | • | Bot | 51.00 | |||||||||||||||||||||||
| 50.00 | 7 | O | • | 50.00 | |||||||||||||||||||||||||
| 49.00 | X | • | 49.00 | ||||||||||||||||||||||||||
| 48.00 | X | • | 48.00 | ||||||||||||||||||||||||||
| 47.00 | X | • | 47.00 | ||||||||||||||||||||||||||
| 46.00 | 6 | • | 46.00 | ||||||||||||||||||||||||||
| 45.00 | X | • | 45.00 | ||||||||||||||||||||||||||
| 44.00 | 5 | X | • | 44.00 | |||||||||||||||||||||||||
| 43.00 | X | O | X | • | 43.00 | ||||||||||||||||||||||||
| 42.00 | • | X | 4 | X | O | X | • | 42.00 | |||||||||||||||||||||
| 41.00 | • | X | O | 3 | O | X | O | • | 41.00 | ||||||||||||||||||||
| 40.00 | • | 2 | O | X | O | X | • | 40.00 | |||||||||||||||||||||
| 39.00 | X | • | • | X | O | X | O | X | • | 39.00 | |||||||||||||||||||
| 38.00 | 9 | O | B | • | X | O | O | • | 38.00 | ||||||||||||||||||||
| 37.00 | X | O | X | O | X | • | 37.00 | ||||||||||||||||||||||
| 36.00 | 8 | A | X | O | X | • | 36.00 | ||||||||||||||||||||||
| 35.00 | X | O | 1 | • | 35.00 | ||||||||||||||||||||||||
| 34.00 | X | • | 34.00 | ||||||||||||||||||||||||||
| 33.00 | 7 | • | 33.00 | ||||||||||||||||||||||||||
| 32.00 | B | 6 | • | 32.00 | |||||||||||||||||||||||||
| 31.00 | X | O | X | • | 31.00 | ||||||||||||||||||||||||
| 30.00 | X | O | X | • | 30.00 | ||||||||||||||||||||||||
| 29.00 | C | • | 29.00 | ||||||||||||||||||||||||||
| 24 | 25 | 26 |
| AEP American Electric Power Company, Inc. ($124.19) - Utilities/Electricity - AEP broke a triple bottom at $124 to end a series of buy signals that began in July of last year. The stock continues to maintain a 3 technical attribute rating and ranks within the top quartile of the Electric Utilities sector matrix. From here, support lies at $114, the bullish support line, while additional can be found at $106. |
| ANET Arista Networks Inc ($172.23) - Telephone - Shares of ANET broke a double top at $162 for its second consecutive buy signal. Today's move also saw the stock reverse into Xs on its market RS chart, bringing it back into acceptable territory as a 3 for 5'er. Those on the sidelines should wait for the stock to regain peer relative strength to return, but ANET's recent bounce back is encouraging nonetheless. From here, significant resistance from all-time lies at $178. |
| CNC Centene Corporation ($61.42) - Healthcare - CNC moved up higher to complete a double top break at $61, marking its second consecutive buy signal. The 5 for 5'er ranks in the top decile of the healthcare sector matrix. The weekly OBOS indicates that the stock is in overbought territory, so wait for a normalization of the 10-week trading band before considering. Initial support is at $57, with additional support not seen until $32. |
| DKS Dick's Sporting Goods, Inc. ($219.70) - Retailing - DKS broke a double bottom at $216 to return to a sell signal after testing resistance at $236 on the chart. The stock has been at least a 2 for 5'er since February this year. From here, support now lies at $208, while the bullish support line sits at $198. |
| HSY The Hershey Company ($184.81) - Food Beverages/Soap - HSY moved lower and completed a double bottom break at $186, marking an intraday low below $184. With its latest move the stock reversed into a negative trend, bringing the 3 for 5'er down to a 2. A sell can be considered here. Initial resistance is at $200, with additional resistance at $236. |
| HUM Humana Inc. ($321.46) - Healthcare - HUM moved higher to complete a double top break at $316, marking its sixth consecutive buy signal. The 4 for 5'er moved up from a 3 last month after reversing back into a buy signal against its peers. Additionally, the stock ranks in the top decile of the healthcare sector matrix. The weekly OBOS indicates that the stock is in overbought territory, so wait for a normalization on the 10-week trading band before considering. Initial strong support is seen between $296-$300, with additional support at $232. |
| ORLY O'Reilly Automotive, Inc. ($86.72) - Autos and Parts - ORLY broke a spread quadruple bottom at $86 for a third sell signal and to bring the stock down to levels not seen since March of 2025. ORLY has been a 2 for 5'er since seeing a negative trend shift back in mid May, and now ranks within the bottom half of the Autos and Parts sector matrix. Beyond long-term support at current prices additional lies in the upper $70s. |
| PG The Procter & Gamble Company ($139.93) - Household Goods - PG reversed back down to complete a triple bottom break at $140, marking its second consecutive sell signal. The 2 for 5'er moved down from a 3 in April after reversing into a negative trend. A sell can be considered here. Initial resistance is at $148, with additional resistance at $152 |
| SCCO Southern Copper Corporation ($194.85) - Metals Non Ferrous - SCCO returned to a buy signal and a positive trend Monday when it broke a double top at $196 where it now sits against resistance. The positive trend change will promote SCCO to an acceptable 3 for 5'er. From here, support can be found at $166. |

The option suggestions featured here are pulled from the NDW Options Ideas tool. These are just a sample of the ideas that can be found there. The Options Idea tool contains numerous additional income and speculative plays. It also offers relative strength-based screens targeting the highest (and lowest) relative strength stocks and ETFs that have recently moved counter to their longer-term trend. To access or subscribe to the Options Ideas tool click here.
Call
Citigroup Inc August 21 $125 Call

| Additional Data: | |
| Bid/Ask Spread | 4.52% |
| Delta | 62.56 |
| Gamma | 1.95 |
| Implied Volatility | 33.26% |
| Expiry Days | 81 |
| Earnings Date | 7/14/2026 |
Put
JD.com Inc (JD) July 17 $30 Put

| Additional Data: | |
| Bid/Ask Spread | 19.05% |
| Delta | -58.18 |
| Gamma | 11.73 |
| Implied Volatility | 37.01% |
| Expiry Days | 45 |
| Earnings Date | 8/11/2026 |
Income (Covered Call)
CVS Health Corp (CVS) July 17 $97.50 Covered Call

| Additional Data: | |
| Ann. Static Return | 14.34% |
| Bid/Ask Spread | 17.86% |
| Delta | 71.92 |
| Gamma | -3.66 |
| Implied Volatility | 28.57% |
| Expiry Date | 46 |
| Earnings Date | 7/30/2026 |
Daily Equity & Market Analysis
Loading, Please Wait...
