
June is typically quite strong, but SPX has been trading well above its 50-day moving average for quite some time now... what does this mean for markets as we close out Q2?
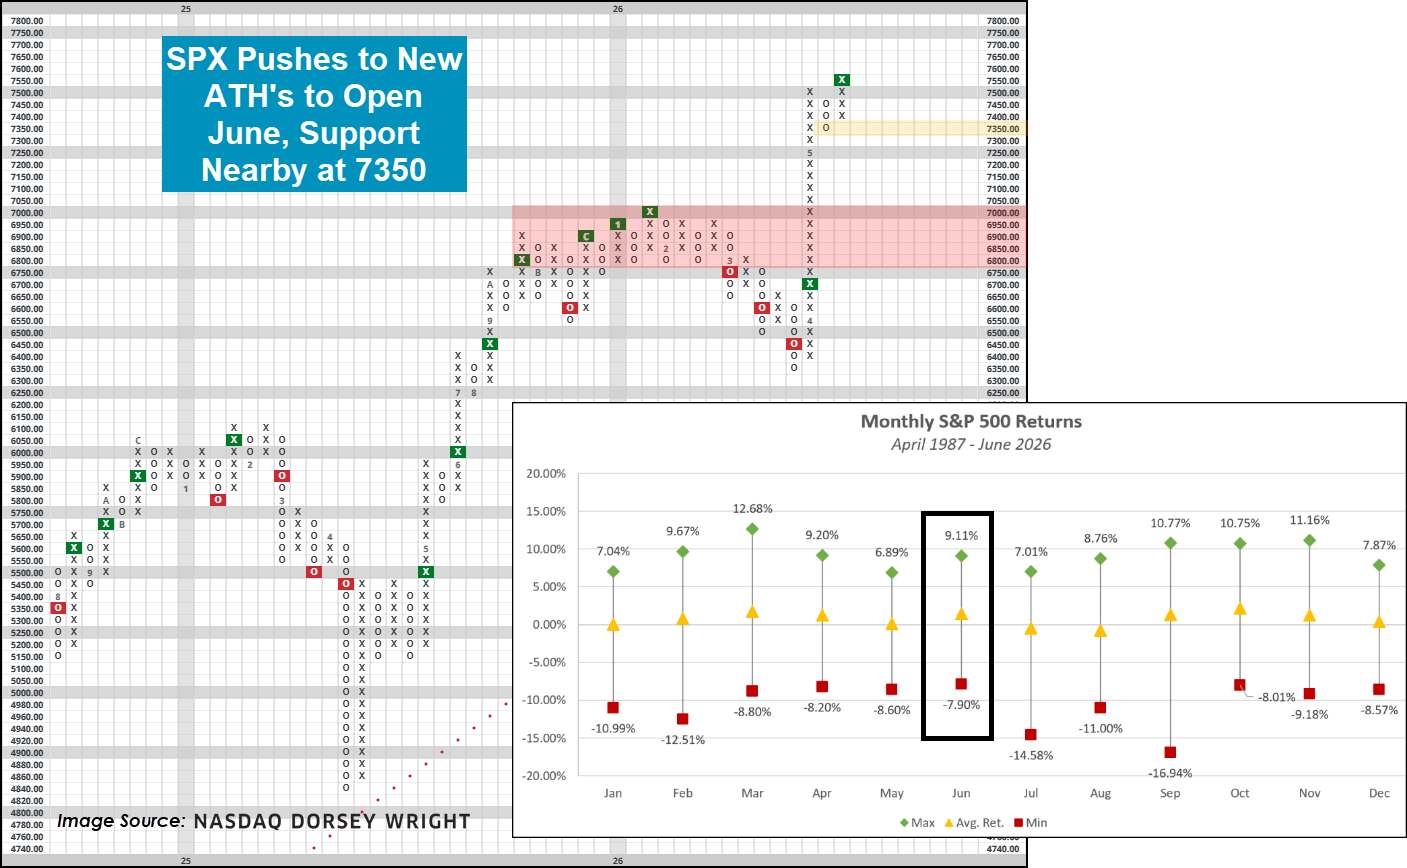
The S&P 500 continues to chug along, almost at merciless pace as we open up the month of June. With action on last Friday, SPX posted its second buy signal on its default chart, establishing action above 7,500 for the first time ever as technology dominance continues to push global markets to new highs. Newly established support at 7,350 marks the only point of defense between current levels and pre-7,000 levels, and will undoubtedly be an important point to watch if we do see some sort of exhale in the near-term. Included below are the average monthly returns for the S&P 500 in each month of the year. Some general statistics about June:
- The “average” June sees SPX gain just under 1.5%. This is the third best of the year on average, following just October (+2.16%) & March (+1.74%).
- June is positive just under two-thirds of the time. This batting average isn’t quite as strong comparatively as its average return, but is still better than more than half of the calendar months.
- Measured by the spread between its best (+9.11%) and worst (-7.90%) showing, June has a relatively tight performance spread of 17.01%.
Remember, averages are just that, averages. Actual performance is almost never exactly the same as your “historical” normal, but having context based on history can be useful in identifying major landmarks that may be on the horizon as we wrap up Q2.
Speaking of straying from normalcy, one factor in play this June worth monitoring is how extended major markets are. We have hit on this topic many times over the past few weeks as things have continued to run higher, but we will put a slightly different spin on it for today’s report. As of 6/1, SPX has spent 21 consecutive days trading more than 5% above its 50-day moving average (the “mid” point on the chart). This has happened a total of 15 times since 1970…. But only once since 2000 as markets rebounded off the 2009 lows. Forwards returns across various timeframes following such an achievement are quite good, seeing TR.SPXX advance by roughly 20% in the following year. Perhaps even more impressive are the strong batting averages, detailed by the “% POS” which suggests that TR.SPXX was positive by some metric just over 90% of the time. The least productive instance was in 1987 where the S&P 500 was off just under 5% exactly one year later, although a glance at the 6-month metric revealed there was still 21% left in the tank directly after the 21-day streak. Take today’s study as a reminder that more often than not, overbought markets (or at least markets trading well above their 50-day MA) get that way because the underlying strength is quite strong…. not weak. While there will ultimately always be arguments that things are overdone in the near-term, more often than not strong markets continue to be just that in the intermediate- to long-term.

