Reviewing model outperformance with the RS Spread Index near all-time highs
It’s a stock picker’s market. That phrase always seemed like filler to me as another line used by the financial media to grab attention. Plugging “stock picker’s market” into Google leaves you with the following definition, according to their AI-overview; “a stock picker's market is an investment environment where individual stocks perform differently from the broader market or their sector, allowing skilled investors to outperform general indices by hand-selecting specific equities.” That sounds innocent enough, but isn’t that always going to be the case? The nature of an index as a basket of stocks means that some stocks inside the index are going to outperform and others are going to underperform, leading to the aggregated index performance. Technically all markets are “stock picker’s markets,” as long as you pick the right stocks.
There are many different ways to pick stocks. Our approach at NDW focuses on maintaining exposure to momentum in the market. In other words, we buy the stocks that have done well and avoid the stocks that have lagged their peers. Just like any factor, momentum goes through periods of outperformance and periods of underperformance. We are currently in sharp period of outperformance for the factor, as shown through our RS Spread Index RSSPREAD. This index simply takes a basket of the top 1000 names by market cap and organizes them into quintiles based on trailing returns. We then take the top performing bucket minus the bottom performing bucket to get the spread between the leaders and laggards, generating the reading you see charted. The RSSPREAD tells us how well the momentum stocks picked by most of our strategies are working. If the reading is going higher, it’s a good time to be in momentum. If it is falling, that could point toward a simple momentum pause, or a period of rotation when leaders and laggards might be switching. Currently, the RSSPREAD is at fresh highs after marching higher since the first day of April.

Seeing the RS Spread Index at lofty levels might lead you to believe that you have missed the run. However, that line of thinking flies in the face of a momentum-based approach. We are in the business of buying winners and holding those winners as long as possible. The same can be said for the strategy itself. Could the momentum market turn around tomorrow? Certainly, a pullback would not be shocking given the extended outperformance. We saw some sharp downside action in many of the high momentum names Monday. If those high momentum names continue to weaken, they lose their high momentum status. Models following these trends do not try to predict what will happen next. They follow the trends until they change, then move into the new areas of strength. Also, trends that persist for prolonged periods of time typically lead to more favorable results. My colleague Miles Clark phrased this thought well in part 2 of the “Momentum Pitfalls” series; “evidence suggests that constant rotation of “buying high” is not necessarily a liability for momentum strategies, but rather the defining feature that drives long‑term results.” Most of our relative strength strategies tend to see a small number of trades make most of the excess returns, as he showed by examining the trade history for the Large Cap Core Model. This reinforces the importance of sticking with the process over time rather than constantly adjusting your process to fit your perceived understanding of the current market action.
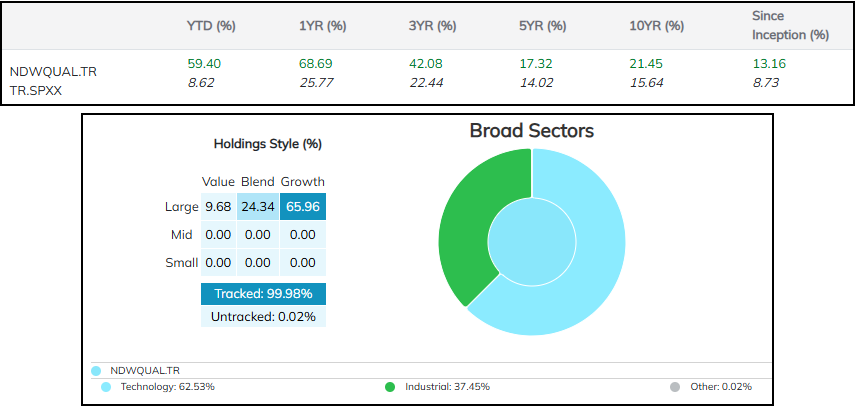
There are a multitude of stock models available on the NDW platform that have shown strength in the positive momentum environment. These range from sub-sector focused models to strategies centered around broad indices. One of the better performing models so far this year is the NDW Quality Factor Model, which has gained more than 59% (through 5/18) outpacing the total return of the S&P 500 Index (TR.SPXX), which has gained 8.6% over the same period.
The NDW Quality Factor Model looks at an inventory of roughly the top 1000 US stocks by market capitalization, filters that list once a year using quality rankings (debt-to-equity, ROE, and earnings variance), then focuses exposure on the top ten names. The Quality Model does not use any sector caps, allowing the exposure within the portfolio to flow wherever the relative strength dictates. This approach has led the model to focus exclusively on technology and industrials since the end of March, leading to major outperformance. Those looking to follow this strategy can set alerts directly through our Models page.