
The rise in equity prices over the last few years, despite some uncomfortable bumps in the road, has led the S&P 500 Index ([SPX]) to reach historically expensive levels.
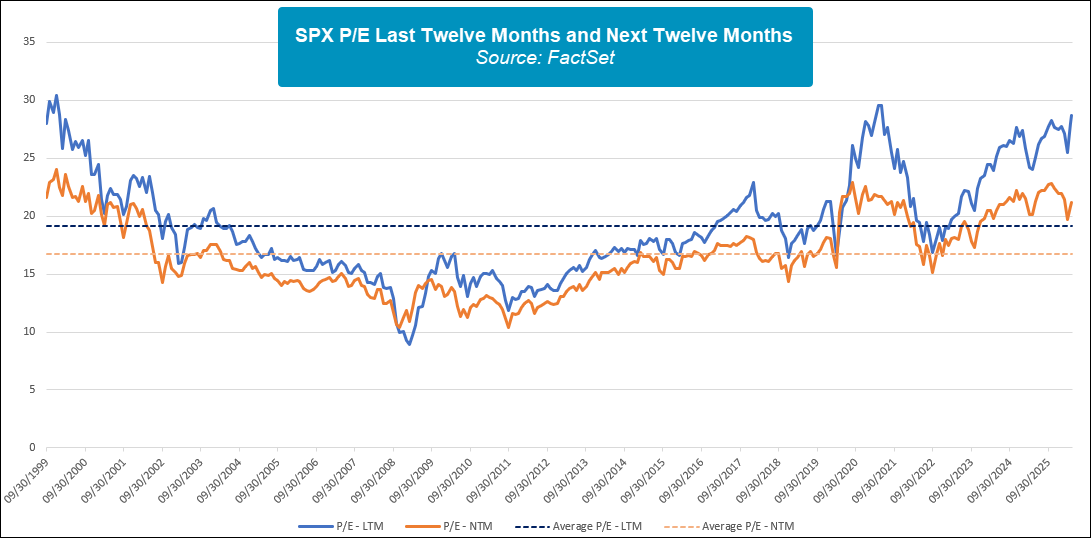
The rise in equity prices over the last few years, despite some uncomfortable bumps in the road, has led the S&P 500 Index (SPX) to reach historically expensive levels. With data going back to mid-1999, the P/E over the last twelve months (LTM) for SPX is nearly 30. The other two times the LTM P/E was this high were mid-2021 and 1999. However, LTM P/E is backwards looking and doesn’t focus on investor expectations for future earnings growth. Expectations of AI-driven economic growth naturally push the next twelve month (NTM) P/E for SPX down to about 21. It is normal for LTM P/E to be above NTM P/E as markets usually price in some form of earnings growth over the next year. However, both LTM and NTM P/E for SPX are well above their historical averages since 1999 of 19.1 and 16.7, respectively. Furthermore, both metrics are near the top-end of their historical ranges as highlighted in the chart below.
While it is almost always the case that LTM P/E is greater than NTM P/E, there is rarely this big of a spread between the two. The average historical spread between LTM P/E and NTM P/E is just over two but is currently north of seven. Plainly, there are enormous expectations for earnings growth to justify current prices. The last two times the spread between LTM P/E and NTM P/E hit seven were in October 1999 and April 2021. October 1999 naturally draws parallels to today with tech-related optimism. April 2021, while showing even higher earnings expectations, was fueled by unprecedented fiscal and monetary support for the economy as policymakers attempted to deal with the fallout from the covid shutdown. Even with some historical precedent, two prior occurrences are not nearly enough to make well-founded predictions about the future. Of course, AI could impact the economy even more than what is currently priced in the market. However, we can say that the expectations are exceptionally high and there is little room for error if markets are to remain at current price levels.

With the caveat of a small sample size behind us, the forward returns for SPX when the spread between LTM P/E and NTM P/E hits seven are muted. Average one year and two year forward returns are 0.02% and -9.62%, respectively. Interestingly, returns over the next six months were strong with both prior instances gaining over 7%. While we won’t know the forward returns until they happen, the prior one-year and two-year returns leading up to the P/E spread rising above seven are very similar this time to 1999 and 2021. While we have only mentioned point-to-point forward returns, both prior periods had large drawdowns over the next two years. Following both October 1999 and April 2021, SPX entered a bear market both times if using the common 20% decline to define a bear market. Before anyone gets too despondent (or excited), we have a small sample size and no real relative strength changes to suggest weakness is developing. However, if the market is unable to meet the current lofty expectations, we could see a similar situation to the last two times they were this high.

