Most Requested Symbols

Given some of the improvements we’ve seen, is now the time to hop back aboard the crypto train?
We examine the hypothetical performance of buying the S&P at all-time highs since 1980.
Weekly Rundown Video – May 6, 2026
Weekly rundown with NDW analyst team covering all major asset classes.
Weekly rundown with NDW analyst team covering all major asset classes.
Cryptocurrencies were in the depths of despair earlier this year, with Bitcoin and altcoins facing declines of 50% or more from their 2025 highs. Bitcoin peaked at $125k last October but fell as low as $60k in February. However, the last couple of months have offered signs of renewed hope for the crypto space. Bitcoin rallied more than 30% to return above $80k, bringing about notable technical developments. Given some of the improvements we’ve seen, is now the time to hop back aboard the crypto train?
The iShares Bitcoin Trust ETF (IBIT) is one of the most popular ways to gain exposure to Bitcoin. The fund completed its third consecutive buy signal this week and moved back into a positive trend last month. With recent action, it faces no traditional resistance until the $55 levels. Additionally, Bitcoin is back to passing its “bogey check,” reversing back into Xs against cash (MNYMKT) on 6.5% scale. Bitcoin sees the majority of its gains when “passing” and in Xs, so the reversal is a positive development.
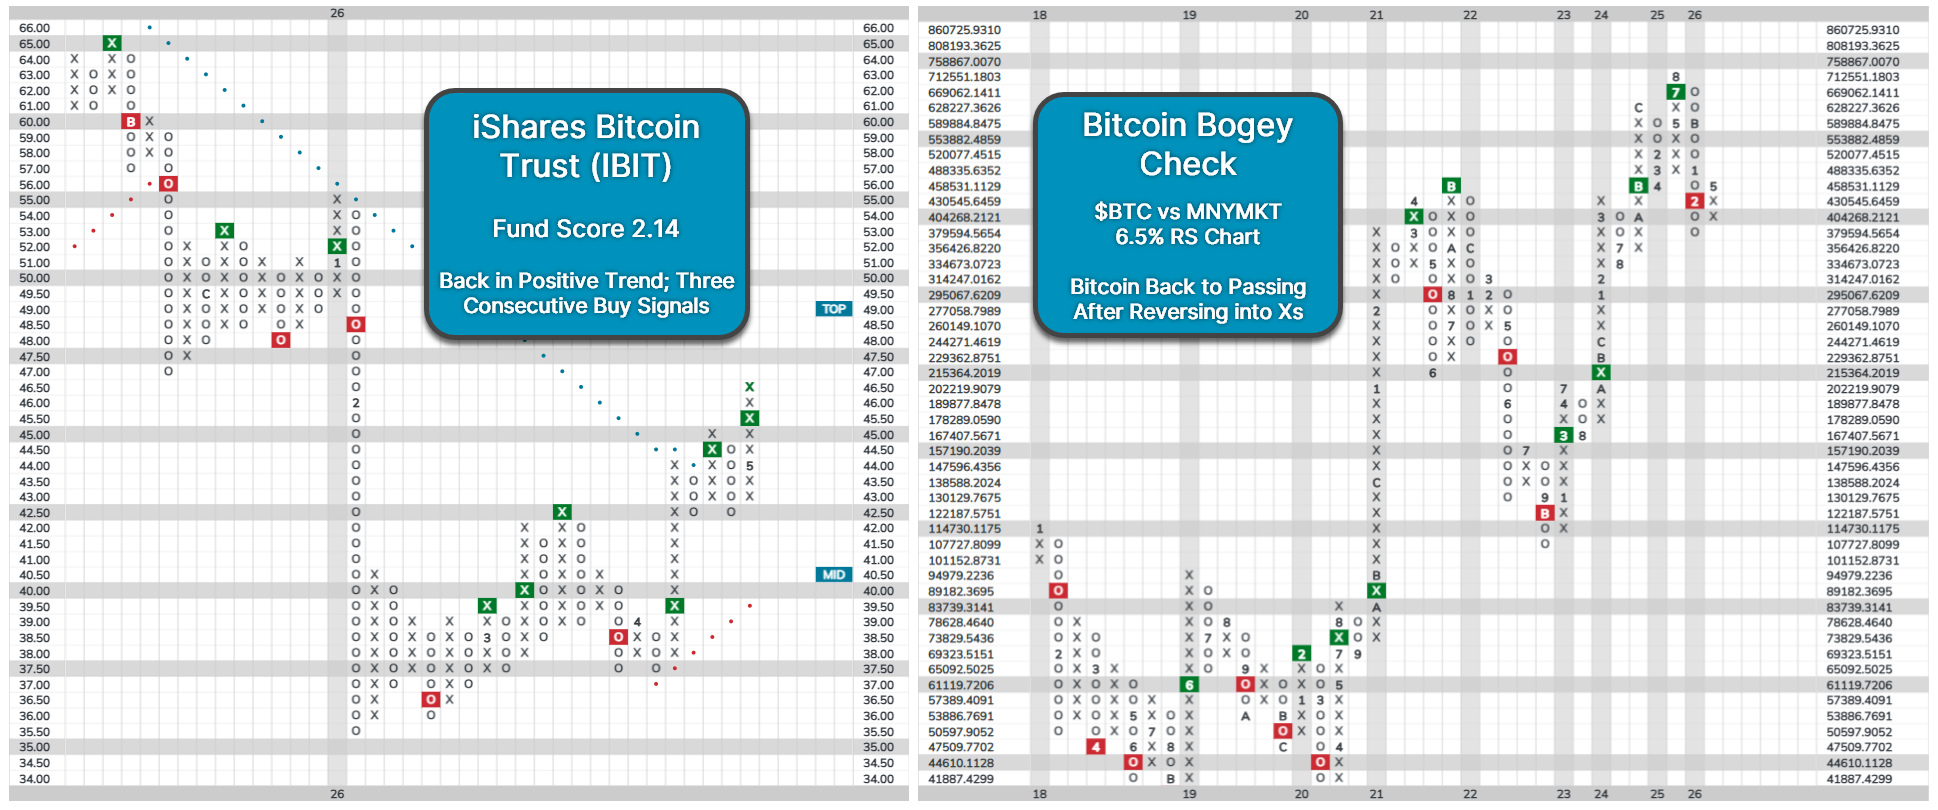
That said, not all that glitters is gold. Previous support on IBIT’s chart from $47 to $48 could serve as potential resistance, and the fund has a surprisingly low score of only 2.14. One of the biggest knocks against Bitcoin, and by extension IBIT, has been its underperformance relative to domestic equities. The coin moved to a market RS sell signal against the S&P 500 Equal Weight (SPXEWI) in January. And while Bitcoin reversed back into a column of Xs on its RS chart in April, it remains on an RS sell signal, indicating it’s still unfavored in the long term.

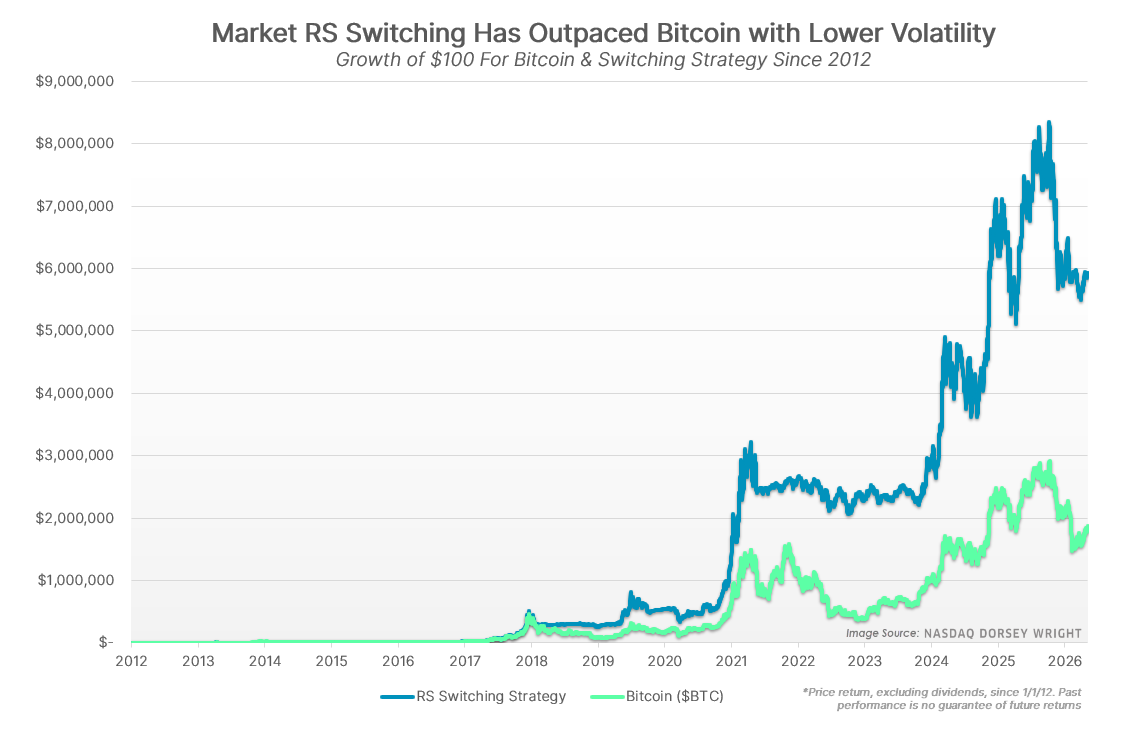
The market RS chart for Bitcoin has historically been one of the best indicators of Bitcoin’s strength. If you had invested $100 in Bitcoin at the beginning of 2012, it would be worth $1.7 million. However, if you had rotated between Bitcoin and SPXEWI based on RS buy signals, you would have made more than triple that, at $6 million. Additionally, the strategy experienced less downside, with a max drawdown of 70% compared to 85% for Bitcoin. For context, a security down 70% from its highs would need to fall by another 50% to be down 85%.
While the improvement in Bitcoin is encouraging, it would need to sustain its rebound for longer before its technical picture gives a full green light. History has shown that extreme downside within crypto can persist for longer than anticipated. Meanwhile, global equities and commodities exhibit high levels of relative strength, rounding out the top three spots in DALI. Investors seeking capital appreciation might be better off targeting those groups until there is further confirmation that crypto has turned a corner.

In Wednesday’s trading, the S&P 500 (SPX) hit a record high for the 16th time this year. As investors, we’re generally happy to see the market hitting new records. However, if you have money sitting on the sideline watching the market push relentlessly higher while you’re not fully invested can be nerve-racking. We’ve been trained “buy the dip”, “buy low, sell high” so putting money into the market when it’s trading at all-time highs can feel like a bit of a sucker’s bet. After all, a better buying opportunity will surely come along before too long, right?
There is a lot of “common wisdom” in this business, some of it good, some of it not so good and until you start doing some analysis, it can be hard to tell, which is which. So, what about the notion that we shouldn’t buy into a market that’s trading at an all-time high? In order to test this idea, we looked at every trading day since the beginning of 1980 and divided them into two categories – days the market hit a new all-time high (based on intraday high) and days that it didn’t. We then calculated the one-, three-, five-, and 10-year forward returns for each day and averaged them. The results are shown below.
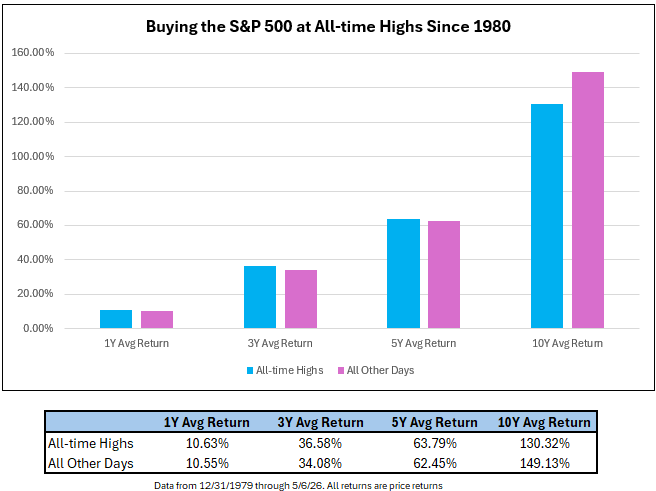
As you can see the results of our study show that over the intermediate-to-long-term buying all-time highs isn’t detrimental to overall returns. In fact, buying on days the market hit a new all-time high outperformed the average for all other days over the one-, three-, and five-year periods. Over the 10-year period, buying all-time high days outperformed buying other days, but the difference was relatively modest at 130% vs. 149%
Of course, some will still wonder, why would you buy the market at all-time highs when the 10-year average return is better for all other days? But what this argument overlooks is that the time in the market that is sacrificed, especially if waiting for a meaningful pullback. The S&P 500 hit its first all-time high after the Q1 slide on 4/15, and since then it’s gained an additional 4.9% through Wednesday’s (5/6) close. Two weeks ago, we discussed the merits of going all-in versus averaging into positions and found that, generally, it’s better to go all-in instead of hedging your bets by averaging into exposure. There is a common theme between this study and that one – time in the market typically works in your favor, even if you’re entering at a time when the common wisdom says the market is “expensive.”
As discussed in yesterday’s report, one of the major (perceived) pitfalls or criticisms of momentum strategies is that they often buy assets that are trading at or near record highs. The results of this study are also clear counterpoint to that criticism as over the last 45+ years, buying the S&P when it’s trading near all-time highs has produced strong returns over the intermediate- and long-term.
Average Level
39.92
| < - -100 | -100 - -80 | -80 - -60 | -60 - -40 | -40 - -20 | -20 - 0 | 0 - 20 | 20 - 40 | 40 - 60 | 60 - 80 | 80 - 100 | 100 - > |
|---|---|---|---|---|---|---|---|---|---|---|---|
|
Buy signalshy
|
Buy signalijr
|
||||||||||
|
Sell signaltlt
|
Buy signalefa
|
Buy signalEEM
|
|||||||||
|
Sell signalief
|
Buy signalfxe
|
Buy signalrsp
|
Buy signalicf
|
Buy signaliwm
|
Buy signalVOOG
|
||||||
|
Sell signaldx/y
|
Sell signalgld
|
Buy signalhyg
|
Sell signalUSO
|
Sell signaldia
|
Buy signalIJH
|
Buy signalSPY
|
Buy signalONEQ
|
||||
|
Sell signalagg
|
Sell signallqd
|
Buy signaldvy
|
Buy signalGSG
|
Buy signalVOOV
|
Buy signalGCC
|
Buy signalXLG
|
Buy signalQQQ
|
||||
| < - -100 | -100 - -80 | -80 - -60 | -60 - -40 | -40 - -20 | -20 - 0 | 0 - 20 | 20 - 40 | 40 - 60 | 60 - 80 | 80 - 100 | 100 - > |
| AGG | iShares US Core Bond ETF |
| USO | United States Oil Fund |
| DIA | SPDR Dow Jones Industrial Average ETF |
| DVY | iShares Dow Jones Select Dividend Index ETF |
| DX/Y | NYCE U.S.Dollar Index Spot |
| EFA | iShares MSCI EAFE ETF |
| FXE | Invesco CurrencyShares Euro Trust |
| GLD | SPDR Gold Trust |
| GSG | iShares S&P GSCI Commodity-Indexed Trust |
| HYG | iShares iBoxx $ High Yield Corporate Bond ETF |
| ICF | iShares Cohen & Steers Realty ETF |
| IEF | iShares Barclays 7-10 Yr. Tres. Bond ETF |
| LQD | iShares iBoxx $ Investment Grade Corp. Bond ETF |
| IJH | iShares S&P 400 MidCap Index Fund |
| ONEQ | Fidelity Nasdaq Composite Index Track |
| QQQ | Invesco QQQ Trust |
| RSP | Invesco S&P 500 Equal Weight ETF |
| IWM | iShares Russell 2000 Index ETF |
| SHY | iShares Barclays 1-3 Year Tres. Bond ETF |
| IJR | iShares S&P 600 SmallCap Index Fund |
| SPY | SPDR S&P 500 Index ETF Trust |
| TLT | iShares Barclays 20+ Year Treasury Bond ETF |
| GCC | WisdomTree Continuous Commodity Index Fund |
| VOOG | Vanguard S&P 500 Growth ETF |
| VOOV | Vanguard S&P 500 Value ETF |
| EEM | iShares MSCI Emerging Markets ETF |
| XLG | Invesco S&P 500 Top 50 ETF |

IMO Imperial Oil Limited R ($125.86) - Oil - IMO has maintained at least a 3 technical attribute stock for more than 12 months and a 5 for 5’er TA rating since June of 2025. The stock has maintained positive near- and long-term market relative strength since June of last year and positive near- and long-term peer relative strength since March 2025. On the default point and figure trend chart, IMO has maintained a positive trend since May of last year and returned to a buy signal by completing a shakeout pattern and marking a new all-time chart high to cap off April’s trading. This week’s action brought back into a column of Os to the mid $120s, just above the middle of the 10-week trading band. The stock is actionable here on the pullback or on a on a rally back toward highs in the mid $130s. We will utilize $112 as our initial stop as it would violate multiple levels of support and bring the chart to lowest level since February 2026. IMO maintains a current reward to risk ratio north of 3.5 with a bullish price objective of $164, our current price target.
Long Ideas
Symbol
Company
Sector
Current Price
Action Price
Target
Stop
Notes
COST
Costco Wholesale Corporation
Retailing
$995.75
944-1050s
1296
832
4 TA rating, top 33% of retail sector matrix, LT mkt RS buy, LT pos trend, consec buy signals, Earn. 5/28
DRI
Darden Restaurants, Inc.
Restaurants
$195.70
190s - low 200s
226
168
4 for 5'er, LT pos peer & mkt RS, pos trend flip, triple top, 3% yield
TJX
The TJX Companies, Inc.
Retailing
$155.45
150s - 160s
186
136
5 for 5'er. top third of RETA sector matrix, LR pos peer & mkt RS, triple top, Earn. 5/20
BPOP
Popular, Inc.
Banks
$150.04
hi 130s - low 150s
200
120
5 for 5'er, 18 of 174 in favored BANK sector matrix, LT pos peer & mkt RS, triple top, good R-R, 2% yield
HAS
Hasbro, Inc.
Leisure
$97.48
lo-hi 90s
122
79
5 TA rating, top 33% of LEIS sector matrix, LT pos trend, pos wkly mom, Earn. 5/20
GRMN
Garmin Ltd.
Leisure
$242.82
mid 230s - mid 260s
364
196
5 TA rating, LT pos trend and mkt RS buy, top 33% of LEIS sector matrix, buy-on-pullback
SBUX
Starbucks Corporation
Restaurants
$106.44
hi 90s - mid 100s
1296
85
4 for 5'er, top 20% of REST sector matrix, mkt RS reversal to Xs, triple top, 2.35% yield
OSW
OneSpaWorld Holdings Ltd.
Leisure
$25.31
22 - 24
30.50
19
5 for 5'er, top half of LEIS sector matrix, LT pos peer & mkt RS, spread quintuple top
FIVE
Five Below Inc
Retailing
$234.15
hi 220s - hi 240s
316
190
5/5'er since 6/25; top quintile of Retail matrix; R-R Ratio > 4; Earnings 6/3.
IMO
Imperial Oil Limited
Oil
$127.84
mid 120s to mid 130s
164
112
5 for 5'er; top quartile of Oil matrix; long term mkt and peer RS; Pos. Trend since May '25.
Short Ideas
Symbol
Company
Sector
Current Price
Action Price
Target
Stop
Notes
CPRT
Copart Incorporated
Autos and Parts
$33.39
hi 30s
28
42
1 TA rating, bottom 50% of AUTO sector matrix, NT and mkt RS sell last month, consec sell signals,Earn. 5/21
ADBE
Adobe Systems Incorporated
Software
$250.17
240s - 250s
168
288
0 for 5'er, bottom third of SOFT sector, LT neg mkt & peer RS, sell on rally, R-R>2.0
Follow-Up Comments
Comment
NDW Spotlight Stock
26
134.00
X
134.00
132.00
X
X
X
O
132.00
130.00
X
O
X
O
X
O
130.00
128.00
X
X
O
X
O
X
5
128.00
126.00
X
O
X
4
X
O
X
126.00
124.00
X
O
X
O
X
O
X
Mid
124.00
122.00
X
X
O
O
O
X
122.00
120.00
X
O
3
O
120.00
118.00
X
O
X
118.00
116.00
X
O
X
116.00
114.00
X
O
114.00
112.00
X
112.00
110.00
X
110.00
108.00
X
108.00
106.00
X
X
106.00
104.00
X
O
X
104.00
102.00
X
O
X
Bot
102.00
100.00
X
X
X
O
X
100.00
99.00
X
O
X
O
X
X
2
99.00
98.00
X
O
X
O
X
O
X
98.00
97.00
X
O
X
C
X
O
X
97.00
96.00
X
X
O
O
X
O
•
96.00
95.00
X
O
X
O
X
•
95.00
94.00
X
O
X
X
X
O
X
•
94.00
93.00
X
O
X
O
X
O
X
O
X
•
93.00
92.00
X
O
X
O
X
O
X
O
X
•
92.00
91.00
X
O
O
X
O
X
O
X
•
91.00
90.00
X
O
X
O
X
O
X
•
90.00
89.00
X
O
X
O
X
O
1
X
•
89.00
88.00
X
A
X
B
O
X
O
X
•
88.00
87.00
O
X
O
X
O
X
•
87.00
86.00
O
X
O
X
O
X
•
86.00
85.00
O
O
X
O
X
•
85.00
84.00
O
O
•
84.00
26
Create Watchlist
Create Watchlist
| AEM Agnico-Eagle Mines Ltd. ($188.91) - Precious Metals - AEM gave an initial buy signal Thursday when it broke a double top at $192. The outlook for the stock remains negative however, as AEM is an unfavorable 2 for 5'er. From here, the next level of potential resistance is AEM's bearish resistance line at $212. |
| BURL Burlington Stores, Inc. ($307.12) - Retailing - BURL reversed into Os and broke a double bottom at $304 for a second sell signal. This breakdown follows a negative trend change, which dropped the stock down to a 4 for 5'er. From here, support now lies at $300, while additional can be found in the $288 to $292 range on the chart. |
| CE Celanese Corporation ($58.71) - Chemicals - CE was down more than 5% on Thursday and fell to a sell signal and a negative trend on its default chart when it broke a double bottom at $61. CE continued lower to $59, where it now sits against support. The negative trend change will drop CE to a still acceptable 3 for 5'er and the stock ranks in the top quartile of the favored chemicals sector matrix. |
| FANG Diamondback Energy Inc ($189.57) - Oil - FANG fell to a sell signal Thursday when it broke a double bottom at $190. The outlook for the stock remains modestly positive, however, as FANG is a 3 for 5'er that ranks in the top half of the oil sector matrix. From here, the next level of support is FANG's bullish support line at $178. |
| NRG NRG Energy, Inc. ($142.26) - Utilities/Electricity - NRG broke a triple bottom at $148 to return the stock to a sell signal as shares fell to $142. The move also violates the bullish support line, which will drop the stock down to a 2 for 5'er trading in a negative trend. From here, support lies at $140, the March 2026 chart low, while a move into the $130s would mark the lowest chart level since May of last year. |
| PAAS Pan American Silver Corp ($57.93) - Precious Metals - After successfully testing its bullish support line, PAAS returned to a buy signal Thursday when it broke a double top at $61. Thursday's move adds to a modestly positive technical picture as PAAS is a 3 for 5'er that ranks in the top quintile of the precious metals sector matrix. |
| SRE Sempra Energy ($91.20) - Gas Utilities - SRE broke a double bottom at $92 to return to a sell signal as shares fell to $90. The move violates the bullish support line, which will drop the stock down to a 2 for 5'er trading in a negative trend. SRE now trades at levels not seen since February of this year. Support now resides at $84, the January 2026 chart low. |
| TPR Tapestry Inc. ($131.08) - Textiles/Apparel - TPR broke a spread triple bottom at $138 for a second sell signal as shares fell to $132 on the chart. The move takes out support in the upper $130s and brings the chart down to its lowest level since February. While still a 5 for 5'er in technical attribute rating, both the market and peer RS charts are within range of reversing down into Os. From here, support lies at $126, while the bullish support line sits at $110. |
| TSLA Tesla Inc. ($404.62) - Autos and Parts - TSLA broke a double top at $408 to complete a bullish triangle and count as a second buy signal for the stock. The stock maintains a 3 technical attribute rating and long-term RS buy signals against the market and its peer group. Note resistance at current prices as well as at $416. Initial support lies at $388, while additional can be found at $368 and $356, the bullish support line. |
| USFD US Foods Holding Corp. ($86.88) - Food Beverages/Soap - USFD shares fell sharply lower on earnings, moving to a sell signal with a break to a double bottom at $90. The stock also moved into a negative trend for the first time since 2022, brining it down to a 4 for 5'er. Those with exposure should hold on for now given its relative strength but should watch for further deterioration. From here, initial support lies at $80 and $75. |

| Name | Option Symbol | Action | Stop Loss |
|---|---|---|---|
| Altria Group Inc. - $69.04 | O: 26I70.00D18 | Buy the September 70.00 calls at 3.30 | 62.00 |
| Name | Option | Action |
|---|---|---|
| Fortinet Inc. ( FTNT) | Jul. 85.00 Calls | Raise the option stop loss to 19.00 (CP: 22.70) |
| Name | Option Symbol | Action | Stop Loss |
|---|---|---|---|
| AbbVie Inc. - $202.71 | O: 26V200.00D16 | Buy the October 200.00 puts at 14.15 | 224.00 |
| Name | Option | Action |
|---|---|---|
| Okta Inc ( OKTA) | Aug. 75.00 Puts | Stopped at 83.00 (CP: 80.93) |
| Floor & Decor Holdings Inc ( FND) | Jul. 50.00 Puts | Stopped at 52.00 (CP: 51.13) |
| Name | Option Sym. | Call to Sell | Call Price | Investment for 500 Shares | Annual Called Rtn. | Annual Static Rtn. | Downside Protection |
|---|---|---|---|---|---|---|---|
| On Semiconductor Corp. $ 105.77 | O: 26G105.00D17 | Jul. 105.00 | 8.20 | $ 46,930.85 | 55.47% | 38.93% | 7.04% |
| Name | Action |
|---|---|
| Palantir Technologies Inc. Class A ( PLTR) - 133.79 | Sell the July 150.00 Calls. |
| V.F. Corporation ( VFC) - 19.41 | Sell the August 22.00 Calls. |
| Delta Air Lines Inc. ( DAL) - 73.34 | Sell the July 72.50 Calls. |
| Starbucks Corporation ( SBUX) - 106.44 | Sell the September 110.00 Calls. |
| Citigroup, Inc. ( C) - 127.60 | Sell the July 130.00 Calls. |
| Amkor Technology, Inc. ( AMKR) - 77.22 | Sell the July 80.00 Calls. |
| Name | Covered Write |
|---|---|
|
|
|
Daily Equity & Market Analysis
Loading, Please Wait...
