Most Requested Symbols

With international equities still ranking first in our DALI asset class framework, it may be tempting to take a broad-based approach to the space. However, a more tactical strategy—overweighting areas of strength while underweighting areas of relative weakness—can enhance returns while also helping to mitigate downside risk.
Through Thursday’s (5/7) close, emerging markets have kept pace with the upper echelon of U.S. equity indices and outperformed its developed market counterparts.
Weekly Rundown Video – May 6, 2026
Weekly rundown with NDW analyst team covering all major asset classes.
Weekly rundown with NDW analyst team covering all major asset classes.
Beginners Series Webinar: Join us on Monday, May 11th at 2 PM (ET) for our NDW Beginners Series Webinar. This week's topic is: PnF Basics & Charting Overview. Register Here
With international equities still ranking first in our DALI asset class framework, it may be tempting to take a broad-based approach to the space. However, a more tactical strategy—overweighting areas of strength while underweighting areas of relative weakness—can enhance returns while also helping to mitigate downside risk.
International equities are generally divided into two primary segments: Developed Markets and Emerging Markets. Emerging markets refer to economies in transition, moving from developing toward more advanced status. Within most major emerging market indices, China historically represents a significant weighting—typically between 20–30%—giving it a substantial influence on overall performance.
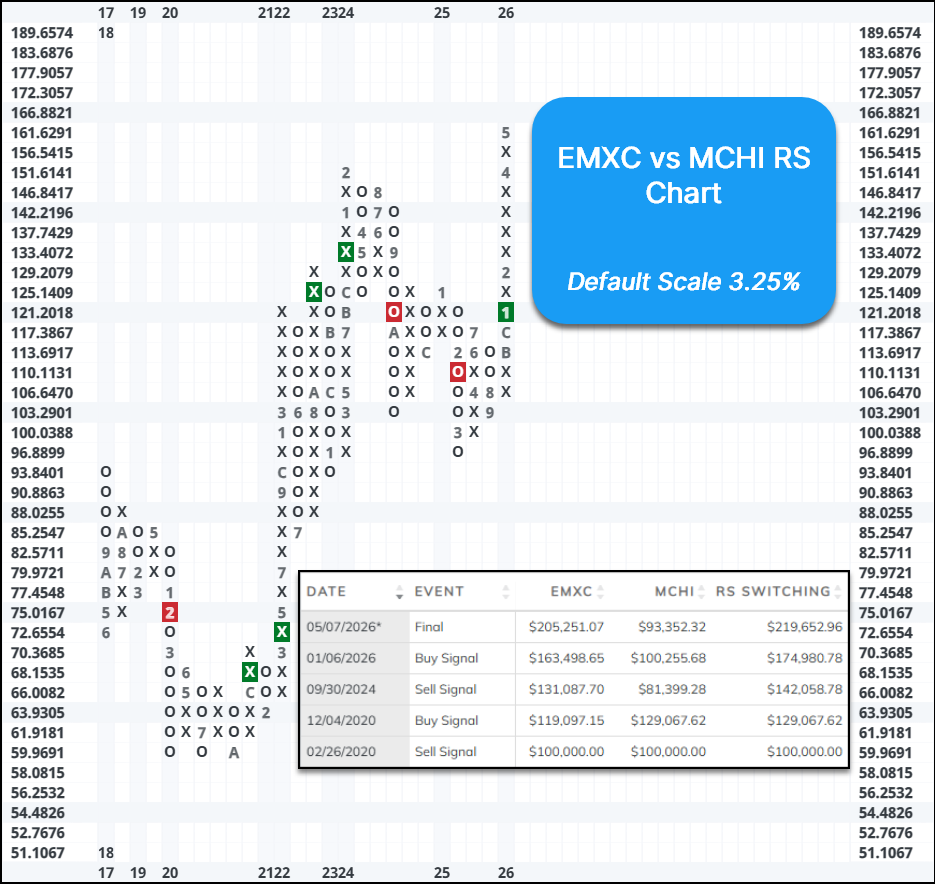
The chart below illustrates the Relative Strength (RS) relationship between the iShares MSCI Emerging Markets ex-China ETF (EMXC) and the iShares MSCI China ETF (MCHI), plotted on a 3.25% scale. This RS analysis highlights the performance of emerging markets excluding China relative to China itself. EMXC reversed into a column of Xs versus MCHI in early November 2025, followed by a confirmed RS buy signal in January 2026, signaling a clear shift in leadership toward non-China emerging markets. Additionally, a simple RS Switching strategy—owning EMXC on buy signals and MCHI on sell signals—has been positive, indicating that following the signal history would have resulted in outperformance.
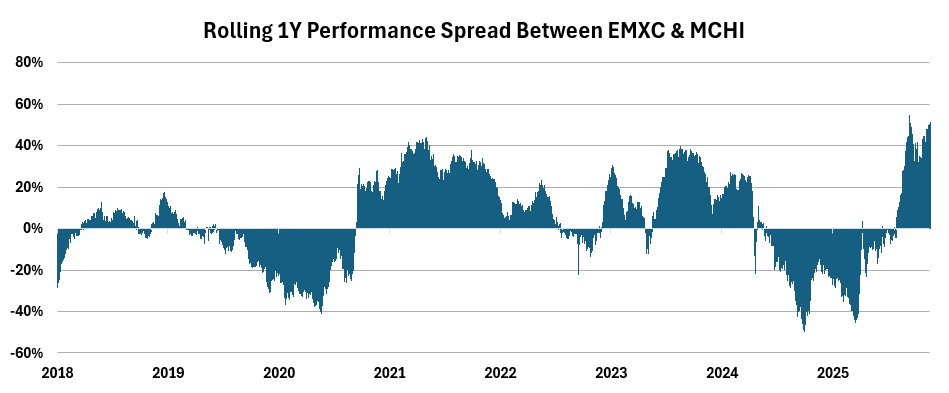
Taking the analysis a step further, the chart below shows the rolling one-year performance spread between EMXC (emerging markets ex-China) and MCHI (China proxy). While the dataset only extends back to 2018, the relative performance trends between these two segments have been both pronounced and persistent, with leadership often sustained over extended periods.
In 2024 and 2025, EMXC materially underperformed China, with one-year relative performance declining to worse than -40% at its trough in both years. However, this trend reversed sharply heading into 2026. Since China’s relative weakness began in November 2025, other emerging markets have continued to rally. As a result, EMXC has outperformed MCHI by approximately 50% over the past year, underscoring a meaningful shift in market leadership within emerging markets and illustrating the impact of selectively overweighting stronger segments while underweighting weaker ones.
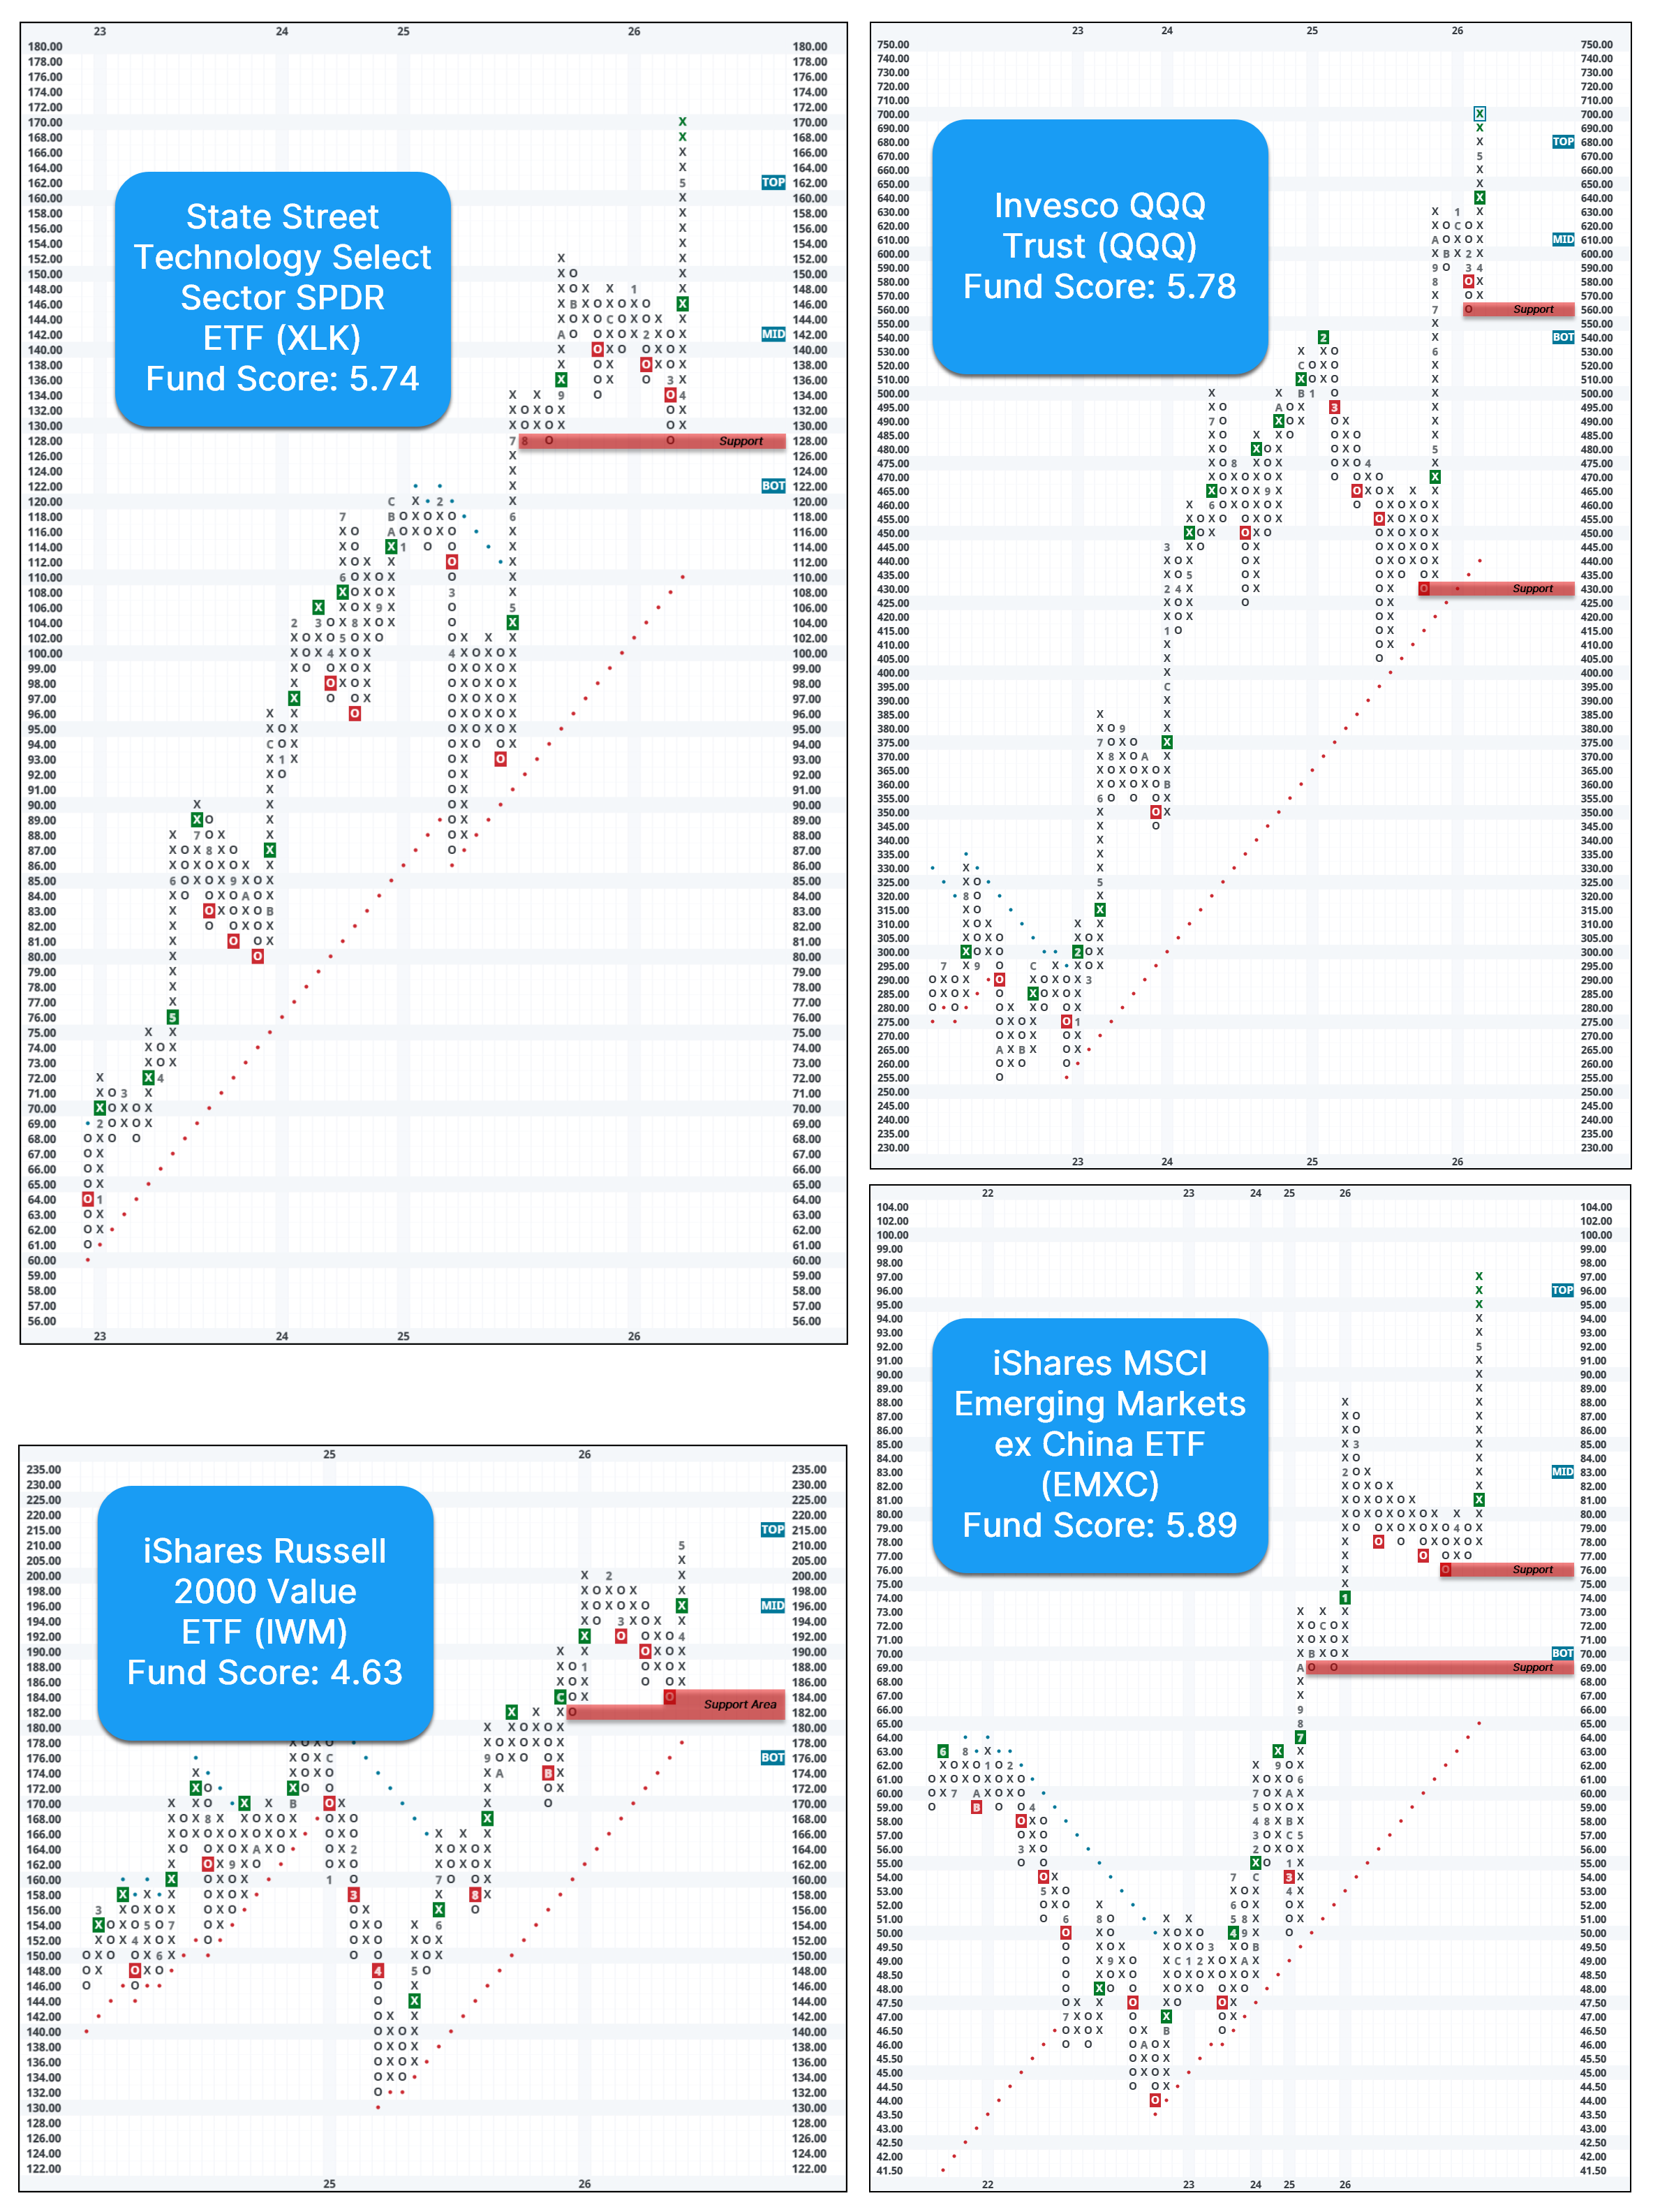
If you are looking to get exposure in emerging markets outside of China, you could consider the iShares MSCI Emerging Markets ex China ETF (EMXC). The fund completed a triple top break at $81 and is up 32% year-to-date. EMXC maintains a near perfect fund score of 5.89, with a positive score direction 0.75. Additionally, the fund offers a yield of ~2.3%. The weekly OBOS indicates that the stock is in overbought territory, so wait for the 10-week trading band to normalize before considering. Initial support can be seen at $76 to $77, with additional strong support at $69.


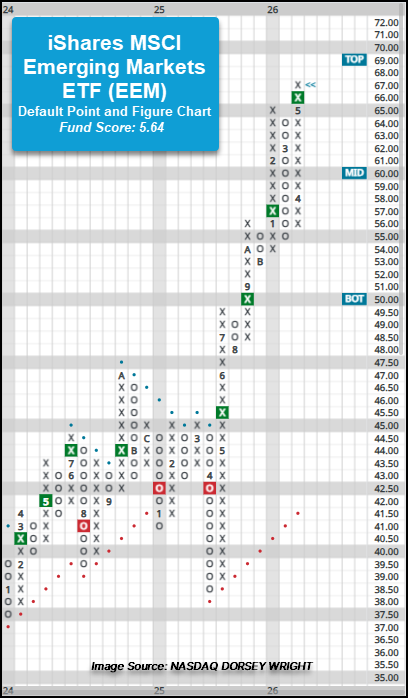
Through Thursday’s (5/7) close, emerging markets have kept pace with the upper echelon of U.S. equity indices and outperformed its developed market counterparts. The iShares MSCI Emerging Markets ETF (EEM) has gained more than 17% during Q2, adding more than 4% in May, lagging only the Nasdaq-100 (NDX) and Nasdaq Composite (NASD) in terms of broader market index performance for Q2 and being the top performing index in May.
On the default point and figure trend chart, EEM gave a fourth consecutive buy signal at $66 and reached a all-time chart high during Wednesday’s (5/6) trading session. The fund has shown positive near- and long-term market relative strength against the S&P 500 Equal Weight Index (SPXEWI) since September 2025, which coupled with the long-term positive trend and recent highs, brings the fund score to stellar 5.64 fund score, roughly 0.50 fund score points stronger than the average emerging market (5.06) fund group on the Asset Class Group Scores page. The rally to new highs this week has placed the ETF in overbought territory, and those considering broad emerging markets exposure could consider the fund on a pullback to the lower $60s. Initial support lies at $55, while additional can be found at $53 and $48.
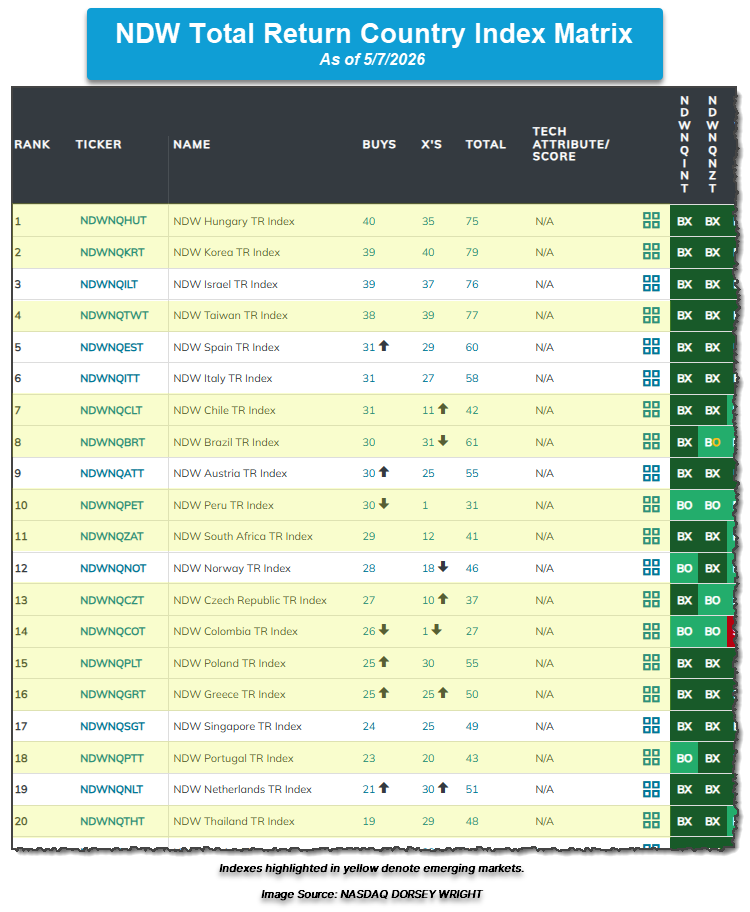
With broader emerging markets showing superior relative strength, it is worth diving into where leadership lies within individual countries. Below is the NDW Country Indices Matrix, which compares and ranks 41 NDW total return country indexes based on relative strength. As of Thursday’s (5/7) close, emerging markets maintain six out of the top 10 and 10 out of the top 15 spots within the matrix with Hungary, Korea, and Taiwan ranking in the top 5. A couple notable emerging market laggards within the matrix are India and China – see the Pulse article above pertaining to China’s recent underperformance.
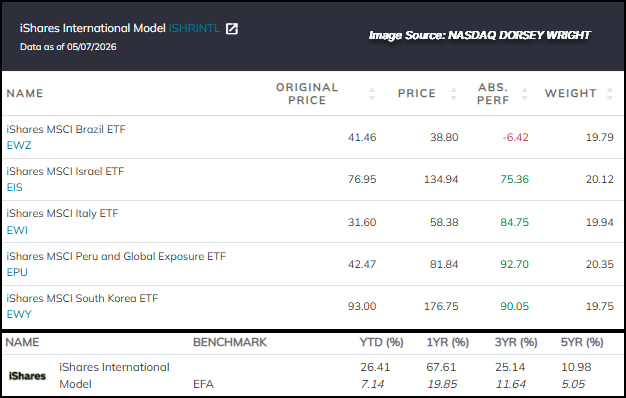
With international equities, notably emerging markets, showing superior relative strength, advisors may be seeking an objective, systematic process to maintain exposure to the asset class. Among the NDW ETF model solutions available on the Model’s page that has seen positive outperformance against its benchmark in 2025 and maintains an overweight toward emerging markets is the iShares International Model (ISHRINTL). The iShares International Model is a relative strength matrix driven model that seeks to maintain exposure to the five ETFs showing superior relative strength within a universe of 43 broad international and country specific ETFs. Bear in mind, the iShares International Model matrix rankings and holdings are based on a specific model matrix, not the one shown above. The model is evaluated weekly on Thursday’s, and the last change to the model came in April when Brazil was added and Poland was removed. As of yesterday’s (5/7) evaluation, the iShares International Model maintains exposure to South Korea (EWY), Peru (EPU), Italy (EWI), Israel (EIS), and Brazil (EWZ). The Model is up more than 26% year-to-date and has gained more than 60% in the last 1-year roll.
Should assistance when considering possible NDW international models or other international equity solutions within client portfolios be needed, feel free reach out to the analyst team for questions.
| Symbol | Name | Price | Yield | PnF Trend | RS Signal | RS Col. | Fund Score | 200 Day MA | Weekly Mom |
|---|---|---|---|---|---|---|---|---|---|
| DIA | State Street SPDR Dow Jones Industrial Average ETF Trust | 495.91 | 1.42 | Positive | Sell | X | 3.64 | 473.25 | + 4W |
| EEM | iShares MSCI Emerging Markets ETF | 66.59 | 1.94 | Positive | Buy | X | 5.64 | 55.85 | + 4W |
| EFA | iShares MSCI EAFE ETF | 102.89 | 3.08 | Positive | Sell | X | 3.74 | 96.50 | + 4W |
| IJH | iShares S&P MidCap 400 Index Fund | 73.66 | 1.22 | Positive | Buy | O | 4.37 | 67.25 | + 5W |
| IJR | iShares S&P SmallCap 600 Index Fund | 137.64 | 1.16 | Positive | Sell | X | 4.37 | 122.75 | + 5W |
| QQQ | Invesco QQQ Trust | 694.94 | 0.46 | Positive | Buy | X | 5.81 | 606.57 | + 5W |
| RSP | Invesco S&P 500 Equal Weight ETF | 203.54 | 1.53 | Positive | Sell | O | 2.87 | 193.02 | + 4W |
| SPY | State Street SPDR S&P 500 ETF Trust | 731.58 | 1.03 | Positive | Buy | X | 5.14 | 672.91 | + 5W |
| XLG | Invesco S&P 500 Top 50 ETF | 62.43 | 0.67 | Positive | Buy | O | 4.30 | 57.56 | + 5W |

Average Level
33.08
| < - -100 | -100 - -80 | -80 - -60 | -60 - -40 | -40 - -20 | -20 - 0 | 0 - 20 | 20 - 40 | 40 - 60 | 60 - 80 | 80 - 100 | 100 - > |
|---|---|---|---|---|---|---|---|---|---|---|---|
|
Buy signalfxe
|
|||||||||||
|
Buy signalefa
|
Sell signaldia
|
Buy signalijr
|
|||||||||
|
Buy signalshy
|
Sell signalagg
|
Sell signalUSO
|
Buy signalVOOV
|
Buy signalEEM
|
Buy signalSPY
|
||||||
|
Sell signalief
|
Sell signaldx/y
|
Sell signalgld
|
Buy signalGSG
|
Buy signalicf
|
Buy signaliwm
|
Buy signalXLG
|
Buy signalONEQ
|
||||
|
Sell signaltlt
|
Sell signallqd
|
Buy signalhyg
|
Buy signaldvy
|
Buy signalrsp
|
Buy signalIJH
|
Buy signalGCC
|
Buy signalVOOG
|
Buy signalQQQ
|
|||
| < - -100 | -100 - -80 | -80 - -60 | -60 - -40 | -40 - -20 | -20 - 0 | 0 - 20 | 20 - 40 | 40 - 60 | 60 - 80 | 80 - 100 | 100 - > |
| AGG | iShares US Core Bond ETF |
| USO | United States Oil Fund |
| DIA | SPDR Dow Jones Industrial Average ETF |
| DVY | iShares Dow Jones Select Dividend Index ETF |
| DX/Y | NYCE U.S.Dollar Index Spot |
| EFA | iShares MSCI EAFE ETF |
| FXE | Invesco CurrencyShares Euro Trust |
| GLD | SPDR Gold Trust |
| GSG | iShares S&P GSCI Commodity-Indexed Trust |
| HYG | iShares iBoxx $ High Yield Corporate Bond ETF |
| ICF | iShares Cohen & Steers Realty ETF |
| IEF | iShares Barclays 7-10 Yr. Tres. Bond ETF |
| LQD | iShares iBoxx $ Investment Grade Corp. Bond ETF |
| IJH | iShares S&P 400 MidCap Index Fund |
| ONEQ | Fidelity Nasdaq Composite Index Track |
| QQQ | Invesco QQQ Trust |
| RSP | Invesco S&P 500 Equal Weight ETF |
| IWM | iShares Russell 2000 Index ETF |
| SHY | iShares Barclays 1-3 Year Tres. Bond ETF |
| IJR | iShares S&P 600 SmallCap Index Fund |
| SPY | SPDR S&P 500 Index ETF Trust |
| TLT | iShares Barclays 20+ Year Treasury Bond ETF |
| GCC | WisdomTree Continuous Commodity Index Fund |
| VOOG | Vanguard S&P 500 Growth ETF |
| VOOV | Vanguard S&P 500 Value ETF |
| EEM | iShares MSCI Emerging Markets ETF |
| XLG | Invesco S&P 500 Top 50 ETF |
| Symbol | Company | Sector | Current Price | Action Price | Target | Stop | Notes |
|---|---|---|---|---|---|---|---|
| COST | Costco Wholesale Corporation | Retailing | $1012.06 | 944-1050s | 1296 | 832 | 4 TA rating, top 33% of retail sector matrix, LT mkt RS buy, LT pos trend, consec buy signals, Earn. 5/28 |
| DRI | Darden Restaurants, Inc. | Restaurants | $195.17 | 190s - low 200s | 226 | 168 | 4 for 5'er, LT pos peer & mkt RS, pos trend flip, triple top, 3% yield |
| BPOP | Popular, Inc. | Banks | $148.82 | hi 130s - low 150s | 200 | 120 | 5 for 5'er, 18 of 174 in favored BANK sector matrix, LT pos peer & mkt RS, triple top, good R-R, 2% yield |
| HAS | Hasbro, Inc. | Leisure | $97.38 | lo-hi 90s | 122 | 79 | 5 TA rating, top 33% of LEIS sector matrix, LT pos trend, pos wkly mom, Earn. 5/20 |
| GRMN | Garmin Ltd. | Leisure | $241.90 | mid 230s - mid 260s | 364 | 196 | 5 TA rating, LT pos trend and mkt RS buy, top 33% of LEIS sector matrix, buy-on-pullback |
| SBUX | Starbucks Corporation | Restaurants | $104.26 | hi 90s - mid 100s | 1296 | 85 | 4 for 5'er, top 20% of REST sector matrix, mkt RS reversal to Xs, triple top, 2.35% yield |
| OSW | OneSpaWorld Holdings Ltd. | Leisure | $24.58 | 22 - 24 | 30.50 | 19 | 5 for 5'er, top half of LEIS sector matrix, LT pos peer & mkt RS, spread quintuple top |
| FIVE | Five Below Inc | Retailing | $221.13 | hi 220s - hi 240s | 316 | 190 | 5/5'er since 6/25; top quintile of Retail matrix; R-R Ratio > 4; Earnings 6/3. |
| IMO | Imperial Oil Limited | Oil | $125.84 | mid 120s to mid 130s | 164 | 112 | 5 for 5'er; top quartile of Oil matrix; long term mkt and peer RS; Pos. Trend since May '25. |
| SKT | Tanger Inc. | Real Estate | $36.33 | mid-to-hi 30s | 48 | 31 | 5 for 5'er, top 25% of REAL sector matrix, LT pos peer & mkt RS, R-R~2.0, 3.2% yield |
| Symbol | Company | Sector | Current Price | Action Price | Target | Stop | Notes |
|---|---|---|---|---|---|---|---|
| CPRT | Copart Incorporated | Autos and Parts | $33.88 | hi 30s | 28 | 42 | 1 TA rating, bottom 50% of AUTO sector matrix, NT and mkt RS sell last month, consec sell signals,Earn. 5/21 |
| ADBE | Adobe Systems Incorporated | Software | $256.51 | 240s - 250s | 168 | 288 | 0 for 5'er, bottom third of SOFT sector, LT neg mkt & peer RS, sell on rally, R-R>2.0 |
| Symbol | Company | Sector | Current Price | Action Price | Target | Stop | Notes |
|---|---|---|---|---|---|---|---|
| TJX | The TJX Companies, Inc. | Retailing | $154.48 | 150s - 160s | 186 | 136 | Removed for earnings. Earn. 5/20 |
| Comment | |||||||
|---|---|---|---|---|---|---|---|
|
|
|||||||
SKT Tanger Inc. R ($36.60) - Real Estate - SKT is a 5 for 5'er that ranks in the top quartile of the real estate sector matrix and has been peer and market RS buy signals since 2020 and 2021, respectively. On its default chart, SKT has completed two consecutive buy signals and currently sits one box away from reaching a new multi-year high, which would come with a spread triple top break at $38. Long exposure may be added in the mid-to-upper $30s and we will set our initial stop at $31, which would take out two levels of support on SKT's default chart. We will use the bullish price objective, $48, as our target price, giving us a reward-to-risk ratio of around 2.0. SKT also carries a 3.2% yield.
| 23 | 24 | 25 | 26 | ||||||||||||||||||||||||||
| 37.00 | X | X | 4 | 37.00 | |||||||||||||||||||||||||
| 36.00 | X | O | 2 | X | O | X | 36.00 | ||||||||||||||||||||||
| 35.00 | B | O | X | O | 1 | 2 | O | X | Mid | 35.00 | |||||||||||||||||||
| 34.00 | A | C | X | O | X | O | X | 3 | 34.00 | ||||||||||||||||||||
| 33.00 | X | 1 | 3 | X | 8 | O | X | 33.00 | |||||||||||||||||||||
| 32.00 | X | O | X | O | 7 | O | 32.00 | ||||||||||||||||||||||
| 31.00 | 9 | 4 | X | O | X | Bot | 31.00 | ||||||||||||||||||||||
| 30.00 | 8 | O | X | 5 | X | 30.00 | |||||||||||||||||||||||
| 29.00 | 2 | X | O | O | 29.00 | ||||||||||||||||||||||||
| 28.00 | X | O | X | 28.00 | |||||||||||||||||||||||||
| 27.00 | C | O | X | • | 27.00 | ||||||||||||||||||||||||
| 26.00 | X | 7 | • | 26.00 | |||||||||||||||||||||||||
| 25.00 | X | B | • | 25.00 | |||||||||||||||||||||||||
| 24.00 | 8 | O | X | • | 24.00 | ||||||||||||||||||||||||
| 23.00 | 7 | O | X | • | 23.00 | ||||||||||||||||||||||||
| 22.00 | X | A | • | 22.00 | |||||||||||||||||||||||||
| 21.00 | 6 | • | 21.00 | ||||||||||||||||||||||||||
| 20.00 | X | 4 | 5 | • | 20.00 | ||||||||||||||||||||||||
| 19.50 | X | 2 | O | X | O | X | • | 19.50 | |||||||||||||||||||||
| 19.00 | • | X | O | 1 | O | X | O | X | • | 19.00 | |||||||||||||||||||
| 18.50 | O | • | • | B | O | X | O | X | O | X | • | 18.50 | |||||||||||||||||
| 18.00 | O | • | X | • | X | C | X | O | X | O | • | 18.00 | |||||||||||||||||
| 17.50 | O | X | X | O | X | O | 3 | • | 17.50 | ||||||||||||||||||||
| 17.00 | O | X | O | X | O | X | • | 17.00 | |||||||||||||||||||||
| 16.50 | O | X | O | 8 | O | X | • | 16.50 | |||||||||||||||||||||
| 16.00 | O | • | 6 | X | O | X | • | 16.00 | |||||||||||||||||||||
| 15.50 | • | O | 7 | O | X | • | 15.50 | ||||||||||||||||||||||
| 15.00 | O | X | 9 | A | • | 15.00 | |||||||||||||||||||||||
| 14.50 | O | X | O | X | • | 14.50 | |||||||||||||||||||||||
| 14.00 | O | • | O | X | • | 14.00 | |||||||||||||||||||||||
| 13.50 | • | O | • | 13.50 | |||||||||||||||||||||||||
| 23 | 24 | 25 | 26 |

| CAH Cardinal Health, Inc. ($183.80) - Drugs - CAH moved lower and completed a double bottom break at $184, marking its third consecutive sell signal. The 3 for 5'er lost two signals this month after reversing back into Os against both the market and its peers. Still, CAH is rated a hold, so wait before further technical deterioration and a normalization of the 10-week trading band before selling your position. Initial resistance is at $200, with additional resistance at $216. |
| CALY Callaway Golf Company ($17.61) - Leisure - CALY reversed into Xs and broke a double top at $16 for a fifth buy signal since November 2025 as shares rallied to $17.50. The breakout clears resistance in the upper $16 range that dates to 2024 and brings the chart to its highest level since August 2023. The stock has been at least a 4 for 5'er since June of last year and the stock ranks within the top quartile of the Leisure sector matrix. Okay to consider on a pullback to the mid $14 to $16 range. Initial support lies at $14, while the bullish support line sits at $13.50. |
| EXPE Expedia Group Inc. ($234.81) - Leisure - EXPE reversed into Os and broke a double bottom at $232 to return the stock to a sell signal as shares fell to $228. The move also violates the bullish support line, which will drop the stock down to a 4 for 5'er trading in a negative trend. Support lies at current levels, while additional can be found at $220 and $204. |
| MNST Monster Beverage Corp. ($85.78) - Food Beverages/Soap - Shares of MNST broke triple top and surged on earnings. The 5 for 5'er continues to be one of the strongest names in the consumer staples space. Today's action leaves the stock on a stem in overbought territory, so those looking to add should wait for consolidation or a pullback to the lower $80s. From here, initial support lies at $75 then $71, with the bullish support line also at $72. |
| TXRH Texas Roadhouse, Inc. ($179.79) - Restaurants - TXRH reversed into Xs and broke a double top at $164 as shares rallied to $182 on the chart. The move penetrates the bearish support line, flipping the trend back to positive and increasing the stock up to a 4 for 5'er. Okay to consider in the $170 to $180 range. Prior resistance at $174 may be seen as initial support, while the bullish support line sits in the mid $150s. |
| Name | Option Symbol | Action | Stop Loss |
|---|---|---|---|
| The Allstate Corporation - $213.41 | O: 26G210.00D17 | Buy the July 210.00 calls at 10.60 | 198.00 |
| Name | Option | Action |
|---|---|---|
| McDonald's Corporation ( MCD) | Sep. 310.00 Calls | Stopped at 280.00 (CP: 276.21) |
| Fortinet Inc. ( FTNT) | Jul. 85.00 Calls | Raise the option stop loss to 26.50 (CP: 28.50) |
| Name | Option Symbol | Action | Stop Loss |
|---|---|---|---|
| The Walt Disney Company - $107.87 | O: 26S110.00D17 | Buy the July 110.00 puts at 5.85 | 118.00 |
| Name | Option | Action |
|---|---|---|
| Abbott Laboratories ( ABT) | Aug. 115.00 Puts | Raise the option stop loss to 26.50 (CP: 28.50) |
| Zoetis Inc. ( ZTS) | Jul. 120.00 Puts | Raise the option stop loss to 34.40 (CP: 36.40) |
| Cognizant Technology Solutions ( CTSH) | Sep. 62.50 Puts | Raise the option stop loss to 9.70 (CP: 11.70) |
| Name | Option Sym. | Call to Sell | Call Price | Investment for 500 Shares | Annual Called Rtn. | Annual Static Rtn. | Downside Protection |
|---|---|---|---|---|---|---|---|
| eBay Inc. $ 106.42 | O: 26G110.00D17 | Jul. 110.00 | 6.00 | $ 51,206.40 | 33.17% | 24.78% | 4.54% |
| Name | Action |
|---|---|
| Palantir Technologies Inc. Class A ( PLTR) - 137.05 | Sell the July 150.00 Calls. |
| V.F. Corporation ( VFC) - 19.06 | Sell the August 22.00 Calls. |
| Delta Air Lines Inc. ( DAL) - 73.11 | Sell the July 72.50 Calls. |
| Starbucks Corporation ( SBUX) - 104.26 | Sell the September 110.00 Calls. |
| Citigroup, Inc. ( C) - 129.09 | Sell the July 130.00 Calls. |
| Amkor Technology, Inc. ( AMKR) - 72.27 | Sell the July 80.00 Calls. |
| On Semiconductor Corp. ( ON) - 100.61 | Sell the July 105.00 Calls. |
| Name | Covered Write |
|---|---|
|
|
|
Daily Equity & Market Analysis
Loading, Please Wait...
