Big stocks have done the majority of the heavy lifting so far coming off of 2026 lows. We explore just how intense this has been in today's report.
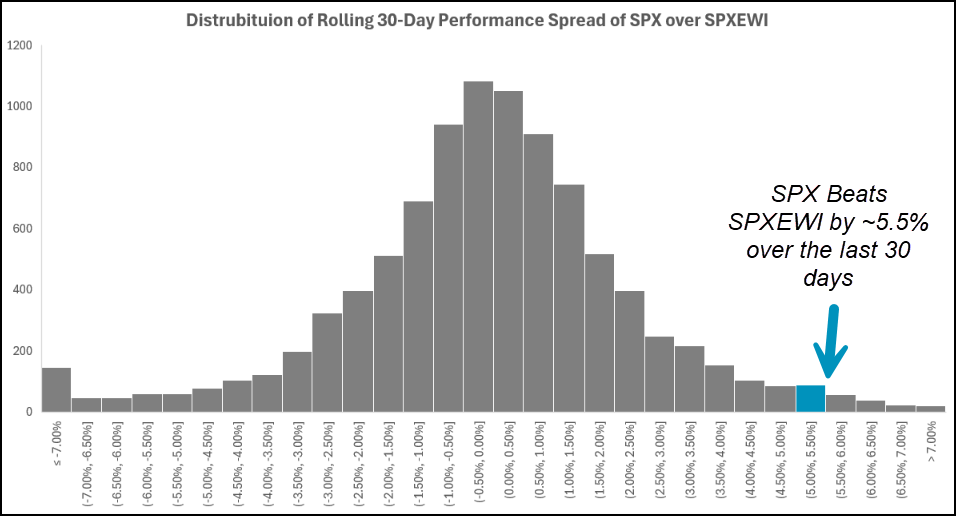
There has been no question that large names have been the featured leaders off of 2026 lows. Markets have been ushered to new-highs at the hands of semiconductors, which while historically overbought, have been stalwarts of relative strength over the last few months (or years, for that matter). All that to say, the rotation back towards the core of the market has led to somewhat significant near-term price appreciation, more heavily discussed on today’s featured article below. This article will focus primarily on the spread of performance in favor of the big names over the last month or so, which has reached somewhat significant levels as we sit roughly halfway through May. The cap weighted S&P 500 (SPX) has outperformed the equal weighted S&P 500 (SPXEWI) by nearly 5.50% over the last 30 days (9.10% vs. 3.74%, respectively) as major markets have quickly pushed to new highs off 2026 lows. This roughly 5.5% spread sits in the 98th percentile of all rolling 30-day spreads since 1990, as detailed in the table below. Some context- the “average” 30-day spread sits at -.13% signaling a slight historical preference for equal weighted assets over the last few decades. All this to say, cap weighted names have been doing a lot of the heavy lifting recently, and a bit of a cooldown wouldn’t be out of the question. Before moving further, it’s important to remember one key footnote about a possible “cooldown.” This spread can tighten in two distinct ways: equal weight assets “catching-up” or cap weighted assets slowing down. Furthermore, either of these scenarios can play out without major absolute depreciation from either asset as we sit around highs.
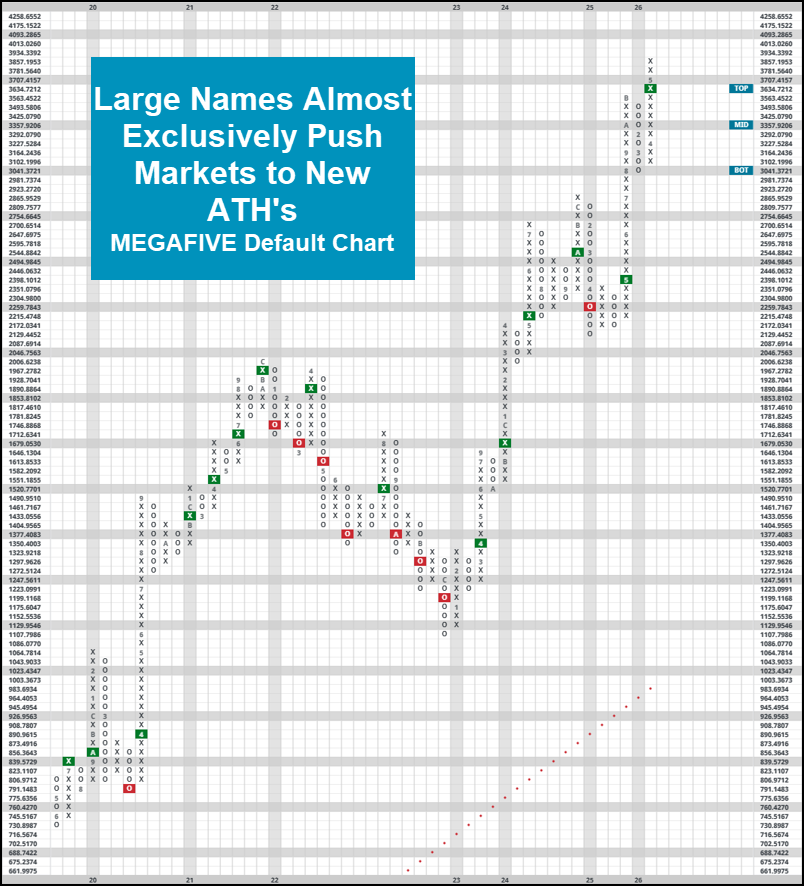
Expanding on this idea even further, we can look at a hypothetical portfolio of the top five largest names by market cap through the lens of ticker (MEGAFIVE). This hypothetical basket of stocks is reconstituted on an annual basis, and is a frequent help for the analyst team when we want to analyze the health of the market’s biggest contenders. MEGAFIVE currently consists of AAPL, MSFT, GOOGL, AMZN, & NVDA as mega-cap tech still dominates the market landscape. It is also worth mentioning that NDW also offers (MEGATEN), which consists of the top-ten largest names each year. MEGAFIVE is up over 18% for the last 30 days, highlighting the magnitude of strength from the top members of the market during this most recent rally. This 18% move is a 98.4 percentile move for any individual month, and the 9.08% spread between (MEGAFIVE) and SPX is a similarly strong 97 percentile relative performance for our larger names against the rest of the market. Although this certainly sounds stretched, the technical picture for MEGAFIVE (or [MEGATEN for that matter) are similarly strong. MEGAFIVE moved to new highs over the last few months, posting its second consecutive buy signal after some large stems of X’s on its default chart. There certainly is something to say about the magnitude of how overbought the backet is (note the 155% weekly OBOS reading as of 5/11) or the lack of support nearby (the next level of support is just over 20% away from current levels.) These items will undoubtedly be important points to watch as we move through the first half of the year, but markets are certainly telling us that the big guys are prepared to do the heavy lifting as they continue to push markets to new highs.