Through Thursday’s (5/7) close, emerging markets have kept pace with the upper echelon of U.S. equity indices and outperformed its developed market counterparts.
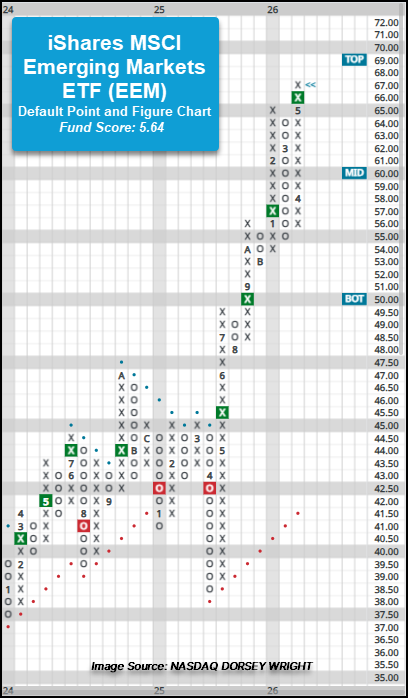
Through Thursday’s (5/7) close, emerging markets have kept pace with the upper echelon of U.S. equity indices and outperformed its developed market counterparts. The iShares MSCI Emerging Markets ETF (EEM) has gained more than 17% during Q2, adding more than 4% in May, lagging only the Nasdaq-100 (NDX) and Nasdaq Composite (NASD) in terms of broader market index performance for Q2 and being the top performing index in May.
On the default point and figure trend chart, EEM gave a fourth consecutive buy signal at $66 and reached a all-time chart high during Wednesday’s (5/6) trading session. The fund has shown positive near- and long-term market relative strength against the S&P 500 Equal Weight Index (SPXEWI) since September 2025, which coupled with the long-term positive trend and recent highs, brings the fund score to stellar 5.64 fund score, roughly 0.50 fund score points stronger than the average emerging market (5.06) fund group on the Asset Class Group Scores page. The rally to new highs this week has placed the ETF in overbought territory, and those considering broad emerging markets exposure could consider the fund on a pullback to the lower $60s. Initial support lies at $55, while additional can be found at $53 and $48.
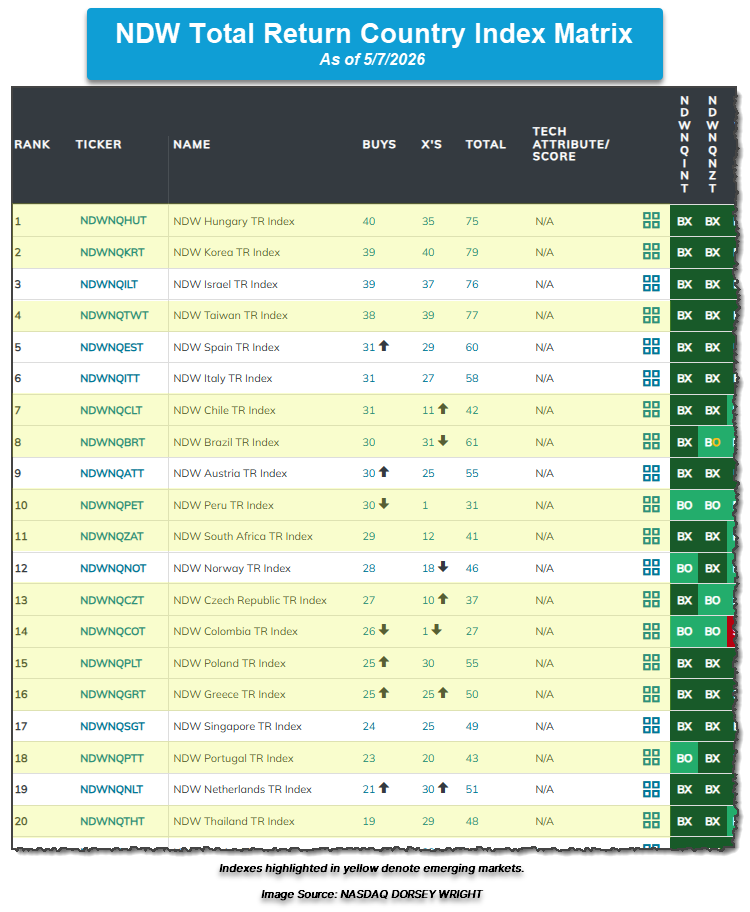
With broader emerging markets showing superior relative strength, it is worth diving into where leadership lies within individual countries. Below is the NDW Country Indices Matrix, which compares and ranks 41 NDW total return country indexes based on relative strength. As of Thursday’s (5/7) close, emerging markets maintain six out of the top 10 and 10 out of the top 15 spots within the matrix with Hungary, Korea, and Taiwan ranking in the top 5. A couple notable emerging market laggards within the matrix are India and China – see the Pulse article above pertaining to China’s recent underperformance.
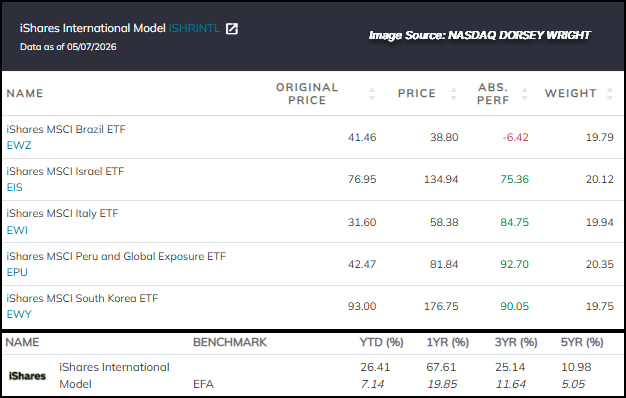
With international equities, notably emerging markets, showing superior relative strength, advisors may be seeking an objective, systematic process to maintain exposure to the asset class. Among the NDW ETF model solutions available on the Model’s page that has seen positive outperformance against its benchmark in 2025 and maintains an overweight toward emerging markets is the iShares International Model (ISHRINTL). The iShares International Model is a relative strength matrix driven model that seeks to maintain exposure to the five ETFs showing superior relative strength within a universe of 43 broad international and country specific ETFs. Bear in mind, the iShares International Model matrix rankings and holdings are based on a specific model matrix, not the one shown above. The model is evaluated weekly on Thursday’s, and the last change to the model came in April when Brazil was added and Poland was removed. As of yesterday’s (5/7) evaluation, the iShares International Model maintains exposure to South Korea (EWY), Peru (EPU), Italy (EWI), Israel (EIS), and Brazil (EWZ). The Model is up more than 26% year-to-date and has gained more than 60% in the last 1-year roll.
Should assistance when considering possible NDW international models or other international equity solutions within client portfolios be needed, feel free reach out to the analyst team for questions.