
With international equities still ranking first in our DALI asset class framework, it may be tempting to take a broad-based approach to the space. However, a more tactical strategy—overweighting areas of strength while underweighting areas of relative weakness—can enhance returns while also helping to mitigate downside risk.
Beginners Series Webinar: Join us on Monday, May 11th at 2 PM (ET) for our NDW Beginners Series Webinar. This week's topic is: PnF Basics & Charting Overview. Register Here
With international equities still ranking first in our DALI asset class framework, it may be tempting to take a broad-based approach to the space. However, a more tactical strategy—overweighting areas of strength while underweighting areas of relative weakness—can enhance returns while also helping to mitigate downside risk.
International equities are generally divided into two primary segments: Developed Markets and Emerging Markets. Emerging markets refer to economies in transition, moving from developing toward more advanced status. Within most major emerging market indices, China historically represents a significant weighting—typically between 20–30%—giving it a substantial influence on overall performance.
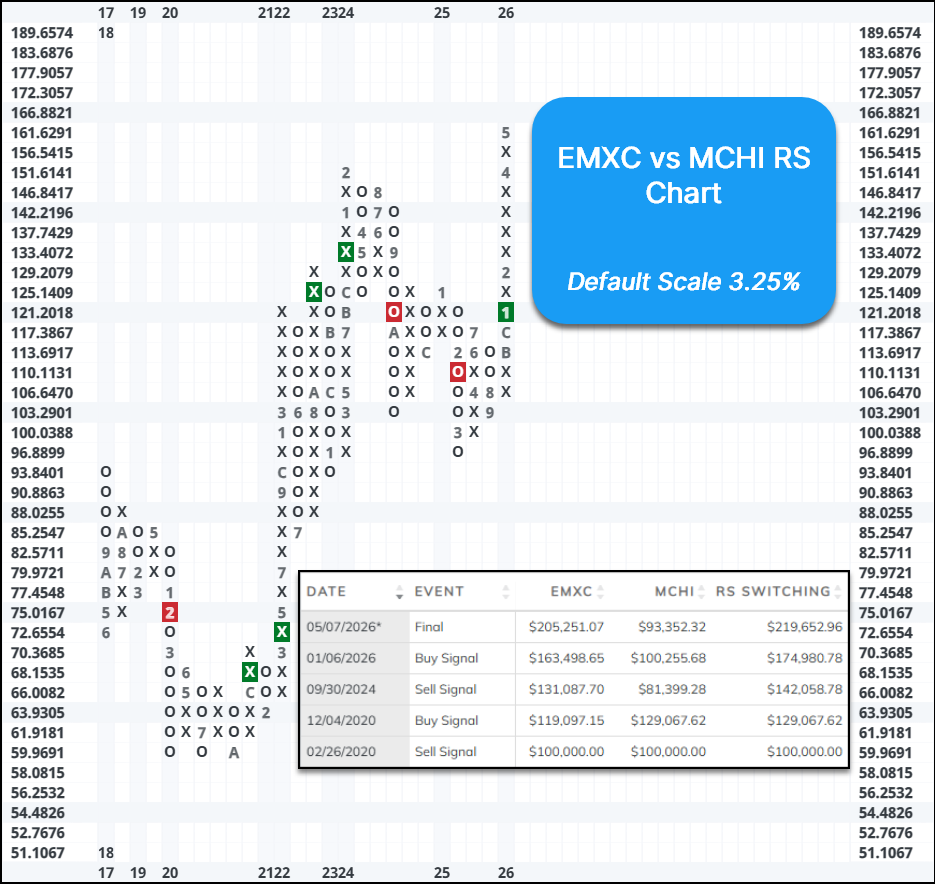
The chart below illustrates the Relative Strength (RS) relationship between the iShares MSCI Emerging Markets ex-China ETF (EMXC) and the iShares MSCI China ETF (MCHI), plotted on a 3.25% scale. This RS analysis highlights the performance of emerging markets excluding China relative to China itself. EMXC reversed into a column of Xs versus MCHI in early November 2025, followed by a confirmed RS buy signal in January 2026, signaling a clear shift in leadership toward non-China emerging markets. Additionally, a simple RS Switching strategy—owning EMXC on buy signals and MCHI on sell signals—has been positive, indicating that following the signal history would have resulted in outperformance.
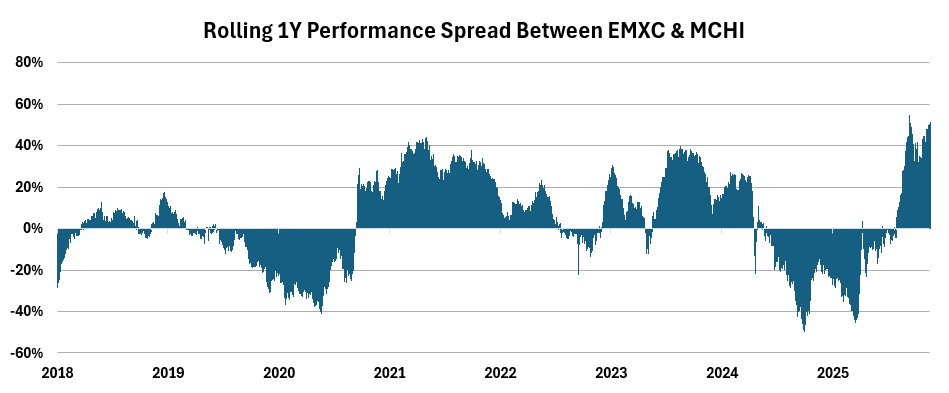
Taking the analysis a step further, the chart below shows the rolling one-year performance spread between EMXC (emerging markets ex-China) and MCHI (China proxy). While the dataset only extends back to 2018, the relative performance trends between these two segments have been both pronounced and persistent, with leadership often sustained over extended periods.
In 2024 and 2025, EMXC materially underperformed China, with one-year relative performance declining to worse than -40% at its trough in both years. However, this trend reversed sharply heading into 2026. Since China’s relative weakness began in November 2025, other emerging markets have continued to rally. As a result, EMXC has outperformed MCHI by approximately 50% over the past year, underscoring a meaningful shift in market leadership within emerging markets and illustrating the impact of selectively overweighting stronger segments while underweighting weaker ones.
If you are looking to get exposure in emerging markets outside of China, you could consider the iShares MSCI Emerging Markets ex China ETF (EMXC). The fund completed a triple top break at $81 and is up 32% year-to-date. EMXC maintains a near perfect fund score of 5.89, with a positive score direction 0.75. Additionally, the fund offers a yield of ~2.3%. The weekly OBOS indicates that the stock is in overbought territory, so wait for the 10-week trading band to normalize before considering. Initial support can be seen at $76 to $77, with additional strong support at $69.

