
So far, the second quarter has seen 30 of the 40 sector bullish‑percent charts return to a column of Xs, suggesting a notable increase in stocks maintaining point and figure buy signals.
While Thursday’s (4/9) trading was comparatively muted, the positive impact on U.S. equity indices and intermediate‑ and long‑term indicators from Wednesday’s (4/8) trading was significant. The notable amount of positive action within indicators, such as the bullish percents, deserves a deeper analysis of which sectors or subsectors were the biggest contributors.
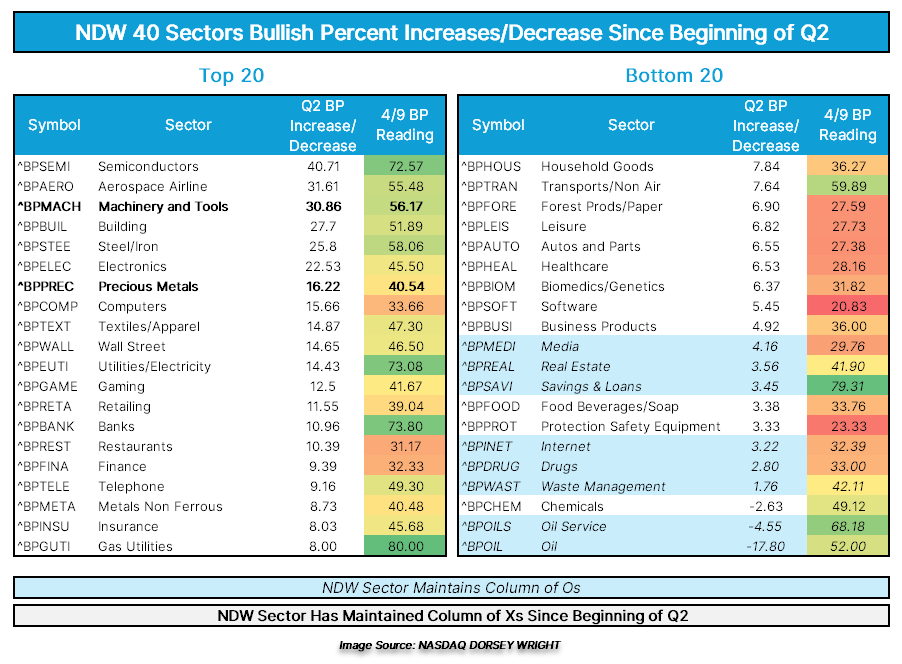
The table below displays the NDW 40 sector bullish‑percent increases or decreases since the beginning of Q2 2026 – encompassing a little over a week’s time - along with current readings as of 4/9. So far, the second quarter has seen 30 of the 40 sector bullish‑percent charts return to a column of Xs, suggesting a notable increase in stocks maintaining point and figure buy signals. On average, NDW sectors have seen their bullish percents rise roughly 10% during Q2, though approximately fifteen sectors have posted substantial gains alongside a few laggards worth noting. Highlights from the data are summarized below.
- Notable participation increases were concentrated in the industrial and technology sectors, with semiconductors, aerospace & airlines, and machinery & tools posting the largest Q2 breadth expansions. Along with the building and steel sectors, these five NDW sectors have witnessed increases of 25% or more, with semiconductors, aerospace & airlines, and machinery & tools seeing gains exceeding 30%. Each of these five sectors currently maintains readings above 50%, indicating that more than half of constituent stocks trade on point‑and‑figure buy signals.
- Additional sectors worth monitoring include those with double‑digit increases that have yet to exceed the 50% threshold, such as electronics, textiles/apparel, wall street, and gaming.
- After being clear leaders during the first quarter, energy sectors have seen a decline in participation. The oil sector bullish percent has fallen almost 18%, while oil services declined 5%. Although readings remain above 50%—suggesting that more than half of stocks are still on buy signals—the abrupt rollover from recent highs makes energy exposure an area to monitor closely.
- Similar to many NDW sectors, most consumer discretionary and staple‑related groups have witnessed modest increases in bullish percents as stocks returned to buy signals, though not to the same magnitude as those previously mentioned. Forest products/paper (27.6), leisure (27.7), autos (26.2), and food beverages/soap (33.8) illustrate that while participation has improved, the majority of stocks in these sectors continue to maintain sell signals on their point‑and‑figure charts.
Considering the Q2 increases in bullish percents, semiconductors, aerospace & airlines, and machinery & tools appear to be attractive areas when evaluating new or existing portfolio exposure. Listed below are three stocks—one from each sector—that present favorable technical setups and are actionable either on recent breakouts or on pullbacks. Additional stock ideas are also provided and meet the following criteria: a technical attribute (TA) rating of 4 or 5, a positive trend, a buy signal, a ranking in the top half of the sector matrix, and earnings more than two weeks away.
ATI ATI Inc. ($160.13) – Aerospace & Airlines - Formerly Allegheny Technologies, ATI has maintained a perfect 5‑for‑5 technical attribute rating since October 2025, when the stock returned to a column of Xs versus both the market and its peer group. The stock has also demonstrated superior long‑term relative strength versus the market and peer group since 2020 and currently ranks within the top decile of the Aerospace & Airlines sector matrix. On the default trend chart, ATI has maintained a positive trend since April of last year and returned to a buy signal at the start of April. Wednesday’s trading produced a second consecutive buy signal, completing a bullish catapult, as shares rallied to $162 during Thursday’s session. The stock’s all‑time chart high from March stands at $168. Initial support is near $146, with additional support around $136. Earnings are expected on April 30.
Additional ideas: AerCap Holdings (AER), AAR Corp. (AIR), Curtiss‑Wright Corp. (CW), and Howmet Aerospace (HWM).

MU Micron Technology, Inc. ($412.75) – Semiconductors - Following Thursday’s trading, Micron’s market relative‑strength chart versus the S&P 500 Equal Weight Index (SPXEWI) returned to a column of Xs, raising the stock to a 4‑for‑5 technical attribute rating. From a long‑term perspective, MU has maintained positive relative strength versus the market since June of last year and against its peer group since March 2023. On the trend chart, the stock has remained in a positive trend since May 2025 and returned to a buy signal at the start of April 2026. This week’s action marked a third buy signal with a double‑top breakout at $388, as shares rallied to $416. MU appears actionable at current levels or on a pullback to the $380–$390 range. Initial support lies at $368, with additional support at $344 and $312—the March 2026 low.
Additional ideas: Applied Materials (AMAT), Lattice Semiconductor (LSCC), Lam Research (LRCX), MACOM Technology Solutions (MTSI), and NOVA Ltd. (NVMI).

CAT Caterpillar Inc. ($790.13) – Machinery & Tools - Caterpillar has carried a 5‑for‑5 technical attribute rating since July 2025 and has maintained at least a 3 rating since October 2022. The stock has shown long‑term positive relative strength versus the market since February 2021 and against its peer group since September 2023, and it currently ranks second out of 69 within the Machinery & Tools sector matrix. On the trend chart, CAT has traded within a positive trend since June of last year and returned to a buy signal in late March 2026. This week’s trading produced a third consecutive buy signal at $744 before extending to a new all‑time high near $792. CAT is actionable on the breakout or on a pullback into the mid‑$700s. Initial support is near $712, with additional support in the $670s and $660s. Earnings are expected on April 30.
Additional ideas: Regal Rexnord (RRX), Cummins Inc. (CMI), Helios Technologies (HLIO), and The Timken Company (TKR).

