
The start of 2026 has been volatile for U.S. equities, with major indices struggling out of the gate. Elevated implied volatility—evidenced by the recent uptick in the CBOE Volatility Index ([VIX])—has emerged as a dominant theme. In this environment, investors may benefit from shifting focus toward more defensive areas of the market, such as low-volatility strategies.
The start of 2026 has been volatile for U.S. equities, with major indices struggling out of the gate. Elevated implied volatility—evidenced by the recent uptick in the CBOE Volatility Index (VIX)—has emerged as a dominant theme. In this environment, investors may benefit from shifting focus toward more defensive areas of the market, such as low-volatility strategies. Pairing core equity exposure with low-volatility allocations can meaningfully reduce portfolio risk, often with a smaller tradeoff in expected return than many anticipate.
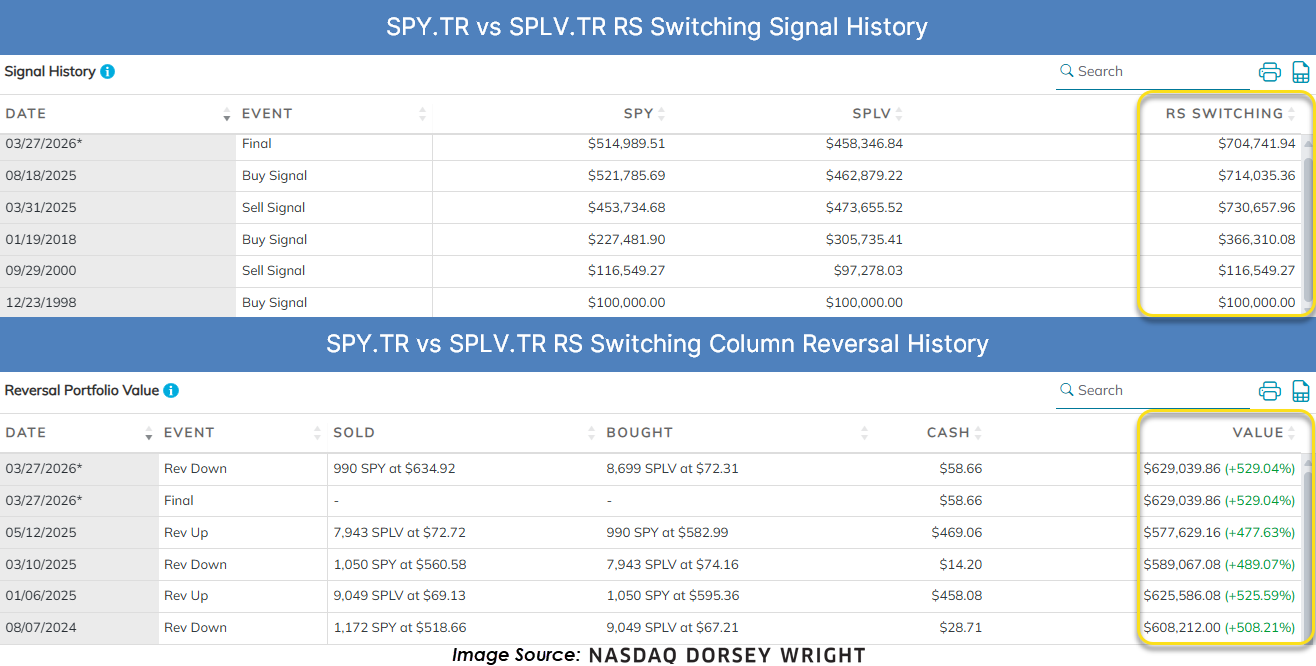
The chart below highlights the relative strength (RS) relationship between the SPDR S&P 500 ETF Trust (SPY) and the Invesco S&P 500 Low Volatility ETF (SPLV), displayed using a 3.25% reversal scale. In August 2025, SPY generated a buy signal against SPLV, reflecting sustained long-term relative strength. However, as of March 27, the RS relationship has reversed into O’s versus SPLV, indicating emerging near-term weakness in SPY relative to low-volatility equities.

Examining the signal history of the RS switching strategy reveals only five instances since 1998 where the relationship has shifted between buy and sell signals. The RS switching strategy column illustrates the hypothetical results of rotating between SPY and SPLV based on which asset is favored at each signal. Starting with $100,000 in 1998, this approach would have grown to approximately $704,000—outperforming a buy-and-hold allocation to SPY ($514,000) or SPLV ($458,000). This underscores the long-term benefit of maintaining exposure to areas of strength.
Further analysis of periods immediately following RS reversals shows a similar pattern. Portfolios that adjusted holdings at these inflection points achieved a higher ending value, with the strategy resulting in a current value of approximately $629,000—again exceeding the outcome of holding either fund in isolation.
Lastly, we evaluated a static allocation model consisting of 60% SPLV and 40% SPY, rebalanced monthly. While capital protection rather than return maximization is the primary objective, the long-term results remain compelling. The model delivered a compound annual growth rate of 9.11% for price returns, compared to 7.18% for the S&P 500. More notably, the portfolio exhibited a materially lower standard deviation and a higher Sharpe ratio (0.57 versus 0.33). The maximum six-month drawdown was also significantly reduced. While this allocation has lagged during recent risk-on periods, the inclusion of SPLV has historically provided disproportionate benefits on the risk-adjusted side of the equation.

In an environment marked by rising volatility and weakening equity participation, incorporating relative strength and low-volatility frameworks can materially improve portfolio resilience. Whether through tactical RS switching or a strategic allocation to defensive exposures, these approaches emphasize capital preservation while maintaining exposure to long-term upside. As market leadership narrows and uncertainty remains elevated, focusing on areas of relative strength becomes increasingly critical for navigating the path forward.
