
After advancing to second place in our DALI asset class rankings earlier this month (3/6), commodities have continued to gain relative strength, surpassing international equities to claim the top spot as of 3/12.
Beginners Series Webinar: Join us on Monday, March 16th at 2 PM (ET) for our NDW Beginners Series Webinar. This week's topic is: Point & Figure (PnF) Basics and Charting Overview. Register Here
After advancing to second place in our DALI asset class rankings earlier this month (3/6), commodities have continued to gain relative strength, surpassing international equities to claim the top spot as of 3/12. The improvement across the asset class has been driven by several notable tailwinds, including rising energy demand tied to AI infrastructure build‑outs, heightened geopolitical volatility, and ongoing supply constraints.
The chart below highlights both the historical DALI signal for commodities and their positioning within the broader DALI asset class rankings. As shown in the signal history, commodity signals can shift meaningfully—and at times rapidly—resulting in notable changes in relative rankings. These sharp inflections often prompt an important question for investors: What does the investment environment for commodities look like following a move higher in DALI rankings?

To address this question, we examined historical instances where:
- Commodities moved from third to second place, and
- Commodities advanced from second to first place within DALI.
After identifying these occurrences and removing one‑month clustering effects, we analyzed the forward returns of the iShares G&P GSCI Commodity‑Indexed Trust (GSG) across multiple time horizons to better understand the investment backdrop following these ranking shifts.
Since 2002, commodities have moved from third to second place 20 times, and from second to first place 11 times. When focusing on the instances where commodities advanced to second place, forward returns 180 days later averaged 6.48%, suggesting that the asset class has historically continued to exhibit upside momentum following these transitions. At the one‑year mark, average returns were 6.17%, exceeding the long‑term average performance of most commodity index (~5% depending on sample period).
Looking specifically at the 11 instances in which commodities moved into the top position in DALI, forward returns over shorter time horizons were also constructive. Average returns at the 90‑day and 180‑day intervals measured 2.58% and 6.11%, respectively. However, one‑year forward returns were historically flat, underscoring the inherently cyclical and fast‑moving nature of commodity markets. Importantly, these forward‑return figures do not account for changes in DALI rankings during the forward period. In practice, periods of flattening or deteriorating performance would likely be captured by DALI’s signal framework, prompting a rotation toward asset classes exhibiting stronger relative strength.

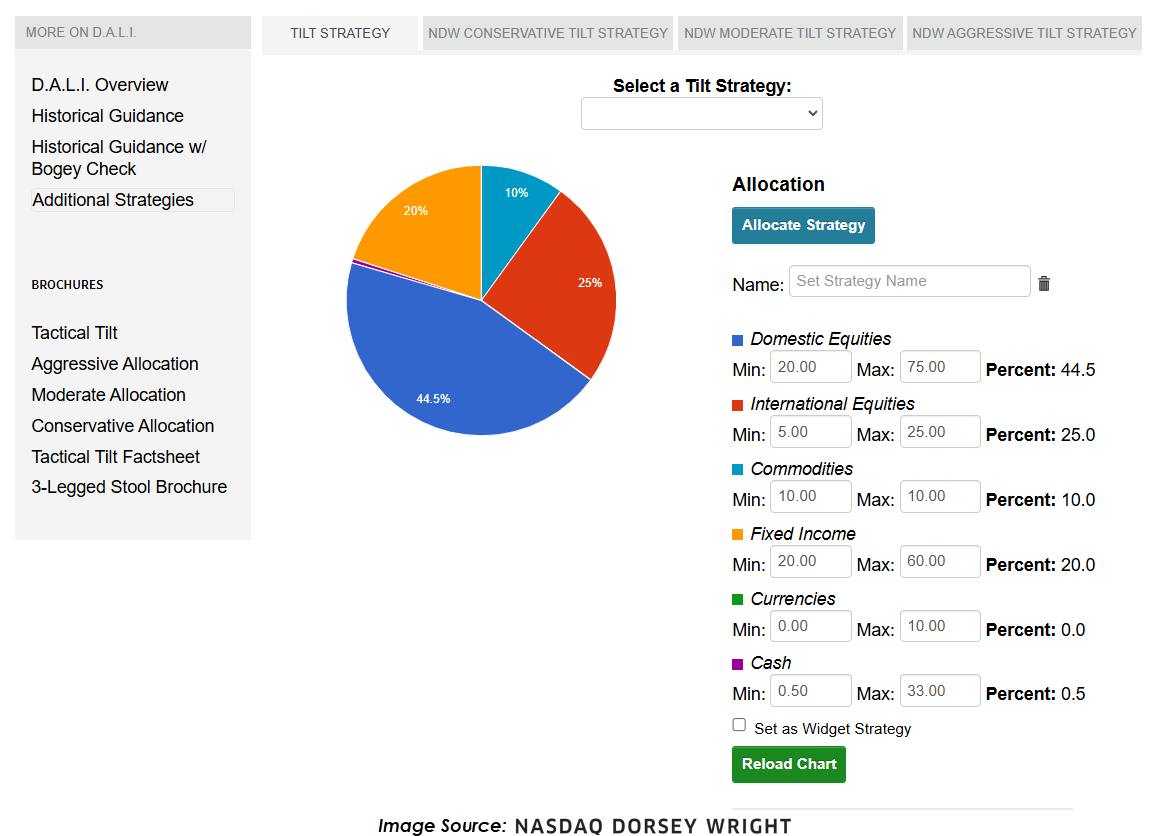
For investors, this reinforces the importance of pairing DALI insights with a disciplined allocation framework. The DALI Tilt Strategy is particularly effective in this regard, allowing users to set minimum and maximum allocation bands by asset class while systematically increasing exposure to areas of relative strength. By maintaining diversification while tactically adjusting positioning, investors can better navigate the inherently volatile nature of commodity markets and remain aligned with evolving market leadership.
In short, commodities’ recent move to the top of DALI rankings highlights opportunity—but it is the process-driven application of DALI, rather than any single signal, that ultimately supports long‑term investment success.
