
High yield spreads have widened recently, a potential sign of risk-off sentiment.
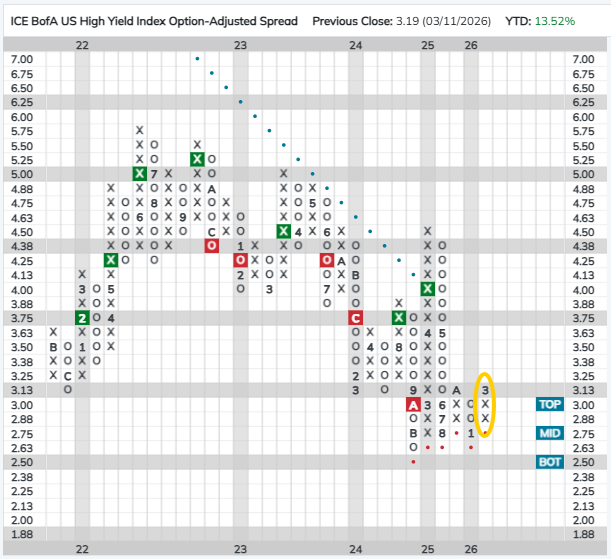
In Friday’s trading, the ICE BofA US High Yield Index Option Adjusted Spread (HIGHYIELDSPREAD), which measures the yield spread between high yield bonds and US Treasuries, reversed up into a column of Xs reflecting widening high yield spreads. The other high yield spread index that we track on the site (CBUS10YRSPREAD) reversed into Xs in February. The widening of high yield spreads is potentially a sign of a risk-off shift toward credit in the bond market and a warning sign to high yield investors. There have already been signs of weakness in high yield bonds – in the Asset Class Group Scores, the high yield corporates group has seen its average score decline from around 3.15 and the beginning of the year to its current score of 2.74.
More significantly for many investors, high yield spreads are also considered to be a bellwether for the economy (or at least economic sentiment) and equities. When investors are worried about the possibility of recession and by extension that borrowers (i.e., bond issuers) won’t be able to service their debt, they demand a higher return for the (perceived) increase in risk and high yield spreads widen. Conversely, when the economy is perceived as being strong, investors are more willing to lend and high yield spreads contract. In an extreme example, high yield spreads widened by more than 700 bps in March of 2020 amid fears of an economic collapse at the outset of the COVID-19 pandemic. Last year, CBUS10YRSPREAD rose about 180 bps in March and April amid tariff worries.
The economy and the stock market are not one in the same, but there is a typically a strong relationship between the two and US equities have historically performed significantly better when high yield spreads are narrowing, indicating favorable economic conditions. The table below shows the quarterly performance of the S&P 500 when high yield spreads are narrowing versus when they are widening. It is also apparent that the magnitude of the change is also change is also significant as the S&P has performed better during quarters when spreads narrowed significantly and worse when they widened by a large amount.

The practical implication of this relationship is that equity investors would be well-served to keep an eye on high yield spreads as widening spreads could signal trouble for stocks while narrowing spreads have historically been associated with positive returns. Another consequence of the relationship between high yield spreads and equities is that investors seeking safety and diversification from their fixed income allocations may want to limit their exposure to high yield bonds. High yield bond prices decline as spreads widen and, as we’ve seen, equities also tend to perform poorly during periods when spreads are widening. Therefore, investors with large high yield allocations are likely to see their bond portfolio decline at the same time as their equity exposure.
We don’t want to overblow the significance of the reversal on HIGHYIELDSPREAD’s chart, as you can see there was another reversal in the last year that was ultimately short-lived and it does not necessarily mean that the S&P will finish the quarter in the red. But, with other signs – like US equities falling to third in DALI – that sentiment may be shifting to risk-off it is worth taking note of what the bond market has to tell us.
