
Over the years we have found sports and their ranking systems to be an effective method for explaining relative strength investing to clients and the NCAA tournament’s seeding system and single-elimination structure make it especially well-suited for this purpose.
It’s that time of year again – March Madness is just around the corner. Next Sunday (3/15), ("Selection Sunday"), the NCAA selection committee will formally announce the field of 64 (or 68, as the case is now) teams who will be playing in the 2025 NCAA Men’s College Basketball Tournament. The tournament officially gets underway two days later with the First Four and begins in earnest on the 19th with the round of 64 and operates in a single-elimination format, which means that 63 games will be played to determine the ultimate champion.
While personal college affiliations are of course important, for many people it is the office pools and bracket challenges that drive the interest in this event. In bracket scoring, there is no reward for our favorite team "hanging in there" against a major conference powerhouse, and style points are not awarded in the final tabulation. Participants simply need to pick which teams will win each of the 63 games, which is no easy task – estimates of the odds of picking a perfect bracket (i.e. correctly picking the winner of all 63 games) range from one in 128 billion to one in 9.2 quintillion. Fortunately, the NCAA brought March Madness into the casual fans' wheelhouse by seeding the teams, helping us all move one step closer to being "bracketologists."
The seeding process of teams began in 1979 as a way for the NCAA to make sure that the strongest teams didn't end up meeting each other too early in the tournament, which would be a threat to TV ratings and the overall fan experience. The seeding also provides the uninitiated a basis for picking winners because while there are few who have followed the seasons of all 64 teams from around the country, everyone intuitively understands that picking a number 16 seed (the lowest-ranked team(s)) to beat a number one seed is not a statistically good bet.
In fact, prior to 2018’s tournament, a number one seed had never lost to a number 16 seed. That year, the University of Virginia (UVA) Cavaliers earned the dubious distinction of becoming the first number one seed to do so when they were defeated in the first round by the University of Maryland, Baltimore County (UMBC) Retrievers 74 to 54. UMBC stood as the only 16 seed to make it out of the first round until 2023 when the Fairleigh Dickinson University (FDU) Knights defeated number one seed Purdue 63 to 58. Like UMBC, FDU didn’t defy the odds for long, however, falling to nine seed Florida Atlantic in the second round.
A team with a high ranking is, after all, the stronger team based on qualitative and quantitative evaluation. They often possess more talent and better coaching than the lower-ranked teams, especially when comparing teams with a large gap in seeding. While past performance has certainly not guaranteed future success for all the high-seeded teams, it is certainly a good starting point for the average fan's tournament bracket.
Last year’s tournament exemplified the strength of high seeds as number one through number four seeds had a perfect 16-0 record in the first round of the tournament. The Elite Eight contained four number one seeds, three number two seeds, and one number three seed and no number one seed lost a game until the Final Four.
We compiled data from CBS Sports and ESPN regarding the success of each of the 16 seeds advancing through the NCAA tournament, updated through the 2025 tournament (there were no results for 2020 as the tournament was canceled that year). The seeding process has largely worked out as the NCAA intended it to. Higher-ranked teams typically advance through the early rounds, leading to exciting clashes of talented teams late in the tournament. Top-seeded teams don't always survive the four-round gauntlet that precedes the Final Four, but, historically, these teams win about 80% of the games they play. Meanwhile, the 13 - 16 seeds combine to win only about 11% of the games they play.
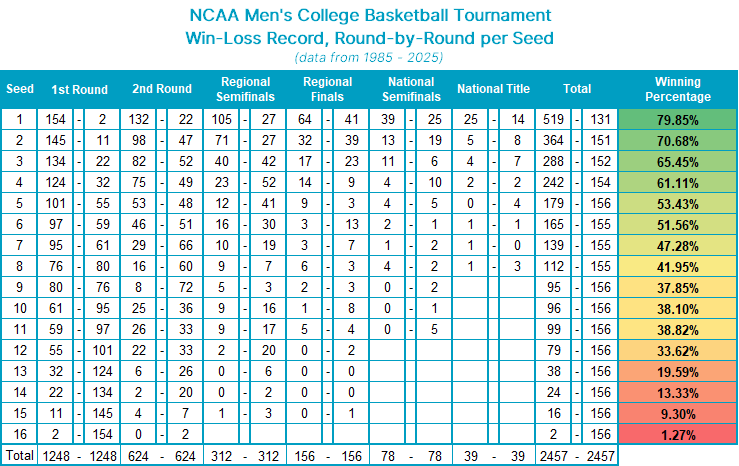
Additional NCAA Seeding Statistics (1985-2025)
- Unsurprisingly, number-one-seeded teams have won the greatest percentage of games, at 80%.
- Top-three-seeded teams have combined to win about 73% of their games.
- By contrast, the bottom-three-seeded teams (14-16) have a combined win total of just 42 games (or a little over 8% of their contests) in 40 years.
- Top-five-seeded teams have produced a winning percentage of 68%, while the bottom five have won just 17% of their games.
- Number one seeds have won more games in the tournament than the bottom three seeds have played (519 to 510).
- The top-three-seeded teams have won the national title 36 out of 39 years.
- 2022 was the first time a 15 seed made it to the Elite Eight; no team seeded 12th or lower has ever advanced to the Final Four and no team ranked lower than eight has ever advanced to the NCAA championship game.
Beware of those "Bracket Busters"
Despite the statistical trends, in many years we see a "Cinderella team" emerge somewhere along the way. Basically, a low-seeded team manages to defy the odds and beat a higher-seeded team. In 2022 15th-seeded St. Peters defeated basketball powerhouses Kentucky (2) and Purdue (3) en route to the Elite Eight, falling to the eventual national runner-up North Carolina (an 8-seed). In 2023, 15th seed Princeton defeated Arizona (2) and Missouri (7) before falling to Creighton (6) in the Sweet 16. And in 2024, 11th seed NC State made it to the Final Four before being knocked off by national runner-up Purdue (1). Over the life of the NCAA tournament, however, two and three seeds still win more than two-thirds of their games, while 11 seeds win only about one-third of theirs. Yet many fans spend as much time evaluating which 11, 12, or 13-seed will win their first game as they will analyzing which top seed is likely to win the whole tournament - which is far more important in terms of bracket scoring.
This tendency is similar to a study that we have referenced in this report many times over the years regarding the derivation of risk in a stock. The study, conducted by Benjamin King, looked at the risk in an individual stock and what caused the price of the stock to move. The study found that 80% of the risk is associated with the sector and overall market, while only 20% was company specific. The other part of the study found that the average investor spends 80% of their time evaluating company-specific information, and just 20% of their time evaluating market and sector risk.
Many NCAA "bracketologists" spend an awful lot of time slicing and dicing the differences between the point guards of 16 seeds, which have only ever won two games out of the 158 they’ve played. Yes, you may be the one to predict that third win by a 16 seed; however, you are also predicting the elimination of a one seed, which have historically won almost 99% of their first-round games, and about 80% of all their NCAA tournament games. Number one seeds have a history of making it much further into the tournament, which means incorrectly picking a 16 seed over a one seed, not only goes down as a loss for that game but probably two or three more games in your bracket. So, while the potential of being able to claim "victory" in correctly picking an upset by a 16 seed may be alluring, the fact is such picks have been correct less than 2% of the time in tournament history. Which side would you rather be on?
The Relative Strength Seeding Process
When we compare investments in a relative strength matrix, we are simply “seeding” teams, and like the NCAA experts, we are seeding them based on their success against their peers. The more relative strength buy signals generated by a team/security, the stronger the ranking or the “seeding” of that stock or ETF. Like the NCAA tournament, we know that history shows those top seeds perform better as a universe than the lower seeds. There are upsets, of course, but the trend favors the higher seeds and so that is where we focus our investment.
While the NCAA committee has its own proprietary ways of ranking teams, the input is based upon head-to-head games earlier in the season and overall recent performance. How a relative strength matrix ranks stocks, sectors, and even asset classes is not particularly dissimilar. Our relative strength rankings are a way to identify the strongest performance trends within a given universe, using head-to-head comparisons (RS charts) to build a database of information. The matrix process also affords us a lens through which to see negative performance trends begin to improve. We'd offer, however, that top-ranked assets in a matrix are your high seeds and thus offer the best probability of repeatable success. While low-ranked assets that are simply improving would be the equivalent of a 12-seed scoring an upset. We would not build a portfolio based on 12 seeds due to the instability of these trends, however, the RS rankings do offer a logical, organized means for approaching the "upset" selection process.
