
Where does strength reside the most within each sector, and where has it been moving as of late?
On a battlefield, victory depends on the combined efforts of both the soldiers and the general leading them. Similarly, markets can move higher at the hands of either its largest companies (generals) or the average sized stocks (soldiers) that make up the majority of companies. So far in 2026, the soldiers have led the way to the upside, which is a continuation of movement we saw at the end of 2025. These differences are magnified even further when breaking down the market into sectors. The cap weight State Street Communications Select Sector SPDR ETF (XLC) has gained 4.5% over the last six months. However, the Invesco S&P 500 Equal Weight Communication Services ETF, representing the average communications stock, is down 2.7% over that same span.
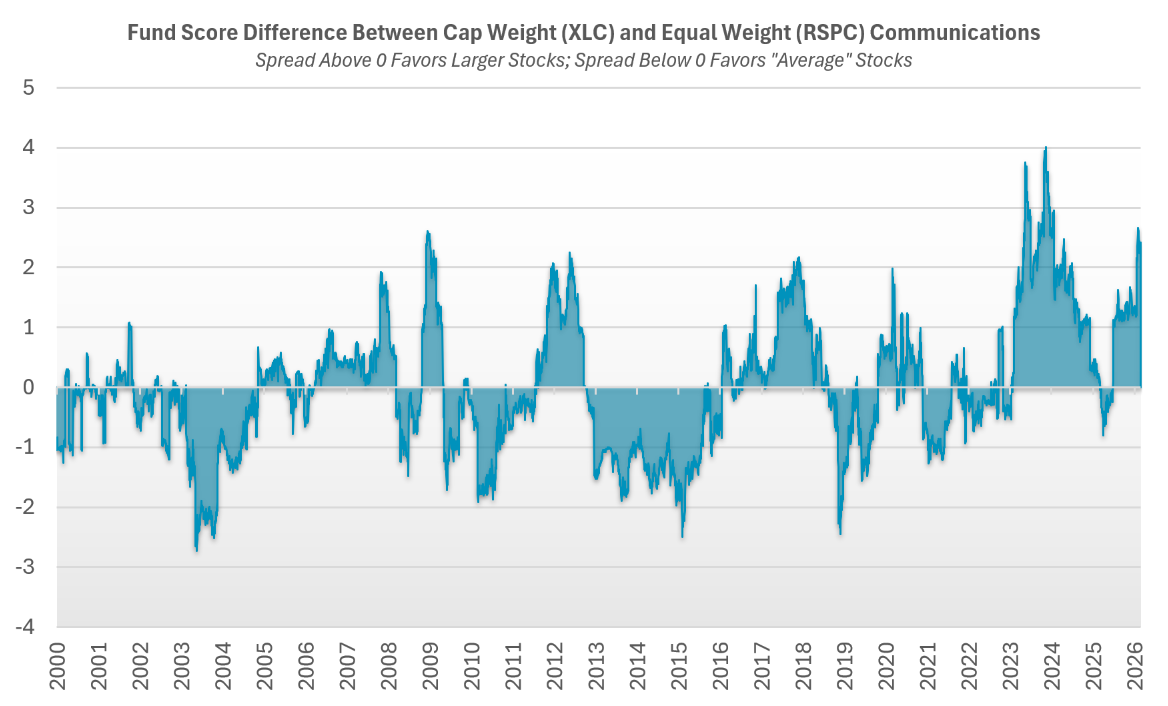
Watchful investors would have seen that XLC held a higher fund score than RSPC over that entire year’s period, highlighting the importance of monitoring where strength lies in a sector. With all that in mind, where does strength reside the most within each sector, and where has it been moving as of late? Looking at the table below of different equal and cap weight ETFs, the eleven major sectors can be split into three major categories: top heavy sectors, bottom heavy sectors, and those lying somewhere in the middle.

The Middle Ground:
Currently, there is little to no difference between the largest and average stocks within the following sectors: Industrials, Utilities, Healthcare, Energy, and Staples. Investors adding exposure to these areas shouldn’t think too hard about whether to favor the sectors’ leaders or its average joes.
The Top Heavy Sectors:
In Financials, Communications, and Real Estate, strength is more concentrated in the larger stocks, while smaller names tend to lag. Communications and real estate have seen their cap weight funds outperform this year, whereas financials has seen downside from some the largest financial institutions.
Communications clearly holds the greatest lead in favor of cap weight areas relative to any sector, with XLC doubling RSPC’s fund score, but that makes more sense given its constituents. Nearly two fifths of XLC’s allocation is solely in Alphabet (GOOGGOOGL) and Meta Platforms (META), so the strength of those two companies is buoying the sector on a cap weighted basis for the time being. Overall, investors targeting these sectors may benefit from emphasizing the larger names.
The Bottom Heavy Sectors:
Strength from the Consumer Discretionary and Technology sectors is more likely to be found among the average stocks compared to the the largest names. The two equal weight sector funds hold strong scores and are positive in 2026. Conversely, cap weight representatives for these sectors are down YTD and hold mediocre fund scores below 3.8.
Technology has been propelled by its mega‑cap leaders for several years, making the recent weakness in those names particularly notable. In fact, the difference in fund score between XLK and RSPT reached the widest spread in favor of average tech stocks in nearly 20 years. The only sustained periods favoring RSPT over XLK are the first half of the 2000s, the mid-2010s, and 2020/2021. While the sector is holding up for now, a deeper decline among technology’s generals would be an important development to monitor as we look ahead to the rest of 2026.

