
Leverage allows investors to achieve superhuman gains–albeit with the potential for superhuman losses as well. Given their high risk and reward, what can you expect when owning leveraged funds?
Leverage can allow investors to achieve superhuman gains–albeit with the potential for superhuman losses as well. These strategies, once reserved only for financial institutions, are more accessible than ever with leveraged ETFs. However, just because they exist doesn’t mean they’re a viable investment for all individuals. Given their high risk and reward, what can you expect when owning them?
The Good: Returns
The easiest way to increase returns is through additional risk, which is why leverage can offer returns that would be borderline impossible under normal circumstances. Last year represented a relatively bullish year for equities, and those invested in leveraged funds made out even better. The S&P 500 rose 16.4% in 2025, but the ProShares Ultra S&P500 2X ETF (SSO) exceeded that with a gain of 25.2%. The last three years offer an almost best-case scenario for leveraged funds, with the market steadily rising with low volatility. From the start of 2023, the Nasdaq-100 (NDX) has risen 129%, but the leveraged ProShares Ultra QQQ 2X ETF (QLD) blows that out of the water with a gain of more than 292%. However, not every year is as kind to investors as the last three, so how well do leveraged funds perform in an average year?
To quantify leverage’s impact, we created ten portfolios following the S&P 500 since 1950, with each portfolio increasing its allocation to a double leverage S&P 500 index in 10% increments. Leverage isn’t free, so to simulate real-life borrowing costs, we added a 1% annualized expense ratio taken daily from the double and triple leverage index—close to popular funds like SSO & QLD. Looking at the table below, we see that leverage has a clear benefit to average returns across the board.
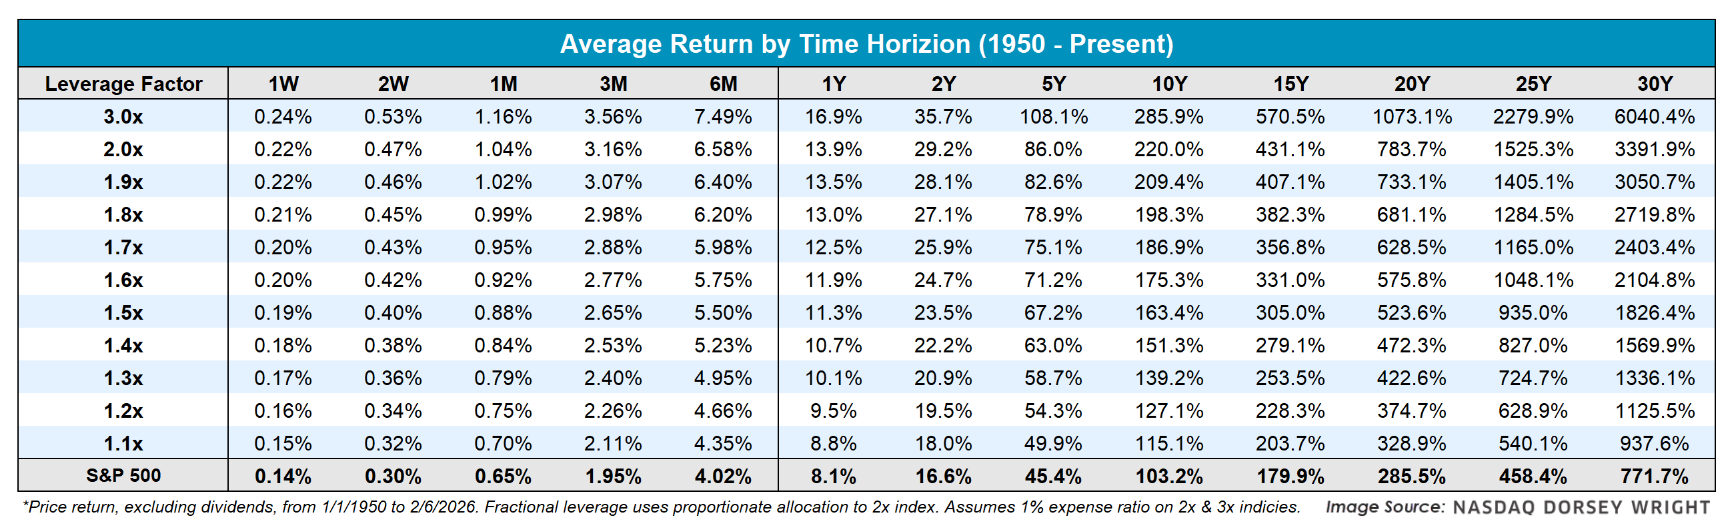
Due to the power of compounding returns, this impact is even more impressive at longer time horizons. A double leverage fund averages a gain of ~3400% across a thirty-year time horizon, which dominates the ~770% average thirty-year gain for the S&P 500. However, as we will mention later, holding leveraged funds for that long is easier said than done.
The Bad: Divergence From Expectation
While the promise of double or more returns may sound promising, a leveraged fund’s return can diverge significantly from its intended target over your holding period. Looking at the previous return table, you’d need to own a “double” leveraged fund for 10 years before averaging a return double that of the S&P 500. In essence, double leverage funds average twice the risk for less than double the gains for most investors. This is due to leverage funds being reset daily, meaning their effects compound enough to result in leverage decay. Additionally, leverage decay is more pronounced in high volatility environments, meaning leveraged funds work best in periods of stability.
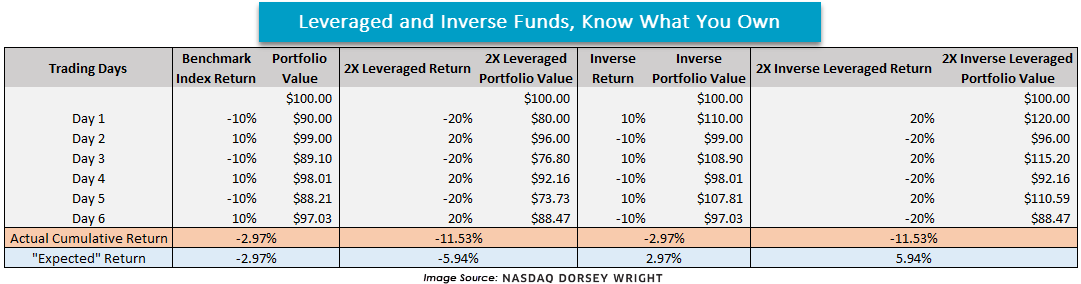
The table below shows an extreme example of how this can play out in four hypothetical portfolios after six consecutive days moving 10% in opposite directions. As you can see, none of the leveraged or inverse portfolios met their “expected return,” which was based on the ending benchmark return. While such a scenario is highly unlikely, it showcases how leveraged funds often don’t act as one may anticipate.
Beyond these issues, leveraged funds can have trouble achieving their targeted leverage. A example comes from double leverage Strategy (MSTR) funds last year, which failed to obtain enough swaps to secure its targeted leverage on several occasions. Inherent in the risk of leveraged funds is that they may no longer function as promised.
The Ugly: Downside Difficulties
Leveraged funds can get ugly fast. The biggest risk of owning leveraged funds is that your downside exposure is significantly higher. To give a general sense of how ugly funds can get, we looked at two metrics of evaluating risk across different time horizons: minimum return and average max drawdown.
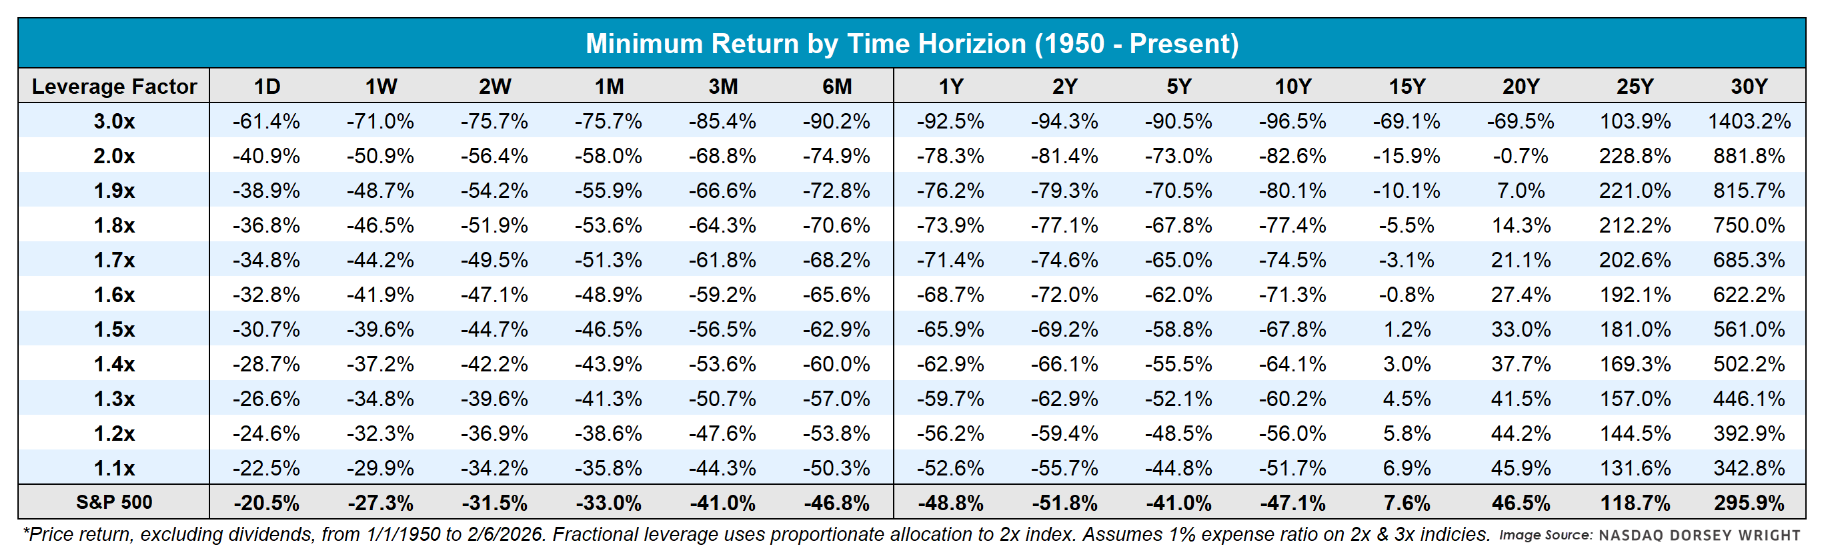
The first table below details the minimum return, which is the worst return across any period of that length. For example, the worst return of the S&P 500 in any one week since 1950 is -27.3%, which took place during the five trading days ending on Black Monday 1987. However, that week’s return looks tame compared to leveraged funds. During that same week, double and triple leveraged funds would have lost 50.9% and 71.0%, respectively. Looking further out, those invested in the S&P 500 for six months were limited to a loss of less than 50%, while those in double or triple leveraged funds would have fared far worse with losses of 74.9% and 90.2%, respectively.
While minimum return provides an idea of an extreme bear scenario, what can we expect along the average ride? To answer that question, we looked at the average drawdown of each portfolio—defined as the maximum peak-to-trough decline—for each portfolio across different time horizons since 1950. Over that period, the average drawdown was 13.3% for a one-year time horizon. Said plainly, the S&P 500 is down 13.3% from an intra-year high on average at some point during the year. Meanwhile, you can expect a triple leveraged fund to decline by 34.1% at some point within a year.

One interesting trend is that the minimum return of leveraged funds is higher than the S&P 500 after 25 years. Even during their worst 25-year periods since 1950, investors would’ve had higher returns owning a triple leveraged fund relative to the index. However, despite that higher minimum, the triple leverage holder should expect a 90% drawdown on average compared to only 50% for the index. Frankly, there are very few investors who could make it through a 75% loss—let alone 90%, which brings us to the biggest problem. Most individuals aren’t willing to hold through such a sharp decline, and given that leveraged funds will see those types of drawdowns, their benefits are almost entirely negated for the average investor. While investors of SSO made 25% last year, they also experienced a 35% drawdown during that same period, and those gains wouldn't have been realized if investors panic sold near the bottom.
Today’s feature is focused primarily on leveraged funds that follow the S&P 500. Leveraged funds that track more volatile indices—or even worse, individual securities—are subject to more severe drawdowns and divergence from their target. The triple leveraged ProShares UltraPro QQQ 3X (TQQQ) is still down 62% from its peak in 2000 despite the non-levered QQQ rising more than 416%. Even worse, if you invested $1,000 in a triple leverage S&P 500 fund on 9/3/1929, you would have been left with $0.24 if you sold it on 4/28/1942 for an abysmal -99.98% return over ~12.5 years. Granted, that’s the worst possible scenario for leveraged funds, but it shows just how bleak things can get at their ugliest.
The Bottom Line
At their worst, leveraged funds can wipe out an individual’s wealth. However, when used responsibly, leveraged funds can provide long-term benefits to returns for those who can stomach the volatility. Partial allocations could be justified for those seeking additional capital appreciation, especially for clients with a high risk tolerance and a long time horizon. That said, just because a client could withstand a pullback doesn’t mean they would be able to stomach a drawdown after looking at their account. When you buy leveraged funds and get an environment like the last two years, you might look like a genius to clients. But if someone’s position is down almost 70%—like SSO was in 2008—they might not be a client much longer. Consequently, leveraged funds are a powerful double-edged sword that should be wielded with the utmost caution.
