Most Requested Symbols

The basic materials sector has quietly moved up to the third position in the DALI sector rankings for the first time in two and a half years.
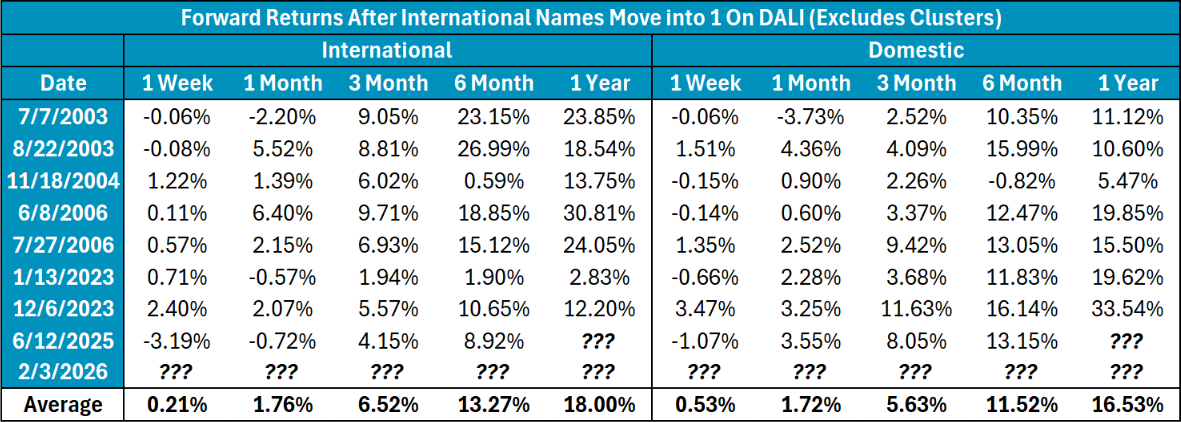
International Equities moved into first place on the DALI page for the first time since mid-2025, beating out domestic equities via tiebreaker. Today we look at other instances of when internationals led and try to answer the question... what does this mean for your portfolio?
Weekly Rundown Video – Feb 4, 2026
Weekly rundown with NDW analyst team covering all major asset classes.
Weekly rundown with NDW analyst team covering all major asset classes.
The basic materials sector has quietly moved up to the third position in the DALI sector rankings for the first time in two and a half years. While there has been attention on miners, especially those in the precious metals space, the materials sector has started to broaden out in recent months. Both the State Street Materials Select Sector SPDR ETF (XLB) and the Invesco S&P Equal Weight Materials ETF (RSPM) broke out to new all-time highs in February. The cap-weighted XLB took out its old all-time high dating back to 2024 while RSPM finally eclipsed its 2022 high. RSPM has slightly outpaced XLB this year with year-to-date returns of 12.57% and 11.80%, respectively. Both materials funds have near-identical fund scores around 4.20 and are both trading in heavily overbought territory with respect to their ten-week trading bands. Nonetheless, the move to third in the DALI sector rankings, both cap-weight and equal-weight representatives moving to new all-time highs after struggling the last few years, and fund scores above 4.0 make the materials place an area worth scouring for opportunities.

Out of the 26 stocks in RSPM, there are only six with buy ratings (four or five technical attributes). The 5 for 5’ers include: Albermarle Corp (ALB), Steel Dynamics Inc. (STLD), DuPont de Nemours Inc. (DD), and CRH PLC ADR (CRH). Out of these four names, STLD has had the most consistent technical picture over the last year. Until bursting to the upside to start 2026, STLD had held close to its positive trendline, generating seven consecutive buy signals in the process. This streak was broken in January briefly before STLD notched two more buy signals on its trend chart. STLD has been a high attribute name since October, and while it is trading near the top of its trading band, it can be strongly considered on pullbacks. Overall, the materials sector is seeing strength emerge outside of the precious metals miners making broad exposure and targeted exposure viable moving forward.


One of the most well-known pages on the NDW platform is the Dynamic Asset Level Investing (DALI) tool. Using relative strength matrices as a guide, the DALI tool brings visual simplicity to a rather complex question: What parts of the global marketplace earn long-term relative strength? For that reason, the DALI tool and subsequent changes in overall rankings are closely watched by the analyst team as they bring potential for important shifts in leadership worth acting on. For those of you already familiar with the DALI framework and how overall rankings are calculated, feel free to skip ahead. At its core, the DALI tool utilizes a tally matrix scoring system, a proprietary NDW matrix filled with representatives from each broad asset group (or sub asset class). From there, the mathematics are rather simple: tally (add up) the total number of signals each group earns against the rest of the pack. By nature, stronger groups will earn more buy signals, pushing them higher in the rankings as groups you want to pay attention to. Ties in buy signal count (like the one witnessed today) are broken by whichever group earns more near-term strength as evidenced by the total number of X’s counted. While we run this calculation daily, overall rankings are designed to capture long-term trends. There is, of course, no silver bullet to pinpointing strength, but focusing on the top asset class (and avoiding the bottom) has been additive over time.

With our DALI update on 2/4, international equities overtook domestic equities for the first overall position in the broad ranks. This marks the highest point for the asset class since a brief stint last June, during which the top three groups of domestic equities, commodities and international equities all earned the top position for some period of time before domestic equities ultimately reclaimed the top position. It is worth noting that the recent shift comes as a result of a tie in buy signal count… so we could see some continued jockeying for position in the near-term as overall strength for the top groups remains close knit. The table below details other instances of international equity dominance, excluding clusters over a 30-day period. You’ll note somewhat consistent leadership throughout the lost decade while domestic markets were struggling with the GFC- but otherwise broader leadership shifts have been largely unproductive. While it remains to be seen if this period of international outperformance is truly more than a one-year fling, the emergence of the space is certainly notable… particularly in historical context which has only seen the group lead a handful of times. In terms of average performance, both domestic and international representatives (ACWX & SPY have shown strong performance following the day of internationals moving into the first position…. But the elephant in the room is that international leadership preceded large domestic drawdowns throughout the 2000’s.
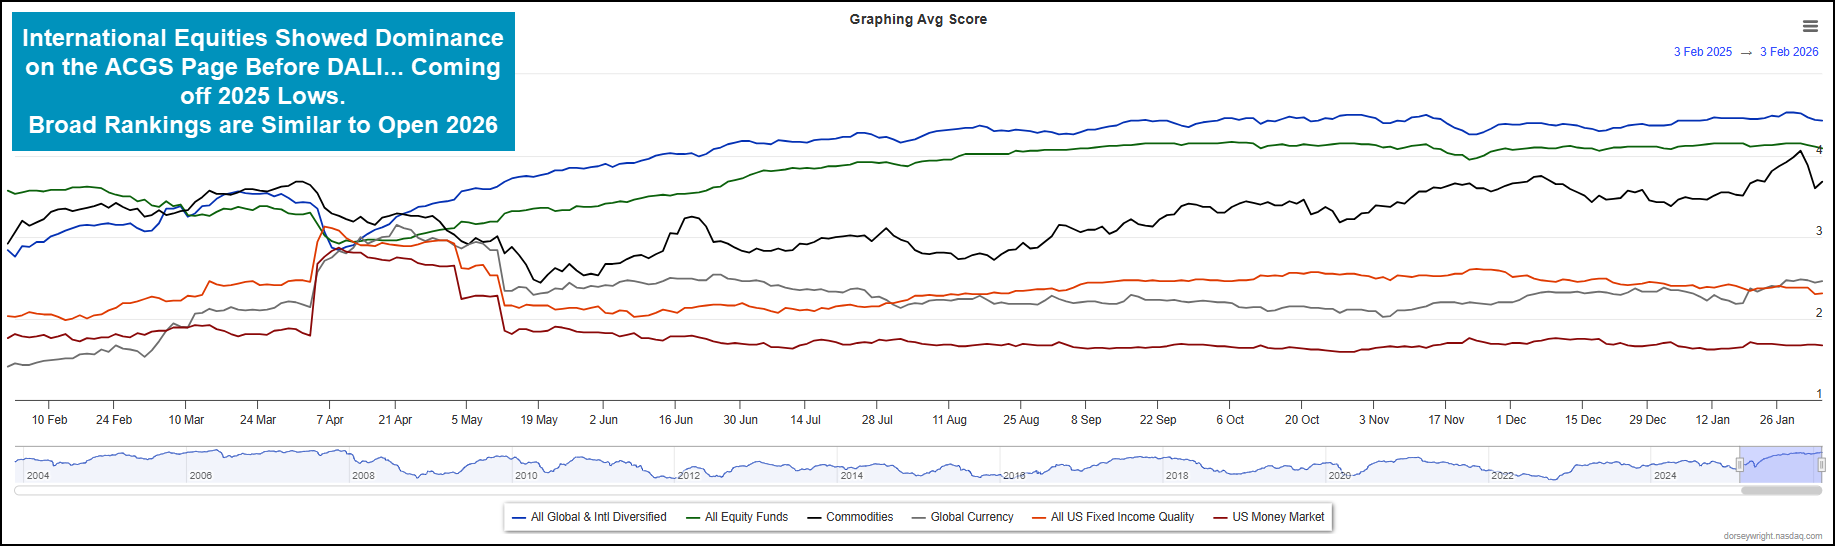
DALI is just one way to observe strength across asset classes. Some of you may prefer to utilize the Asset Class Group Scores (ACGS) page to pinpoint emerging strength/weakness. The ACGS page is typically a bit quicker moving than DALI, a fact that can be helpful in some market environments and damaging in others. Regardless, the ACGS rankings of the six broad groups are featured below. You’ll note that international equities have maintained the first position in the overall rankings since coming off the April 2025 lows, followed closely by domestic equities and then commodities.
Zooming out of pure international equity vs. domestic equity conversation, an analysis of either ranking system confirms further dominance of the top three groups (international & domestic equities and commodities) over the bottom three groups (fixed income, cash and currencies) quite handedly. The difference between commodities in 3rd and cash in fourth sits at 110 signals, suggesting that these risk-on areas of the market maintain their long-term leadership. This could always shift as the recent market exhale continues, but until that point the technicals point to an otherwise constructive environment for broader equities. As always, you can set alerts to be notified of changes on either the ACGS or DALI pages over time.
Each week the analysts at NDW review and comment on all major asset classes in the global markets. Shown below is the summary or snapshot of the primary technical indicators we follow for multiple areas. Should there be changes mid-week we will certainly bring these to your attention via the report.
| Universe | BP Col & Level (actual) | BP Rev Level | PT Col & Level (actual) | PT Rev Level | HiLo Col & Level (actual) | HiLo Rev Level | 10 Week Col & Level (actual) | 10 Week Rev Level | 30 Week Col & Level (actual) | 30 Week Rev Level |
|---|---|---|---|---|---|---|---|---|---|---|
| ALL |
|
42% |
|
38% |
|
74% |
|
60% |
|
48% |
| NYSE |
|
56% |
|
54% |
|
86% |
|
72% |
|
60% |
| OTC |
|
36% |
|
34% |
|
68% |
|
56% |
|
44% |
| World |
|
46% |
|
44% |
|
|
|
60% |
|
54% |

Remember, these are technical comments only. Just as you must be aware of fundamental data for the stocks we recommend based on technical criteria in the report, so too must you be aware of important data regarding delivery, market moving government releases, and other factors that may influence commodity pricing. We try to limit our technical comments to the most actively traded contracts in advance of delivery, but some contracts trade actively right up to delivery while others taper off well in advance. Be sure you check your dates before trading these contracts. For questions regarding this section or additional coverage of commodities email james.west@nasdaq.com.
Data represented in the table below is through 2/3/2026:
| Symbol | Name | Price | PnF Trend | RS Signal | RS Col. | 200 Day MA | Weekly Mom |
|---|---|---|---|---|---|---|---|
| CL/ | Crude Oil Continuous | 63.21 | Positive | Sell | O | 62.23 | + 6W |
| DBLCIX | Deutsche Bank Liquid Commodities Index | 468.52 | Positive | Sell | O | 460.74 | - 30W |
| DWACOMMOD | NDW Continuous Commodity Index | 1093.63 | Positive | Buy | O | 1013.06 | + 3W |
| GC/ | Gold Continuous | 4903.70 | Positive | Buy | X | 3786.69 | + 5W |
| HG/ | Copper Continuous | 6.06 | Positive | Buy | X | 5.04 | - 2W |
| ZG/ | Corn (Electronic Day Session) Continuous | 428.50 | Positive | Sell | O | 426.19 | - 6W |

Average Level
20.63
| < - -100 | -100 - -80 | -80 - -60 | -60 - -40 | -40 - -20 | -20 - 0 | 0 - 20 | 20 - 40 | 40 - 60 | 60 - 80 | 80 - 100 | 100 - > |
|---|---|---|---|---|---|---|---|---|---|---|---|
|
Buy signalXLG
|
Buy signaldia
|
||||||||||
|
Buy signalVOOG
|
Buy signalfxe
|
||||||||||
|
Sell signaldx/y
|
Buy signalONEQ
|
Buy signaliwm
|
Buy signalijr
|
Buy signalgsg
|
|||||||
|
Buy signalshy
|
Buy signalagg
|
Buy signalQQQ
|
Sell signalicf
|
Buy signalIJH
|
Buy signalrsp
|
Buy signalGLD
|
Buy signaldvy
|
||||
|
Sell signalief
|
Sell signaltlt
|
Sell signallqd
|
Buy signalhyg
|
Buy signalSPY
|
Buy signalgcc
|
Buy signalVOOV
|
Buy signaluso
|
Buy signalefa
|
Buy signalEEM
|
||
| < - -100 | -100 - -80 | -80 - -60 | -60 - -40 | -40 - -20 | -20 - 0 | 0 - 20 | 20 - 40 | 40 - 60 | 60 - 80 | 80 - 100 | 100 - > |
| AGG | iShares US Core Bond ETF |
| USO | United States Oil Fund |
| DIA | SPDR Dow Jones Industrial Average ETF |
| DVY | iShares Dow Jones Select Dividend Index ETF |
| DX/Y | NYCE U.S.Dollar Index Spot |
| EFA | iShares MSCI EAFE ETF |
| FXE | Invesco CurrencyShares Euro Trust |
| GLD | SPDR Gold Trust |
| GSG | iShares S&P GSCI Commodity-Indexed Trust |
| HYG | iShares iBoxx $ High Yield Corporate Bond ETF |
| ICF | iShares Cohen & Steers Realty ETF |
| IEF | iShares Barclays 7-10 Yr. Tres. Bond ETF |
| LQD | iShares iBoxx $ Investment Grade Corp. Bond ETF |
| IJH | iShares S&P 400 MidCap Index Fund |
| ONEQ | Fidelity Nasdaq Composite Index Track |
| QQQ | Invesco QQQ Trust |
| RSP | Invesco S&P 500 Equal Weight ETF |
| IWM | iShares Russell 2000 Index ETF |
| SHY | iShares Barclays 1-3 Year Tres. Bond ETF |
| IJR | iShares S&P 600 SmallCap Index Fund |
| SPY | SPDR S&P 500 Index ETF Trust |
| TLT | iShares Barclays 20+ Year Treasury Bond ETF |
| GCC | WisdomTree Continuous Commodity Index Fund |
| VOOG | Vanguard S&P 500 Growth ETF |
| VOOV | Vanguard S&P 500 Value ETF |
| EEM | iShares MSCI Emerging Markets ETF |
| XLG | Invesco S&P 500 Top 50 ETF |

| Symbol | Company | Sector | Current Price | Action Price | Target | Stop | Notes |
|---|---|---|---|---|---|---|---|
| LAMR | Lamar Advertising Company | Media | $126.06 | 120s - low 130s | 158 | 110 | 4 for 5'er, top half of MEDI sector matrix, LT pos peer & mkt RS, spread triple top 4.8% yield, Earn 2/20 |
| BCO | The Brink's Company | Protection Safety Equipment | $125.46 | mid 110s - low 120s | 152 | 104 | 5 for 5'er, top half of PROT sector matrix, LT pos peer & mkt RS, spread triple top, R-R>2.0, Earn. 2/25 |
| WFC | Wells Fargo & Company | Banks | $92.31 | mid 80s - low 90s | 128 | 76 | 5 for 5'er, top 25% of BANK sector matrix, LT pos peer & mkt RS, buy on pullback, R-R~3.0 |
| JPM | J.P. Morgan Chase & Co. | Banks | $314.85 | lo 300s - mid 320s | 380 | 256 | 5 TA rating, top 25% of favored BANK sector matrix, LT RS buy, LT pos trend, buy-on-pullback |
| ETR | Entergy Corporation | Utilities/Electricity | $97.35 | low-to-mid 90s | 107 | 86 | 5 for 5'er, top 20% of EUTI sector matrix, 2.7% yield Earn. 2/12 |
| HWC | Hancock Whitney Corp | Banks | $71.94 | 64 - lo 70s | 90 | 54 | 5 TA rating, top half of BANK sector matrix, LT RS buy, consec buy signals, buy-on-pullback |
| ENVA | Enova International Inc | Finance | $159.07 | hi 150s - 160s | 190 | 142 | 5 for 5'er, 2 of 78 in FINA sector matrix, LT pos peer & mkt RS |
| EWBC | East West Bancorp, Inc. | Banks | $114.73 | mid 100s - mid 110s | 157 | 92 | 4 for 5'er, top third of favored BANK sector matrix, LT pos peer RS, one box from mkt RS buy, spread quad top |
| ULTA | Ulta Beauty, Inc. | Retailing | $673.39 | 632 - hi 600s | 840 | 568 | 4 TA rating, top 10% of RETA sector matrix, LT RS buy, consec buy signals |
| APTV | Aptiv PLC | Autos and Parts | $78.20 | hi 70s - low 80s | 100 | 69 | 5 for 5'er, top half of AUTO sector matrix, successful trend line test |
| Symbol | Company | Sector | Current Price | Action Price | Target | Stop | Notes |
|---|
| Symbol | Company | Sector | Current Price | Action Price | Target | Stop | Notes |
|---|---|---|---|---|---|---|---|
| IMAX | Imax Corporation | Media | $35.64 | 33 - hi 30s | 53 | 26 | Removed for earnings. Raise stop to $28. Earn. 2/18 |
| FIX | Comfort Systems U.S.A. | Building | $1209.97 | 960 - mid 1100s | 1376 | 864 | FIX has fallen to a sell signal. OK to hold here. Raise stop to $944. Earn. 2/19 |
| BWA | BorgWarner Inc. | Autos and Parts | $48.57 | mid-to-hi 40s | 83 | 40 | BWA has moved into heavily overbought territory. OK to hold here. Maintain $40 stop. Earn. 2/11 |
| Comment | |||||||
|---|---|---|---|---|---|---|---|
|
|
|||||||
APTV Aptiv PLC R ($81.31) - Autos and Parts - APTV is a 5 for 5'er that ranks in the top half of the autos and parts sector matrix. After giving two consecutive sell signals and successfully testing its bullish support line, APTV rallied and returned to a buy signal with a double top break at $80 in Tuesday's trading. Long exposure may be added in the high $70s to low $80s and we will set our initial stop at $69, which would take out multiple levels of support on APTV's chart and violate its trend line. We will use the bullish price objective, $100, as our target price.
| 26 | |||||||||||||||||||||||||||||
| 88.00 | A | X | 88.00 | ||||||||||||||||||||||||||
| 87.00 | X | O | X | X | O | 87.00 | |||||||||||||||||||||||
| 86.00 | X | O | X | O | X | O | 86.00 | ||||||||||||||||||||||
| 85.00 | X | O | X | O | X | O | 85.00 | ||||||||||||||||||||||
| 84.00 | X | O | X | O | B | X | O | 84.00 | |||||||||||||||||||||
| 83.00 | X | O | X | O | X | O | X | O | 83.00 | ||||||||||||||||||||
| 82.00 | X | O | X | O | X | O | X | O | 82.00 | ||||||||||||||||||||
| 81.00 | X | X | O | X | O | O | X | O | X | 81.00 | |||||||||||||||||||
| 80.00 | X | O | X | O | O | X | X | O | X | O | X | 80.00 | |||||||||||||||||
| 79.00 | X | O | X | O | C | O | 1 | O | X | O | X | X | Mid | 79.00 | |||||||||||||||
| 78.00 | X | 9 | O | X | O | X | O | X | O | X | O | 2 | 78.00 | ||||||||||||||||
| 77.00 | X | X | O | X | O | X | O | O | X | O | X | 77.00 | |||||||||||||||||
| 76.00 | X | O | X | O | X | O | O | O | X | 76.00 | |||||||||||||||||||
| 75.00 | X | O | X | O | X | O | • | 75.00 | |||||||||||||||||||||
| 74.00 | X | O | O | X | • | • | 74.00 | ||||||||||||||||||||||
| 73.00 | X | X | O | X | • | 73.00 | |||||||||||||||||||||||
| 72.00 | X | O | X | X | O | X | • | 72.00 | |||||||||||||||||||||
| 71.00 | X | X | O | X | O | X | O | X | • | 71.00 | |||||||||||||||||||
| 70.00 | X | O | 7 | O | X | O | X | O | • | 70.00 | |||||||||||||||||||
| 69.00 | X | O | X | O | X | O | X | • | 69.00 | ||||||||||||||||||||
| 68.00 | X | O | X | O | O | X | • | 68.00 | |||||||||||||||||||||
| 67.00 | O | X | O | X | O | X | • | 67.00 | |||||||||||||||||||||
| 66.00 | O | X | O | 8 | X | • | 66.00 | ||||||||||||||||||||||
| 65.00 | 6 | O | X | • | Bot | 65.00 | |||||||||||||||||||||||
| 64.00 | O | • | 64.00 | ||||||||||||||||||||||||||
| 26 |
| AMD Advanced Micro Devices, Inc. ($201.60) - Semiconductors - AMD fell Wednesday after the company's earnings announcement, moving to a sell signal at $232 before dropping over 16% intraday to $200. This also led the stock to reverse back down into a column of Os against the market, demoting it to a 3 for 5 TA rating. AMD is now within one box of giving an RS sell signal on that chart, jeopardizing its TA suitability. Further support can be seen initially at $198 with additional support offered at $196. |
| ATO Atmos Energy Corp ($173.89) - Gas Utilities - ATO reversed into Xs and broke a double top at $174 to return to a buy signal. ATO has been at least a 3 technical attribute since May 2024 and currently maintains a 4 TA rating, while ranking within the top quintile of the Gas Utilities sector matrix. Okay to consider here on the breakout. Note the stoc's all-time high at $180. Initial support can be found at $164, while additional lies in the lower $160s and at $150. |
| BG Bunge Limited ($116.64) - Food Beverages/Soap - Shares of BG broke a double top at $120 for its third consecutive buy signal. The 4 for 5'er regained long-term market relative strength last month and BG is now in buy territory. However, the stock is trading in overbought territory well above the top of its ten-week trading band, so it could cool down over the next couple weeks. Those looking to buy should wait for a pullback to the low $100s or general consolidation before pulling the trigger. Initial support lies at $112 with the bullish support line at $93. |
| BSX Boston Scientific Corporation ($77.19) - Healthcare - BSX moved down sharply, completing a double bottom break at $87 and reaching an intraday low below $75. The 2 for 5'er shifted down from a 3 last month after reversing back into a negative trend. Additionally, the stock ranks in the bottom half of the healthcare sector matrix. The weekly OBOS indicates that the stock is in heavily oversold territory, so wait for the 10-week trading band to normalize before selling your position. Initial resistance can be seen at $94, with additional resistance at $100. |
| CASY Casey's General Stores Inc ($655.80) - Retailing - CASY broke a double top at $648 for a second buy signal as shares rallied to $656, a new all-time chart high. The stock has been at least a 3 technical attribute stock since May 2023 and currently maintains a 5 TA rating while ranking in the top quartile of the Retailing sector matrix. Okay to consider on a pullback to the $610 to $640 range. Initial support lies at $608, while additional can be found at $536. |
| CBT Cabot Corp ($78.73) - Chemicals - CBT was up more than 10% Tuesday and returned to a positive trend when it broke a double top at $75. The outlook for the stock remains unfavorable, however, as even with the positive trend change CBT is a 2 for 5'er. Wednesday's move has also pushed CBT into heavily overbought territory with a weekly OBOS reading of 112%. |
| CC The Chemours Company ($17.94) - Chemicals - CC returned to a buy signal Tuesday when it broke a triple top at $17 and continued higher to $18, where it now sits against resistance. The outlook for the stock remains unfavorable, however, as CC is a 2 for 5'er. Tuesday's has pushed the stock even further into extended territory with a weekly OBOS reading of 116%. |
| DOV Dover Corporation ($219.94) - Machinery and Tools - DOV moved higher today, meeting all-time chart highs at $220 in the process. This 3/5'er has now posted a string of five consecutive buy signals on its default PnF chart, adding to the positive weight of the evidence for the name. While it is worth noting that the stock is heavily overbought around current levels, those looking for focused exposure are fine to add to positions here. More defensive players might wait for DOV to establish new highs, signaling strength for bulls in the near term. |
| EBAY eBay Inc. ($86.62) - Retailing - EBAY broke a triple bottom at $90 to return the stock to a sell signal as shares fell to $82, violating the bullish support line. This will drop the stock down to a 2 for 5'er for the first time in roughly 2 years and will place the stock in the bottom half of the Retailing sector matrix. From here, support lies at current chart levels, while additoinal may be found at $80 and $78. |
| EXPE Expedia Group Inc. ($232.40) - Leisure - EXPE reversed into Os and broke a double bottom at $260 for a third sell signal as shares felll to $224, violating the bullish support line. The breakdown on the trend chart follows a reversal into Os on the market RS chart during trading on 2/3 and will cause the peer RS chart to reverse into Os, dropping the stock to a 2 for 5'er in conjunction with the trend flip. Support for the stock now lies at $212. |
| KR The Kroger Co. ($66.62) - Retailing - Shares of KR broke a double top at $66 for its second consecutive buy signal. Today's action also saw the stock flip its trend back to positive, bringing KR up to hold territory as 3 for 5'er for the first time since September. That said, the stock still lacks near-term relative strength, keeping it out of buy territory for the time being. From here, initial resistance lies at $68, $69, and $74. |
| LLY Eli Lilly and Company ($1,108.65) - Drugs - LLY reversed back into Xs on Wednesday, breaking a double top at $1072 and reaching an intraday high above $1104. The 5 for 5'er ranks in the top third of the drugs sector matrix. Long exposure can be made here, given the weight of the evidence. Initial strong support can be seen between $992-$1008, with additional support at $784. Resistance can be seen at $1120. |
| MCD McDonald's Corporation ($324.11) - Restaurants - MCD broke a double top at $324 for a second buy signal and to match the March 2025 all-time chart high. The stock is a 4 for 5'er that has maintained long-term market relative strength since November 2018. Okay to consider here on the breakout. Initial support lies at $300, the bullish support lies, while additional can be found at $296 and in the $280 range. |
| MO Altria Group Inc. ($65.22) - Food Beverages/Soap - MO shares had weakened in recent months, moving to a negative trend and losing near-term market relative strength, falling to a 2 for 5'er. However, today's action saw the stock break a double top at $65 to move to a buy signal while also moving back to a positive trend, moving it up to a 3 for 5'er. The stock is more of a hold than anything, but investors could keep an eye on the name for further improvement. From here, resistance from last year's highs lie at $67 and $68. |
| NVDA NVIDIA Corporation ($175.25) - Semiconductors - NVDA moved lower Wednesday to break a double bottom at $176 before falling to $172 intraday. This moved the default chart into a negative trend for the first time since last April. The stock will now have a 3 for 5 TA rating and is within one box of reversing down into Os on its market RS chart. The technical picture has stagnated since last August and is now showing weakness. Note that the stock is at support from December, with further support seen at $170 and $166. A violation of that range to $164 or lower would be more concerning. Overhead resistance is not seen until $194. Note that earnings are expected on 2/25. |
| OLN Olin Corp ($25.44) - Chemicals - OLN returned to a buy signal Tuesday when it broke a double top at $25. The outlook for the stock remains decidedly negative, however, as OLN is a 0 for 5'er that ranks in the bottom half of the chemicals sector matrix. From here, the next level of overhead resistance sits at $27. |
| PLTR Palantir Technologies Inc. Class A ($137.98) - Software - PLTR fell Wednesday, moving to a sell signal at $144 before dropping over 12% to $136 intraday. This stock still has a 3 for 5 TA rating but has shown substantial near-term weakness, giving five consecutive sell signals. While the technical picture is weakening, note that PLTR is in a heavily oversold position. Current holders may look to trim on a rally or eliminate exposure with further TA weakness. Prospective long investors should wait for more consistent improvement before jumping into new positions. Additional support may be seen at $130 and $120. Overhead resistance may be seen at $164. |
| VLO Valero Energy Corp ($197.41) - Oil Service - After giving two consecutive sell signals VLO returned to a buy signal Wednesday with a triple top break at $196. Wednesday's move adds to an already positive technical picture as VLO is a 4 for 5'er that ranks in the top half of the favored oil service sector matrix. Wednesday's move has pushed VLO into heavily extended territory with a weekly OBOS reading of 82%. |
| Name | Option Symbol | Action | Stop Loss |
|---|---|---|---|
| GE Aerospace - $307.49 | O: 26E310.00D15 | Buy the May 310.00 calls at 21.95 | 276.00 |
| Name | Option | Action |
|---|---|---|
| Gilead Sciences, Inc. ( GILD) | Mar. 125.00 Calls | Raise the option stop loss to 18.65 (CP: 20.65) |
| Apple Inc. ( AAPL) | Apr. 260.00 Calls | Raise the option stop loss to 22.50 (CP: 24.50) |
| J.P. Morgan Chase & Co. ( JPM) | Apr. 310.00 Calls | Initiate an option stop loss of 17.55 (CP: 19.55) |
| Wells Fargo & Company ( WFC) | Apr. 87.50 Calls | Raise the option stop loss to 6.05 (CP: 8.05) |
| Walmart Inc. ( WMT) | Apr. 115.00 Calls | Raise the option stop loss to 13.50 (CP: 15.50) |
| Bank of America ( BAC) | Apr. 52.50 Calls | Initiate an option stop loss of 2.65 (CP: 4.65) |
| Hilton Worldwide Holdings Inc ( HLT) | Mar. 300.00 Calls | Raise the option stop loss to 14.00 (CP: 16.00) |
| The TJX Companies, Inc. ( TJX) | Apr. 145.00 Calls | Raise the option stop loss to 10.90 (CP: 12.90) |
| Name | Option Symbol | Action | Stop Loss |
|---|---|---|---|
| Occidental Petroleum Corporation - $46.58 | O: 26N47.50D20 | Buy the May 47.50 puts at 3.80 | 51.00 |
| Name | Option | Action |
|---|---|---|
| GoDaddy Inc. ( GDDY) | Feb. 130.00 Puts | Stopped at 32.70 (CP: 32.40) |
| Paypal Holdings Inc ( PYPL) | Mar. 60.00 Puts | Raise the option stop loss to 17.10 (CP: 19.10) |
| Diageo (United Kingdom) ADR ( DEO) | Apr. 90.00 Puts | Stopped at 95.00 (CP: 97.49) |
| American Tower REIT ( AMT) | Apr. 175.00 Puts | Stopped at 0.00 (CP: 176.18) |
| Uber Technologies, Inc. ( UBER) | Apr. 80.00 Puts | Raise the option stop loss to 5.80 (CP: 7.80) |
| Marvell Technology Inc. ( MRVL) | Mar. 80.00 Puts | Raise the option stop loss to 8.20 (CP: 10.20) |
| Name | Option Sym. | Call to Sell | Call Price | Investment for 500 Shares | Annual Called Rtn. | Annual Static Rtn. | Downside Protection |
|---|---|---|---|---|---|---|---|
| Brinker International Inc $ 163.45 | O: 26D165.00D17 | Apr. 165.00 | 161.27 | $ 76,095.35 | 37.30% | 30.24% | 5.63% |
| Name | Action |
|---|---|
| Alcoa Inc. ( AA) - 61.35 | Sell the March 60.00 Calls. |
| Intel Corporation ( INTC) - 49.25 | Sell the May 49.00 Calls. |
| The Gap, Inc. ( GAP) - 28.34 | Sell the March 29.00 Calls. |
| Citigroup, Inc. ( C) - 117.71 | Sell the April 120.00 Calls. |
| Name | Covered Write |
|---|---|
|
|
|
Daily Equity & Market Analysis
Loading, Please Wait...
