Most Requested Symbols

Industrial names have taken over the top of the NDW rankings. Today we talk about the strength and give you a list of ideas you could look towards for focused exposure.
Leverage allows investors to achieve superhuman gains–albeit with the potential for superhuman losses as well. Given their high risk and reward, what can you expect when owning leveraged funds?
Weekly Rundown Video – Feb 4, 2026
Weekly rundown with NDW analyst team covering all major asset classes.
Weekly rundown with NDW analyst team covering all major asset classes.
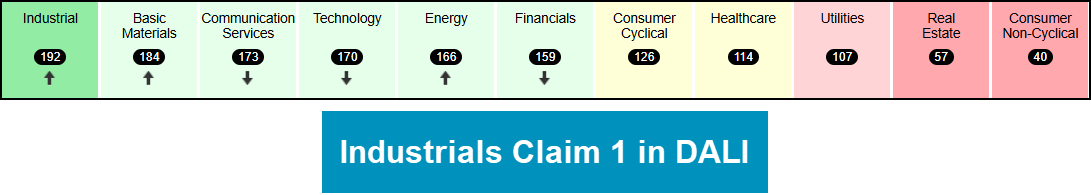
Move over technology, there’s a new sheriff in town. Last Friday’s recent daily equity report touched heavily on the recent weakness stemming from the software space, a thorn in the side of a sector which has been an outstanding leader over the last few years. While it is certainly to early to conclude if the recent exhale for the tech space (or growthier areas in general) is just that or perhaps a symptom of something more, we will take today’s report to highlight the uptick in Relative Strength (RS) for the industrials group. The sector has stormed into the first position within NDW’s sector rankings, its highest ranking since a brief three day stint back in September 2024. Besides that, the group has earned a position within the top half of the rankings since 2022, speaking to the longer-term technically acceptable stature of the sector. The sector is the only one of the 11 to outscore the core S&P 500 index funds group on the Asset Class Group Scores Page, earning an impressive 4.85 average score at the time of this writing on 2/9.
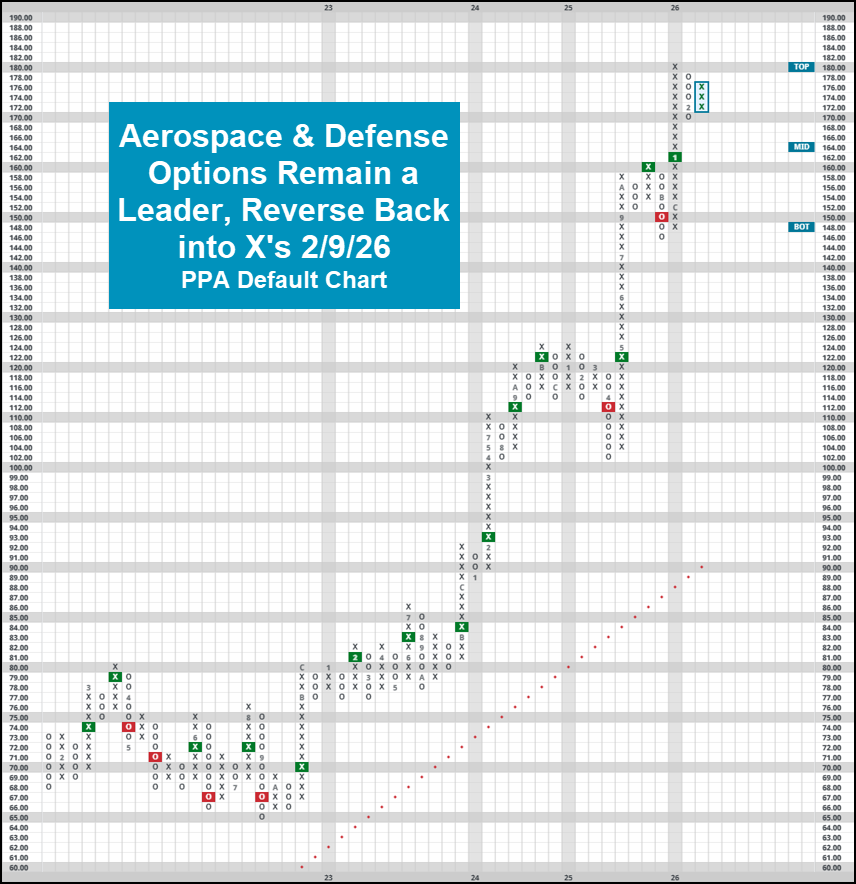
Strength to open 2026 was largely pushed by an uptick in demand for aerospace and defense names. The subsector has been a point of strength due in part to increased global unrest, which we have highlighted in various sector highlights over the last few months. PPA (pictured below) is up nearly 13% so far this year, earning a strong 5.70 fund score. The fund has been on an RS buy signal for the better part of the last decade- having bested SPX by roughly 64% since October 2017 (+237% vs 174%, respectively.) Having reversed back up into X’s on its default chart with intraday action on 2/9/26, the technical picture for PPA is strong an continues to improve. While it is undoubtedly true the space is flirting with an overbought stature, continued heightened possibility for global unrest should continue to be a large tailwind, adding to the technical weight of the evidence. Aerospace and defense names have found their way into several of NDW’s premade models- PPA earning a spot in the Invesco Sector Seven Model & MISL marking one of the five holdings of the First Trust Focus Five- both of which are having stellar openings to 2026.
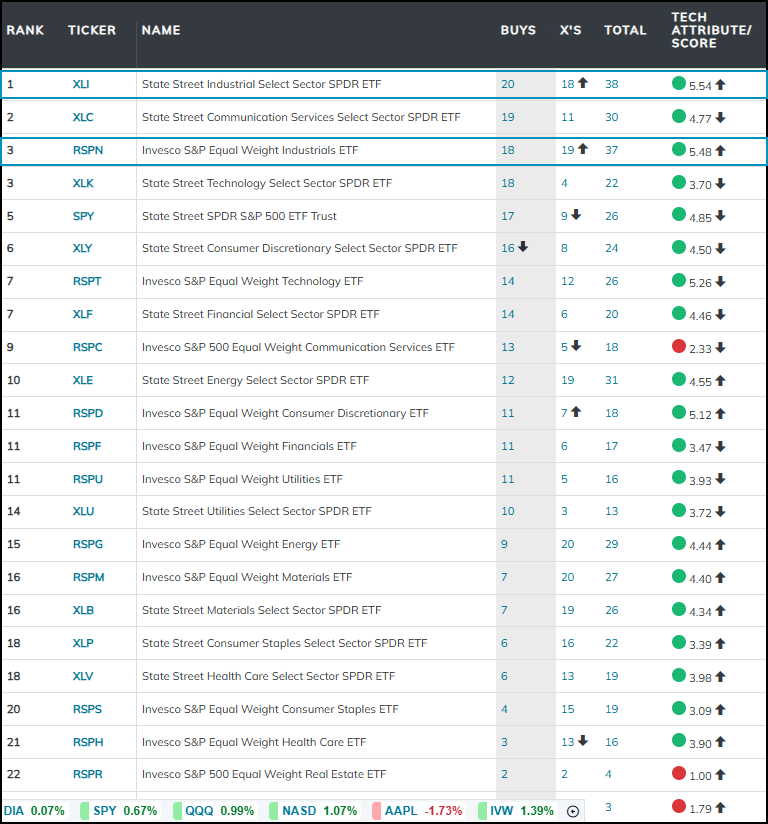
But every sector has focused points of strength similar to industrials and the aerospace and defense subsector. What is perhaps the most compelling option for continued industrials leadership is the apparent broad based improvement the sector has seen so far this year. To judge this, we can focus on the relative strength matrix below which includes both cap and equal weighted representatives from the 11 broad sectors. At the top, you’ll notice cap weighted representatives from both industrials and communication services sectors, followed closely by RSPN, the equal weighted industrials option. RSPT is the next best equal weight option, currently sitting in the 7th position. Point being- the sector appears to lead on both fronts and overall participation looks to be healthy underneath the hood, suggesting there may be plenty of technically strong stocks you could look to for focused exposure.
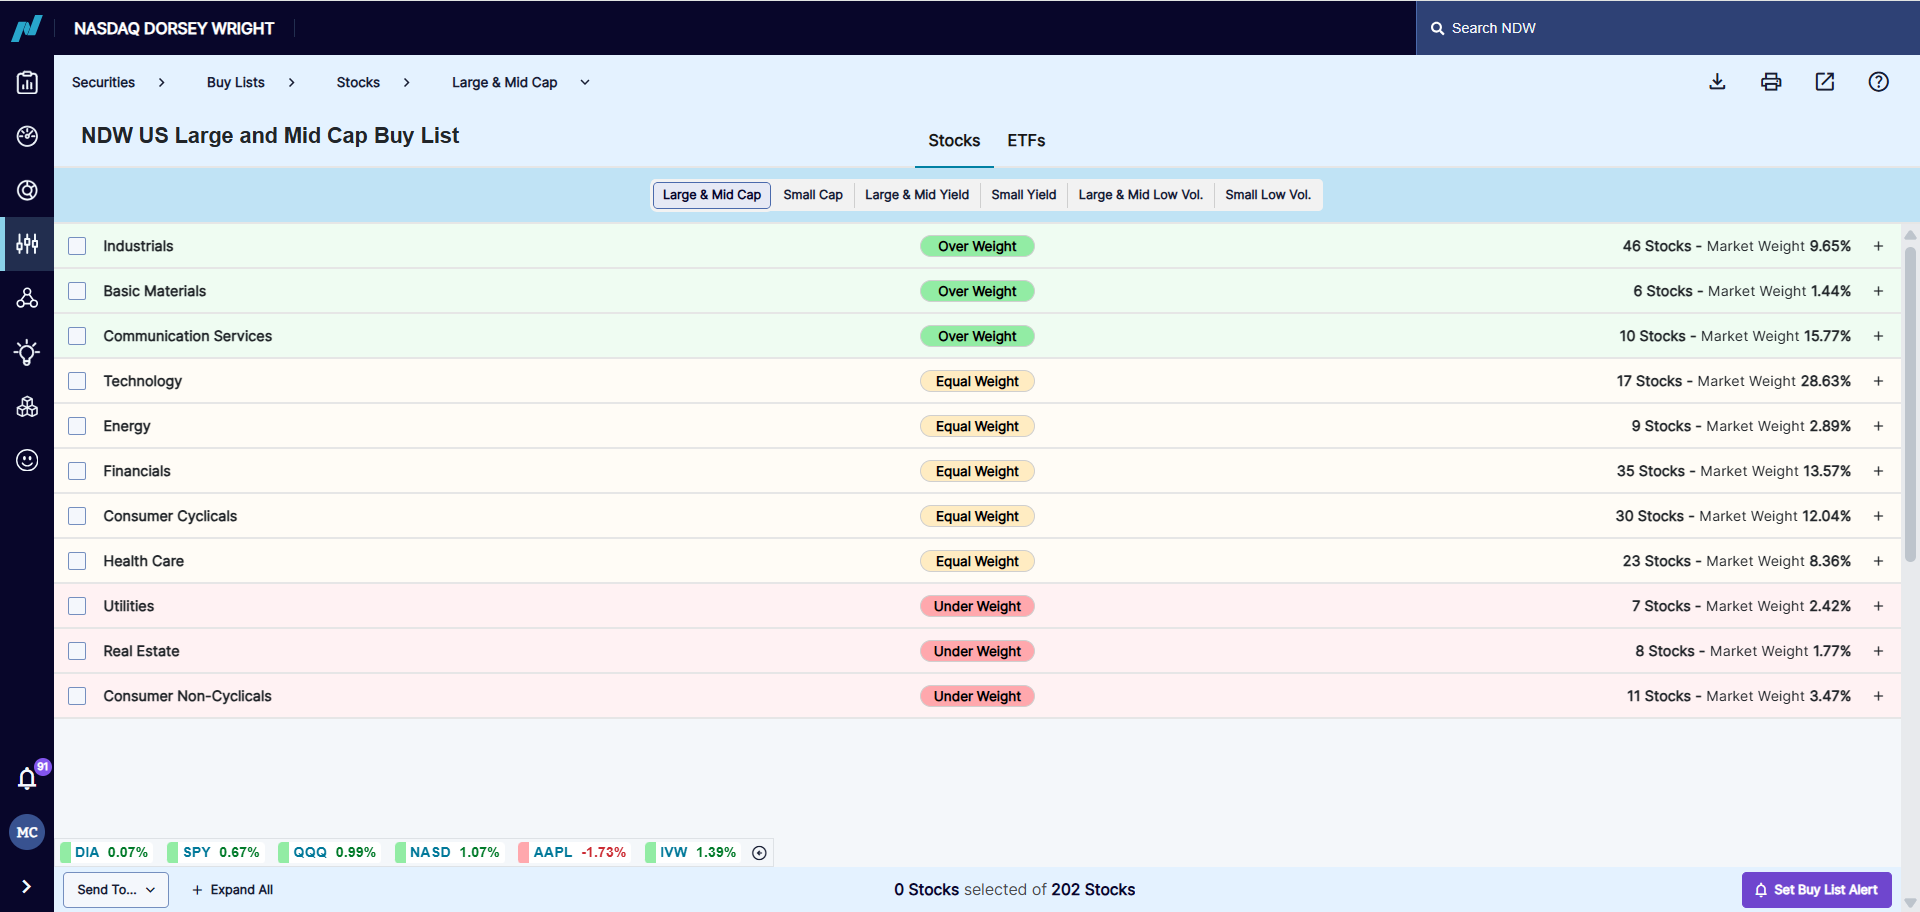
Speaking of, those of you looking for individual stock ideas may be best suited to journey over to the stock buy lists available on the platform. Linked here, the buy lists break down technically actionable (4 & 5 TA Score stocks) littered across each sector. You can also drill down specifically for low volatility, dividend, or small cap stocks for an even more focused list, or click into our ETF buy list which runs a similar scoring test over ETFs via our fund scoring system. Point being, there are currently 46 large cap industrial stocks that you can thumb through, the most of any sector. Keep in mind, some of these options will lean towards overbought territory… so remember to set alerts to be notified of desired price targets.

Leverage can allow investors to achieve superhuman gains–albeit with the potential for superhuman losses as well. These strategies, once reserved only for financial institutions, are more accessible than ever with leveraged ETFs. However, just because they exist doesn’t mean they’re a viable investment for all individuals. Given their high risk and reward, what can you expect when owning them?
The Good: Returns
The easiest way to increase returns is through additional risk, which is why leverage can offer returns that would be borderline impossible under normal circumstances. Last year represented a relatively bullish year for equities, and those invested in leveraged funds made out even better. The S&P 500 rose 16.4% in 2025, but the ProShares Ultra S&P500 2X ETF (SSO) exceeded that with a gain of 25.2%. The last three years offer an almost best-case scenario for leveraged funds, with the market steadily rising with low volatility. From the start of 2023, the Nasdaq-100 (NDX) has risen 129%, but the leveraged ProShares Ultra QQQ 2X ETF (QLD) blows that out of the water with a gain of more than 292%. However, not every year is as kind to investors as the last three, so how well do leveraged funds perform in an average year?
To quantify leverage’s impact, we created ten portfolios following the S&P 500 since 1950, with each portfolio increasing its allocation to a double leverage S&P 500 index in 10% increments. Leverage isn’t free, so to simulate real-life borrowing costs, we added a 1% annualized expense ratio taken daily from the double and triple leverage index—close to popular funds like SSO & QLD. Looking at the table below, we see that leverage has a clear benefit to average returns across the board.
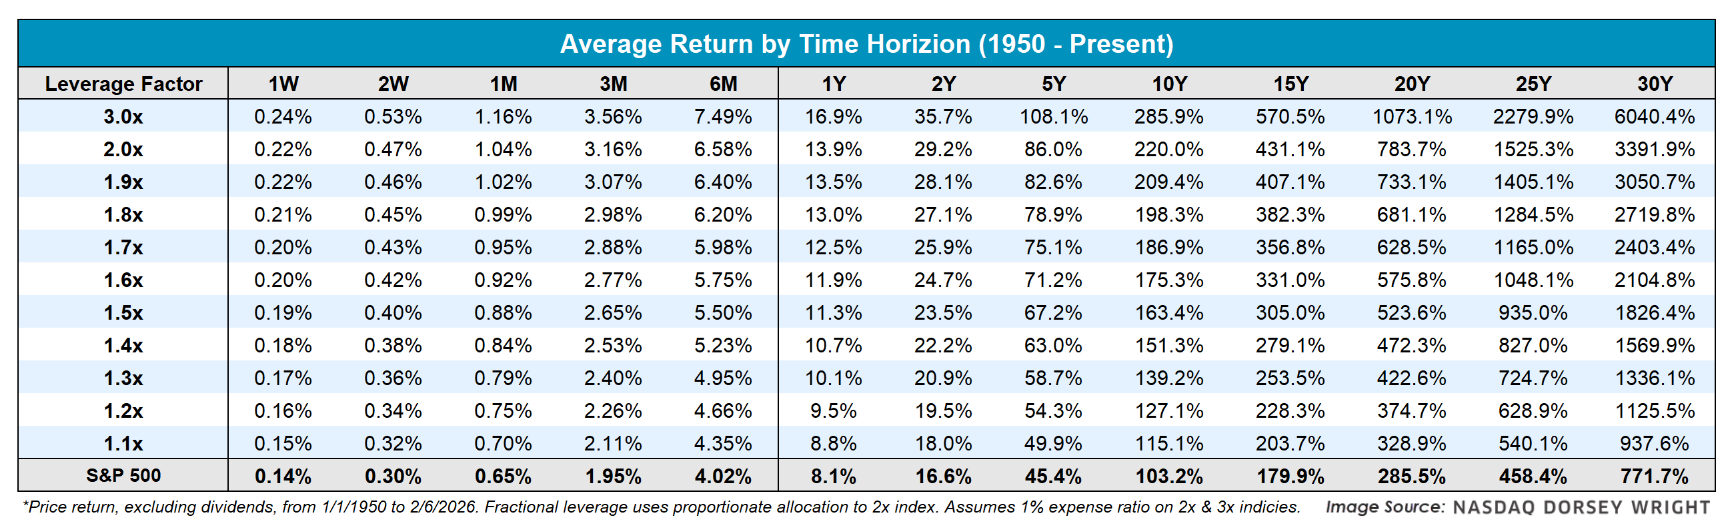
Due to the power of compounding returns, this impact is even more impressive at longer time horizons. A double leverage fund averages a gain of ~3400% across a thirty-year time horizon, which dominates the ~770% average thirty-year gain for the S&P 500. However, as we will mention later, holding leveraged funds for that long is easier said than done.
The Bad: Divergence From Expectation
While the promise of double or more returns may sound promising, a leveraged fund’s return can diverge significantly from its intended target over your holding period. Looking at the previous return table, you’d need to own a “double” leveraged fund for 10 years before averaging a return double that of the S&P 500. In essence, double leverage funds average twice the risk for less than double the gains for most investors. This is due to leverage funds being reset daily, meaning their effects compound enough to result in leverage decay. Additionally, leverage decay is more pronounced in high volatility environments, meaning leveraged funds work best in periods of stability.
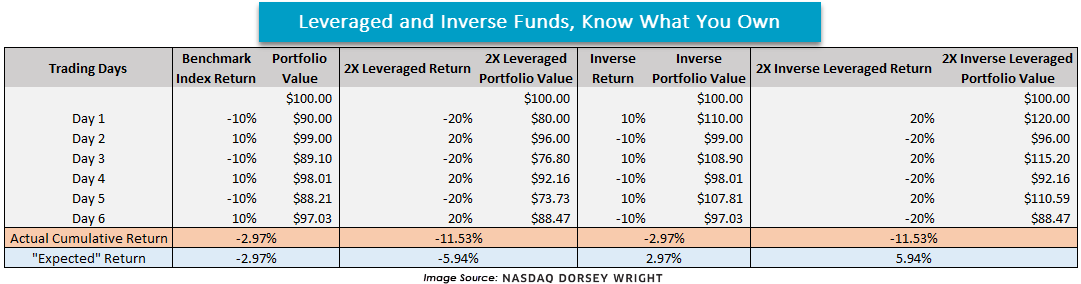
The table below shows an extreme example of how this can play out in four hypothetical portfolios after six consecutive days moving 10% in opposite directions. As you can see, none of the leveraged or inverse portfolios met their “expected return,” which was based on the ending benchmark return. While such a scenario is highly unlikely, it showcases how leveraged funds often don’t act as one may anticipate.
Beyond these issues, leveraged funds can have trouble achieving their targeted leverage. A example comes from double leverage Strategy (MSTR) funds last year, which failed to obtain enough swaps to secure its targeted leverage on several occasions. Inherent in the risk of leveraged funds is that they may no longer function as promised.
The Ugly: Downside Difficulties
Leveraged funds can get ugly fast. The biggest risk of owning leveraged funds is that your downside exposure is significantly higher. To give a general sense of how ugly funds can get, we looked at two metrics of evaluating risk across different time horizons: minimum return and average max drawdown.
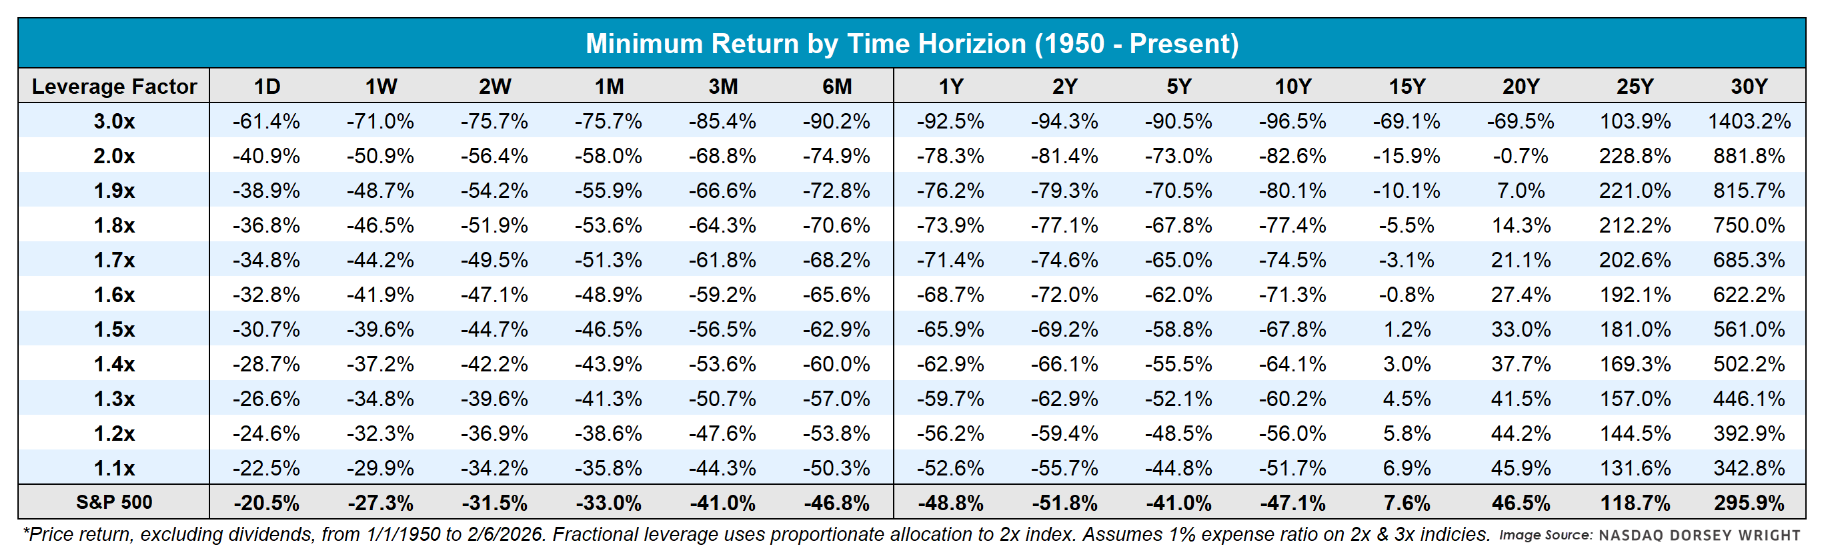
The first table below details the minimum return, which is the worst return across any period of that length. For example, the worst return of the S&P 500 in any one week since 1950 is -27.3%, which took place during the five trading days ending on Black Monday 1987. However, that week’s return looks tame compared to leveraged funds. During that same week, double and triple leveraged funds would have lost 50.9% and 71.0%, respectively. Looking further out, those invested in the S&P 500 for six months were limited to a loss of less than 50%, while those in double or triple leveraged funds would have fared far worse with losses of 74.9% and 90.2%, respectively.
While minimum return provides an idea of an extreme bear scenario, what can we expect along the average ride? To answer that question, we looked at the average drawdown of each portfolio—defined as the maximum peak-to-trough decline—for each portfolio across different time horizons since 1950. Over that period, the average drawdown was 13.3% for a one-year time horizon. Said plainly, the S&P 500 is down 13.3% from an intra-year high on average at some point during the year. Meanwhile, you can expect a triple leveraged fund to decline by 34.1% at some point within a year.

One interesting trend is that the minimum return of leveraged funds is higher than the S&P 500 after 25 years. Even during their worst 25-year periods since 1950, investors would’ve had higher returns owning a triple leveraged fund relative to the index. However, despite that higher minimum, the triple leverage holder should expect a 90% drawdown on average compared to only 50% for the index. Frankly, there are very few investors who could make it through a 75% loss—let alone 90%, which brings us to the biggest problem. Most individuals aren’t willing to hold through such a sharp decline, and given that leveraged funds will see those types of drawdowns, their benefits are almost entirely negated for the average investor. While investors of SSO made 25% last year, they also experienced a 35% drawdown during that same period, and those gains wouldn't have been realized if investors panic sold near the bottom.
Today’s feature is focused primarily on leveraged funds that follow the S&P 500. Leveraged funds that track more volatile indices—or even worse, individual securities—are subject to more severe drawdowns and divergence from their target. The triple leveraged ProShares UltraPro QQQ 3X (TQQQ) is still down 62% from its peak in 2000 despite the non-levered QQQ rising more than 416%. Even worse, if you invested $1,000 in a triple leverage S&P 500 fund on 9/3/1929, you would have been left with $0.24 if you sold it on 4/28/1942 for an abysmal -99.98% return over ~12.5 years. Granted, that’s the worst possible scenario for leveraged funds, but it shows just how bleak things can get at their ugliest.
The Bottom Line
At their worst, leveraged funds can wipe out an individual’s wealth. However, when used responsibly, leveraged funds can provide long-term benefits to returns for those who can stomach the volatility. Partial allocations could be justified for those seeking additional capital appreciation, especially for clients with a high risk tolerance and a long time horizon. That said, just because a client could withstand a pullback doesn’t mean they would be able to stomach a drawdown after looking at their account. When you buy leveraged funds and get an environment like the last two years, you might look like a genius to clients. But if someone’s position is down almost 70%—like SSO was in 2008—they might not be a client much longer. Consequently, leveraged funds are a powerful double-edged sword that should be wielded with the utmost caution.
Average Level
31.75
| < - -100 | -100 - -80 | -80 - -60 | -60 - -40 | -40 - -20 | -20 - 0 | 0 - 20 | 20 - 40 | 40 - 60 | 60 - 80 | 80 - 100 | 100 - > |
|---|---|---|---|---|---|---|---|---|---|---|---|
|
Sell signallqd
|
|||||||||||
|
Sell signalVOOG
|
Buy signalhyg
|
Buy signalgsg
|
|||||||||
|
Sell signalONEQ
|
Buy signalshy
|
Buy signalGLD
|
|||||||||
|
Sell signaldx/y
|
Buy signalagg
|
Sell signalicf
|
Buy signalijr
|
||||||||
|
Buy signalQQQ
|
Sell signalief
|
Buy signalgcc
|
Buy signalfxe
|
Buy signaldia
|
Buy signalrsp
|
Buy signalVOOV
|
Buy signalefa
|
||||
|
Buy signalXLG
|
Sell signaltlt
|
Buy signalSPY
|
Buy signaliwm
|
Buy signaluso
|
Buy signalIJH
|
Buy signalEEM
|
Buy signaldvy
|
||||
| < - -100 | -100 - -80 | -80 - -60 | -60 - -40 | -40 - -20 | -20 - 0 | 0 - 20 | 20 - 40 | 40 - 60 | 60 - 80 | 80 - 100 | 100 - > |
| AGG | iShares US Core Bond ETF |
| USO | United States Oil Fund |
| DIA | SPDR Dow Jones Industrial Average ETF |
| DVY | iShares Dow Jones Select Dividend Index ETF |
| DX/Y | NYCE U.S.Dollar Index Spot |
| EFA | iShares MSCI EAFE ETF |
| FXE | Invesco CurrencyShares Euro Trust |
| GLD | SPDR Gold Trust |
| GSG | iShares S&P GSCI Commodity-Indexed Trust |
| HYG | iShares iBoxx $ High Yield Corporate Bond ETF |
| ICF | iShares Cohen & Steers Realty ETF |
| IEF | iShares Barclays 7-10 Yr. Tres. Bond ETF |
| LQD | iShares iBoxx $ Investment Grade Corp. Bond ETF |
| IJH | iShares S&P 400 MidCap Index Fund |
| ONEQ | Fidelity Nasdaq Composite Index Track |
| QQQ | Invesco QQQ Trust |
| RSP | Invesco S&P 500 Equal Weight ETF |
| IWM | iShares Russell 2000 Index ETF |
| SHY | iShares Barclays 1-3 Year Tres. Bond ETF |
| IJR | iShares S&P 600 SmallCap Index Fund |
| SPY | SPDR S&P 500 Index ETF Trust |
| TLT | iShares Barclays 20+ Year Treasury Bond ETF |
| GCC | WisdomTree Continuous Commodity Index Fund |
| VOOG | Vanguard S&P 500 Growth ETF |
| VOOV | Vanguard S&P 500 Value ETF |
| EEM | iShares MSCI Emerging Markets ETF |
| XLG | Invesco S&P 500 Top 50 ETF |

| Symbol | Company | Sector | Current Price | Action Price | Target | Stop | Notes |
|---|---|---|---|---|---|---|---|
| BCO | The Brink's Company | Protection Safety Equipment | $130.91 | mid 110s - low 120s | 152 | 104 | 5 for 5'er, top half of PROT sector matrix, LT pos peer & mkt RS, spread triple top, R-R>2.0, Earn. 2/25 |
| JPM | J.P. Morgan Chase & Co. | Banks | $322.40 | lo 300s - mid 320s | 380 | 256 | 5 TA rating, top 25% of favored BANK sector matrix, LT RS buy, LT pos trend, buy-on-pullback |
| ENVA | Enova International Inc | Finance | $161.10 | hi 150s - 160s | 190 | 142 | 5 for 5'er, 2 of 78 in FINA sector matrix, LT pos peer & mkt RS |
| EWBC | East West Bancorp, Inc. | Banks | $122.50 | mid 100s - mid 110s | 157 | 92 | 4 for 5'er, top third of favored BANK sector matrix, LT pos peer RS, one box from mkt RS buy, spread quad top |
| ULTA | Ulta Beauty, Inc. | Retailing | $690.37 | 632 - hi 600s | 840 | 568 | 4 TA rating, top 10% of RETA sector matrix, LT RS buy, consec buy signals |
| APTV | Aptiv PLC | Autos and Parts | $82.38 | hi 70s - low 80s | 100 | 69 | 5 for 5'er, top half of AUTO sector matrix, successful trend line test |
| GS | Goldman Sachs Group, Inc. | Wall Street | $928.75 | mid-800s - mid-900s | 1416 | 736 | 5 TA rating, top 10% of WALL sector matrix, LT RS buy, LT pos trend, buy-on-pullback |
| PHM | PulteGroup, Inc. | Building | $135.09 | hi 120s - mid 130s | 168 | 110 | 4 for 5'er, top half of BUIL sector matrix, LT pos peer & mkt RS, bullish catapult |
| META | Meta Platform Inc. | Internet | $661.46 | 650s - 690s | 1040 | 552 | 4 for 5'er, top 20% of INET sector matrix, LT pos peer & mkt RS, triple top, buy on pullback |
| Symbol | Company | Sector | Current Price | Action Price | Target | Stop | Notes |
|---|
| Symbol | Company | Sector | Current Price | Action Price | Target | Stop | Notes |
|---|---|---|---|---|---|---|---|
| WFC | Wells Fargo & Company | Banks | $93.97 | mid 80s - low 90s | 128 | 76 | WFC has fallen to a sell signal. OK to hold here. Maintain $76 stop. |
| Comment | |||||||
|---|---|---|---|---|---|---|---|
|
|
|||||||
META Meta Platform Inc. R ($682.71) - Internet - META is a 4 for 5'er that ranks in the top quintile of the internet sector matrix and has been on peer & market RS buy signals since 2023. After falling to a sell signal in January, found support at $600 and rallied, returning to a buy signal with a triple top back at $680. The stock continued higher to $744 before pulling back to the near of its trading band in last week's trading, offering an entry point long exposure. Positions may be added in the $650s to $690s and we will set our initial stop at $552, which would violate META's bullish support line. We will use the bullish price objective, $1,040, as our target price.
| 26 | |||||||||||||||||||||||||||||
| 792.00 | X | 792.00 | |||||||||||||||||||||||||||
| 784.00 | X | X | O | X | Top | 784.00 | |||||||||||||||||||||||
| 776.00 | X | O | X | O | X | O | 776.00 | ||||||||||||||||||||||
| 768.00 | X | O | X | O | X | O | 768.00 | ||||||||||||||||||||||
| 760.00 | X | 8 | X | O | X | O | 760.00 | ||||||||||||||||||||||
| 752.00 | X | O | O | X | O | X | 752.00 | ||||||||||||||||||||||
| 744.00 | X | X | O | X | O | X | O | X | 744.00 | ||||||||||||||||||||
| 736.00 | X | O | X | O | X | O | X | O | X | O | 736.00 | ||||||||||||||||||
| 728.00 | X | O | X | 9 | O | X | X | O | X | O | 728.00 | ||||||||||||||||||
| 720.00 | X | 7 | X | X | A | X | O | X | O | X | O | 720.00 | |||||||||||||||||
| 712.00 | X | O | X | O | X | O | X | O | X | O | X | 2 | 712.00 | ||||||||||||||||
| 704.00 | X | X | O | X | O | X | O | X | O | O | X | O | 704.00 | ||||||||||||||||
| 696.00 | X | O | X | O | O | O | O | X | O | 696.00 | |||||||||||||||||||
| 688.00 | X | O | X | O | X | O | 688.00 | ||||||||||||||||||||||
| 680.00 | X | O | O | X | O | 680.00 | |||||||||||||||||||||||
| 672.00 | X | O | X | X | X | O | 672.00 | ||||||||||||||||||||||
| 664.00 | X | O | X | O | X | O | X | O | Mid | 664.00 | |||||||||||||||||||
| 656.00 | X | 6 | O | C | O | X | O | X | O | 656.00 | |||||||||||||||||||
| 648.00 | X | O | X | O | X | O | X | 1 | X | O | 648.00 | ||||||||||||||||||
| 640.00 | X | O | X | B | X | O | O | X | 640.00 | ||||||||||||||||||||
| 632.00 | X | O | X | O | X | X | O | X | 632.00 | ||||||||||||||||||||
| 624.00 | X | O | O | X | O | X | O | X | 624.00 | ||||||||||||||||||||
| 616.00 | X | O | X | O | X | O | X | 616.00 | |||||||||||||||||||||
| 608.00 | X | O | O | X | O | X | 608.00 | ||||||||||||||||||||||
| 600.00 | X | O | X | O | 600.00 | ||||||||||||||||||||||||
| 592.00 | X | O | X | 592.00 | |||||||||||||||||||||||||
| 584.00 | X | O | 584.00 | ||||||||||||||||||||||||||
| 576.00 | X | 576.00 | |||||||||||||||||||||||||||
| 568.00 | X | 568.00 | |||||||||||||||||||||||||||
| 560.00 | 5 | 560.00 | |||||||||||||||||||||||||||
| 552.00 | X | 552.00 | |||||||||||||||||||||||||||
| 544.00 | X | • | Bot | 544.00 | |||||||||||||||||||||||||
| 536.00 | X | • | 536.00 | ||||||||||||||||||||||||||
| 528.00 | X | • | 528.00 | ||||||||||||||||||||||||||
| 520.00 | X | • | 520.00 | ||||||||||||||||||||||||||
| 512.00 | X | • | 512.00 | ||||||||||||||||||||||||||
| 504.00 | X | • | 504.00 | ||||||||||||||||||||||||||
| 496.00 | X | • | 496.00 | ||||||||||||||||||||||||||
| 488.00 | X | • | 488.00 | ||||||||||||||||||||||||||
| 26 |
| ADBE Adobe Systems Incorporated ($266.90) - Software - ADBE dropped Monday to break a double bottom at $264, marking a fourth consecutive sell signal and a new multi-year low. This 0 for 5'er moved to a negative trend last month and has been on an RS sell signal against the market since 2021. The weight of the technical evidence is weak here and continues to deteriorate. Long exposure should be avoided. Current holders should note that ADBE is in an oversold position, potentially creating a sell-on-rally candidate. Overhead resistance may be seen at $280. |
| AGI Alamos Gold Inc ($43.85) - Precious Metals - AGI returned to a buy signal Monday when it broke a double top at $42. The move adds to an already favorable technical picture as AGI is a 4 for 5'er; from here, the next level of resistance sits at $45, a level from which AGI reversed down twice in January. |
| CNR Core Natural Resources Inc. ($94.42) - Oil - After giving three consecutive sell signals, CNR returned to a buy signal Monday when it broke a double top at $95, where it now sits against its bearish resistance line. The outlook for the stock remains negative as CNR is a 1 for 5'er. From here, support sits at $87. |
| DY Dycom Industries Inc ($416.66) - Building - DY broke a double top at $408 to return to a buy signal as shares rallied to $416, marking a new all-time chart high. The stock has been a 5 for 5'er since May 2025 and currently ranks within the top decile of the Building sector matrix. Okay to consider on a pullback to the mid $360 to mid $390 range. Initial support lies at $352, while additional can be found at $336 and $324. |
| EGO Eldorado Gold Corporation ($41.98) - Precious Metals - EGO returned to a buy signal Monday with a double top break at $42. Monday's move adds evidence to an already positive outlook as EGO is a 4 for 5'er that ranks in the top half of the precious metals sector matrix. From here, EGO faces overhead resistance at $51, its multi-year high. Meanwhile, support can be found at $37. |
| WFC Wells Fargo & Company ($94.86) - Banks - WFC shares moved higher today to complete a bullish triangle and its second consecutive buy signal. This 5 for 5'er has been in a positive trend since May and on an RS buy signal versus the market since November 2024. WFC is trading in actionable territory with a weekly overbought/oversold reading of 18%. From here, support is offered at $91 and $87. |

| Name | Option Symbol | Action | Stop Loss |
|---|---|---|---|
| United Airlines Holdings Inc. - $116.21 | O: 26E115.00D15 | Buy the May 115.00 calls at 12.95 | 104.00 |
| Name | Option | Action |
|---|---|---|
| Cisco Systems, Inc. ( CSCO) | Mar. 77.50 Calls | Raise the option stop loss to 8.15 (CP: 10.15) |
| CME Group, Inc. ( CME) | Mar. 270.00 Calls | Raise the option stop loss to 34.60 (CP: 36.60) |
| Apple Inc. ( AAPL) | Apr. 260.00 Calls | Stopped at 22.50 (CP: 21.25) |
| Wells Fargo & Company ( WFC) | Apr. 87.50 Calls | Raise the option stop loss to 7.70 (CP: 9.70) |
| Walmart Inc. ( WMT) | Apr. 115.00 Calls | Stopped at 16.20 (CP: 15.60) |
| Citigroup, Inc. ( C) | May. 120.00 Calls | Raise the option stop loss to 8.80 (CP: 10.80) |
| NVIDIA Corporation ( NVDA) | Mar. 180.00 Calls | Raise the option stop loss to 16.05 (CP: 18.05) |
| GE Aerospace ( GE) | May. 310.00 Calls | Stopped at 26.90 (CP: 25.70) |
| The Charles Schwab Corporation ( SCHW) | May. 105.00 Calls | Initiate an option stop loss of 5.00 (CP: 7.00) |
| Name | Option Symbol | Action | Stop Loss |
|---|---|---|---|
| Uber Technologies, Inc. - $74.04 | O: 26P75.00D17 | Buy the April 75.00 puts at 4.80 | 78.00 |
| Name | Option | Action |
|---|---|---|
| The Kroger Co. ( KR) | Apr. 62.50 Puts | Stopped at 68.00 (CP: 70.31) |
| Name | Option Sym. | Call to Sell | Call Price | Investment for 500 Shares | Annual Called Rtn. | Annual Static Rtn. | Downside Protection |
|---|---|---|---|---|---|---|---|
| Freeport-McMoRan Inc. $ 60.67 | O: 26C65.00D20 | Mar. 65.00 | 3.50 | $ 30,400.65 | 54.84% | 43.54% | 4.45% |
| Name | Action |
|---|---|
| Alcoa Inc. ( AA) - 59.16 | Sell the March 60.00 Calls. |
| Intel Corporation ( INTC) - 50.59 | Sell the May 49.00 Calls. |
| The Gap, Inc. ( GAP) - 29.13 | Sell the March 29.00 Calls. |
| Dollar General Corp. ( DG) - 146.65 | Sell the May 150.00 Calls. |
| Intel Corporation ( INTC) - 50.59 | Sell the March 52.50 Calls. |
| Name | Covered Write |
|---|---|
| Brinker International Inc ( EAT - 168.93 ) | April 165.00 covered write. |
Daily Equity & Market Analysis
LISTEN TO PODCAST
Feb 05, 2026
NDW MORNING UPDATE
Feb 09, 2026
Loading, Please Wait...
