Momentum proxies continued to perform quite well in 2025 as leadership trends remained largely intact in 2025. Today we explore what history suggests could be in store for the factor in 2026.
As chartists, particularly PnF chartists, we have been trained to look for patterns we can take advantage of. Whether that be finding the newest shakeout pattern on a 5 technical attribute stock or knowing what might happen during a falling dollar environment, understanding patterns can help us gain context into overall market movement thrown at us each day. Part of pattern recognition is utilizing history as a guide for future action… as the saying goes history never repeats but it often does rhyme. With that in mind, we will take today’s feature to observe what history might suggest is coming down the chute in 2026 for momentum.
To do so, we will utilize price action for proxy MTUM since 1993. From there, we can attempt to judge whether momentum carries “momentum” from year to year. As most of us know, it has been quite a productive pair of years for momentum, seeing MTUM best the broad market SPX by ~8.5% in 2024 and ~5% in 2025 (through 12/19). This comes after a historically poor showing for the factor in 2023, whose 7.51% gain lagged nearly 17% behind the broad market… it’s worst year in our observed history. Now nearly 3 years later, MTUM maintains a strong 5.10 fund score, having reversed back into X’s on its default chart to close out November. Support is offered just below the middle of the trading band at $235, which will be an important point to defend in the new year. A pullback to that point would represent a near 8% pullback.

The scatterplot below journeys back to this idea of momentum’s momentum from year to year. The X axis represents the previous year’s outperformance. Note that “outperformance” could still come with an overall negative year… it more so matters if MTUM beat our benchmark SPX. From there, we can observe the next year’s first quarter performance against SPX, plotted on the Y axis. For example, we highlighted 2024’s 8.58% calendar outperformance, which MTUM then followed up in Q1 2025 with an additional 2.27% gain over the benchmark. All this to say, data points in the top right of the graph suggest momentum continued to outperform in Q1 after doing so the previous year. Some high level statistics:
- MTUM has beat SPX in a full calendar year 22 times since 1993. That’s roughly 66% of the time.
- Of those 22 instances, MTUM has continued to outperform the market in the first quarter of the next year 15 times, or roughly 68% of the time.
- When we “hit” (meaning momentum outperformed in the previous year and Q1), it does so by an average of 3.04%

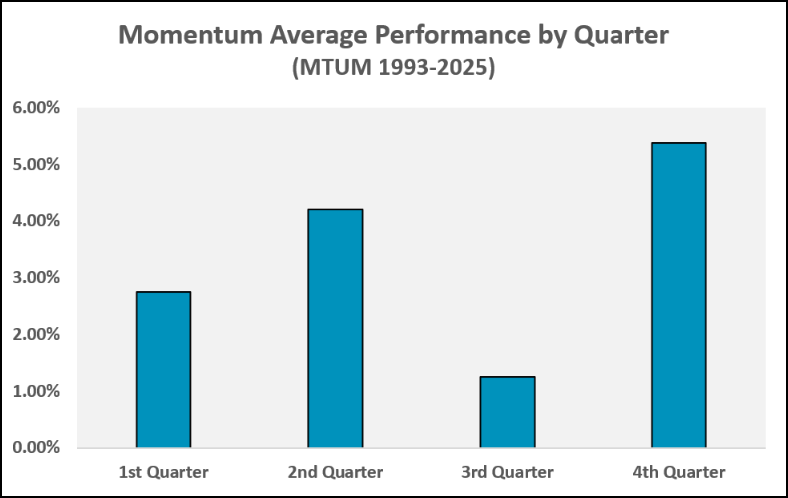
Point being, there is some credence to the idea that momentum’s momentum will follow through into Q1 2026. On average, MTUM advances in the first quarter of any year by roughly 2.75%. This is the 2nd worst (or third best!) of any quarter on average, only beating the sub 1.5% typical gain for Q3.
Remember…. averages are hardly ever hit on the nose, so chances are actual results will differ wildly from the ones explored today. Regardless, today’s study should give you some ammo for those inbound client calls asking if momentum is due for a pullback because it has done relatively well over the last few years.
Reminder: NDW offices will be closed on Christmas Day. Our team will return Friday, December 26th. Safe travels to wherever you find yourself this holiday season.