Basic Materials sit just outside of a technical overweight according to the DALI sector rankings.... but XLB still technically scores below a 3.0. Today we talk through this disagreement and steps you can take to realize what is truly leading the way.
Basic materials has moved impressively higher according to our broad asset ranking tools like DALI or the Asset Class Group Scores pages. For those of us looking to take advantage of this development, we might journey over to the chart page of XLB…. Only to be met with a sub optimal 1.83 fund score. This probably happens frequently for many of you, somewhat frequently finding scores/rankings that disagree with each other and make either seem useless for the purpose of putting money to work. While this can certainly induce analysis paralysis at first glance, it is important to step back and ask yourself: “What is this data point telling me that I can take advantage of?”
When other advisors see that basic materials are improving, they will blindly go and pick up exposure via XLB or in an equal weight fashion via RSPM. This is our first opportunity to go out and differ ourselves from “the other advisors.” In 2025 alone, the top tracked performer in XLB advanced 172%, a stark contrast to the worst performer which lost more than 42%. What if we could maximize exposure to the strong stocks and avoid allocation towards weak names? To test this idea, we took the tracked holdings of XLB and applied a simple overlay in the custom modeler: Only buy stocks that are “acceptable” by NDW standards, those that earn a TA score of 3 or above. This model, largely due in part to a large Q4 rally, has nearly doubled the performance of broader XLB in 2025 and demonstrates how valuable it can be for you to only focus on those stocks that demonstrate relative strength while others are forced to focus on the entire group. (note: for demonstration purposes we only focused on 2025 in our “backtest”. Note that this strategy decreases diversification and therefore increases observed risk metrics. Selecting fewer stocks may not fit the investment goals for every client.)

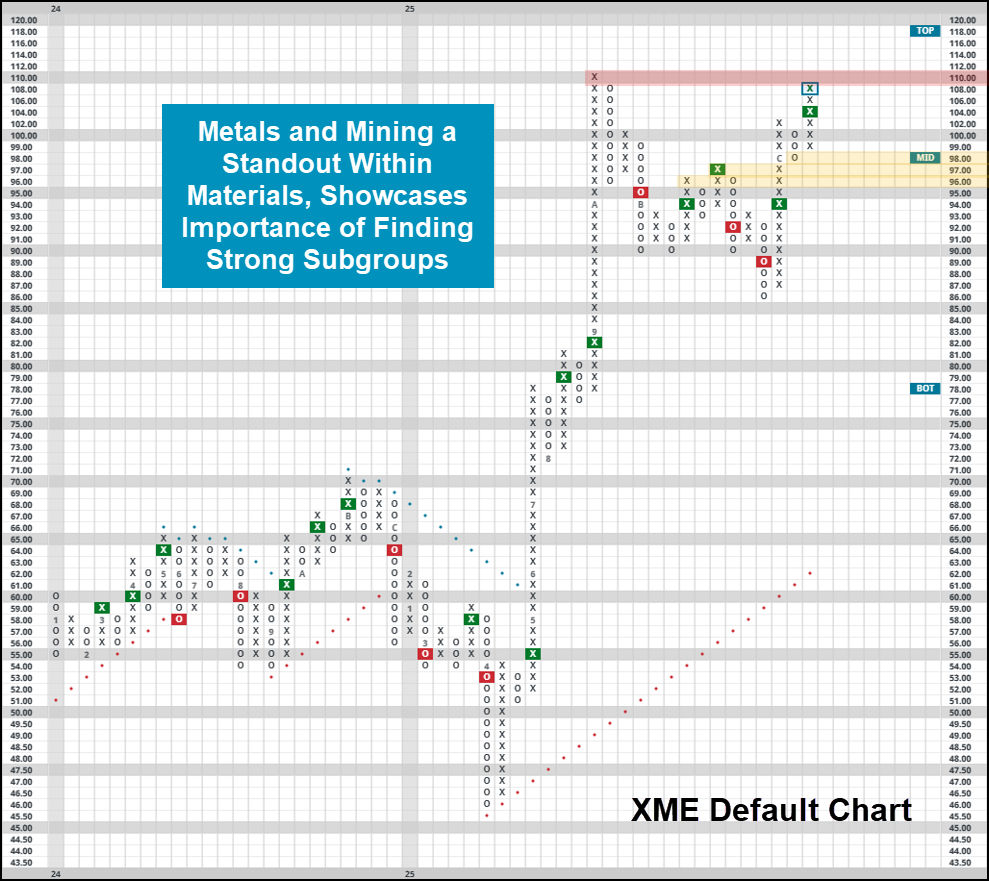
Of course, going out and focusing on a smaller subset of stocks won’t work in every scenario. In others, going out and finding the strong options is just a few clicks away. If basic materials are improving but broader funds like XLB aren’t showing a vast improvement in overall fund score, then the logical deduction is that a smaller subset of top performers must be driving the overall gain in strength. Specifically with basic materials, we know the strength to have come from metals, evidenced by Metals & Mining ETF (XME). It holds a 5.65 fund score, nearly 4 points better than XLB. Point being, by taking just an extra 5 minutes of poking around different subsectors, you can utilize NDW’s fund score system to find out where price is on your side… while others are stuck focusing on broad funds that are dragged down by a select few points of weakness.
Remember, today’s process won’t be prudent in every situation. Sometimes, like in healthcare, points of strength can drastically change the risk profile. Ditching exposure to more traditional drug providers in exchange for high octane biotech names can get dicey quickly. Keep this in mind when considering options outside of your run of the mill sector exposure, and as always keep an eye on the charts to be notified when price changes materially.