More stocks trade on multiple buy signals and less stocks trade on multiple sell signals. Signal consistency is typically what the analyst team will look for when building out of weight of the evidence for names. We explore this idea today.
The act of finding “confirmation” on a PnF chart is sometimes more of an art than a science. If you ask any of the NDW analyst team what exactly makes a stock look strong/weak, all of us will undoubtedly point to the technical attribute system as our main guide… but after that each of us have smaller unique details learned over years of looking at various technical pictures. Some will build a weight of the evidence based on patterns, others will be more reliant on specific relative strength relationships, and some will be based on risk/reward ratios build on ranges of support and resistance points. Regardless, many of us will point to a consistent string of signals in one direction or the next to help act as confirmation of a technical picture. Remember, a “buy” signal occurs when price action moves above a point of old resistance (meaning increased demand) and a sell signal occurs when price action moves below a point of old support (meaning increased supply.)
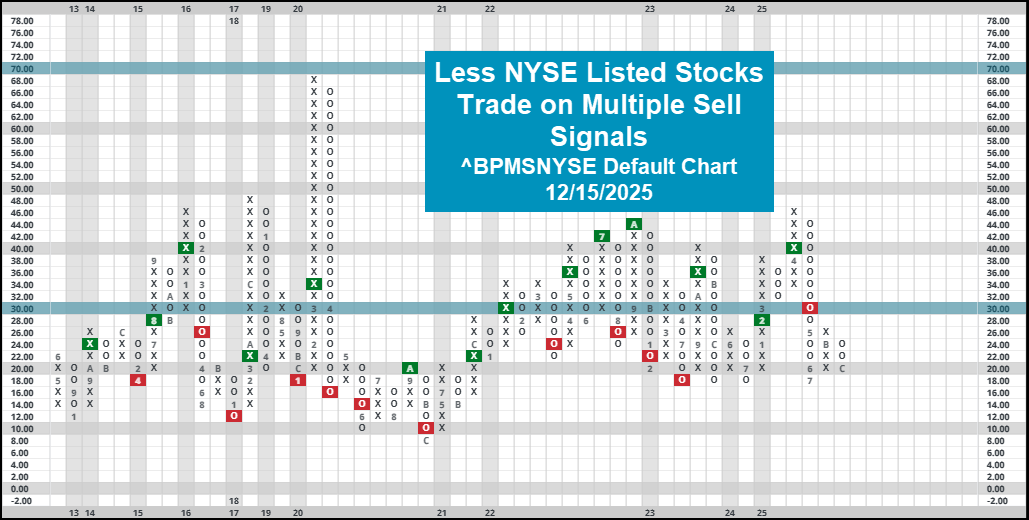
Not every buy signal will be worth taking (likewise for every sell signal…) but the terminology gives us a clue as to who might be in control in the intermediate term…. Buyers or sellers. Remember, the name of the game when judging a technical picture is typically building a weight of the evidence- judging the strength of demand can help us predict where a name might be heading over our investment horizon. Most of the analyst team will look to see multiple signals of the same type to help confirm that price action is consistent. To zoom out (and save a lot of time…) we can utilize indicators to help us gauge the overall technical picture of many different stocks. ^BPMSNYSE & ^BPMBNYSE measure the percentage of NYSE listed stocks trading on multiple sell signals and multiple buy signals, respectively. Included below is the default chart for ^BPMSNYSE, which reveals that now only 20% of the NYSE is trading on multiple sell signals after reversing down last Friday. This is mostly due to an uptick in small & mid cap performance/participation, a topic discussed more in today’s featured article. Roughly 26% of the universe trades on multiple buy signals.
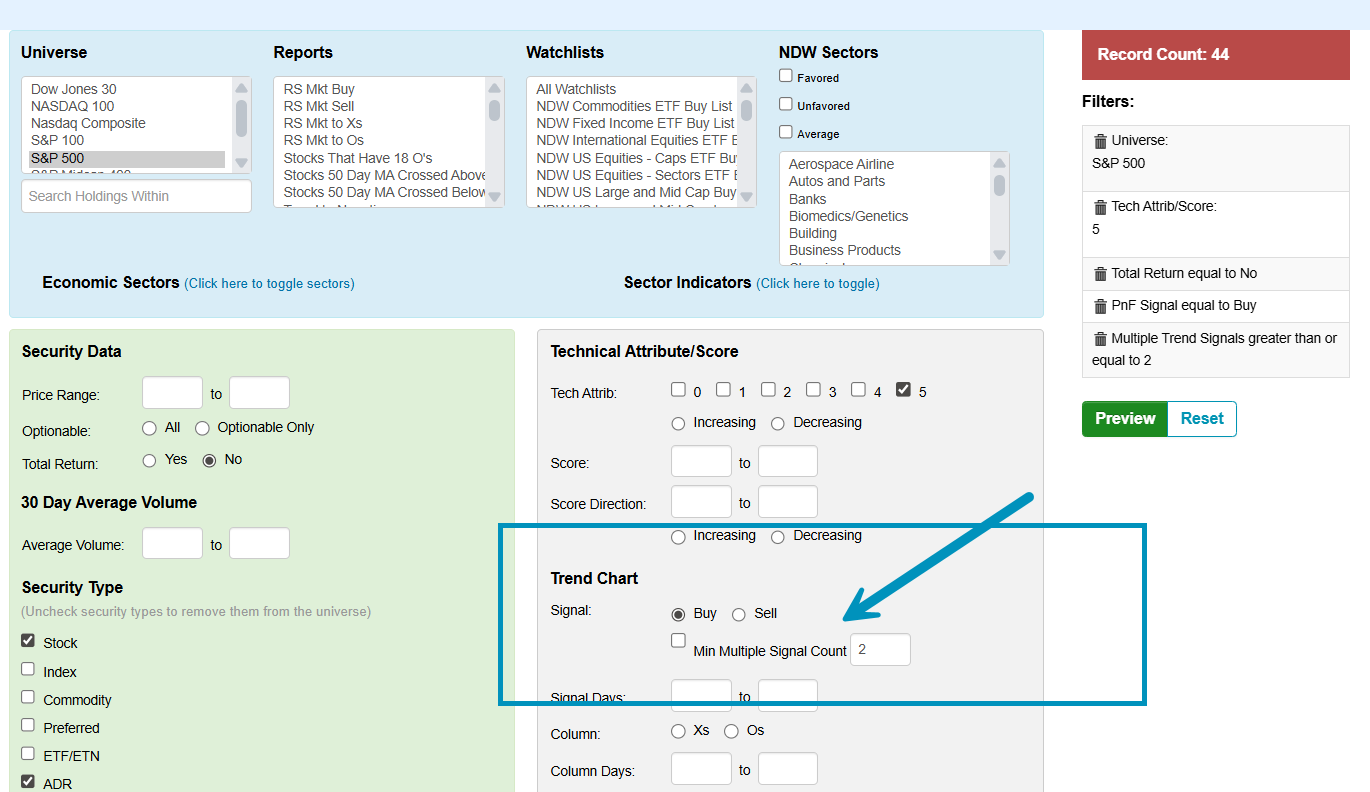
You are able to go and screen through different universes in NDW’s security screener and select stocks that are trading on multiple signals. Below is a screenshot of the screener tool (note you can also run this exact screen in the new, screener beta version) that highlights the 44 different S&P 500 stocks trading on a pair of buy signals that also hold a perfect 5/5 TA score. It is worth noting that prudent screens won’t rely solely on what signal a stock is currently trading on, but applying buy signal criteria can be a useful qualifier to help thin down a larger list of strong options you’re looking to choose from.