Most Requested Symbols

We review the performance tendencies of major domestic equity indices after reaching new all-time highs and highlight some bullish opportunities that could arise from further improvement in small caps.
The curve has an average reading of 47.11%.
Today's featured stock is Fluor Corporation (FLR).
Comments include: AVGO, CLH, DDS, HLT, MSS, RRC, SNOW, USFD, and WMT.
Call: Meta Platforms (META); Put: Freeport McMoRan Inc (FCX); Covered Write: Guess Inc (GES).
NDW Morning Update Video - December 12, 2023
NDW Morning Update Video – December 12, 2023.
Click here to download MP3
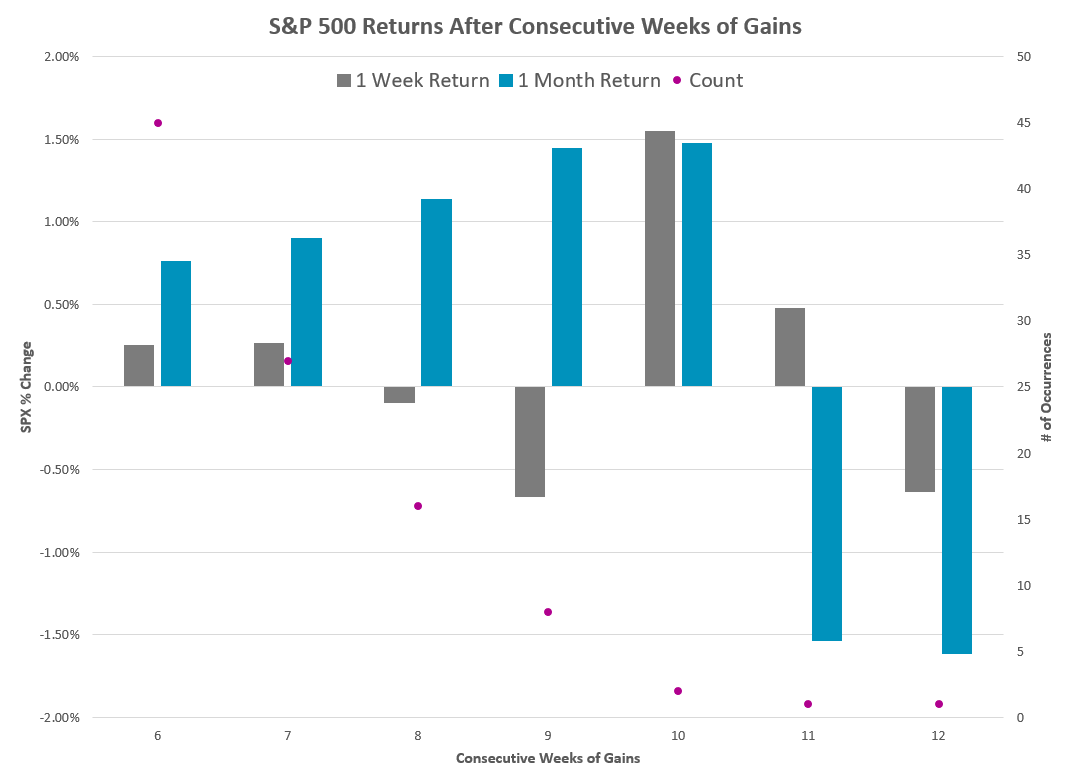
Last Friday (12/8), the S&P 500 (SPX) posted its sixth consecutive weekly gain…which is surprisingly rare. The last time SPX advanced for six straight weeks was at the end of 2019. Since 1958, SPX has gone on a six-week win streak just 44 other times (that’s about a 1.3% hit rate). The longest stretch of consecutive weekly gains ended at 12 in December 1985.
The bar chart below visualizes some of the above statistics.

So, what can we say about the present six-week win streak other than it is rare?
The current win streak comes at an interesting time given the slew of economic data expected this week. November CPI comes out tomorrow (12/12) followed by PPI on Wednesday (12/13); we then get November retail sales numbers on Thursday (12/14). There are also notable earnings releases this week including ORCL today, ADBE on Wednesday, and COST and LEN on Thursday. Although, likely the most important item on the agenda is the Fed meeting which wraps up on Wednesday. The Fed futures market is currently pricing in around a 98% chance of no hike.

Domestic equities continue to see broad-based improvement, with the S&P 500 Index inching closer to a new all-time high. This is depicted on the 1% trend chart for SPX, which can be accessed by changing the chart settings directly above the default point & figure chart. The Percent Trend charts still portray the absolute technical picture for the S&P 500, but simply show those changes using a defined percentage difference in the boxes (1% in our case), rather than a defined point difference to add boxes. This means that the S&P 500 Index needs to advance 1% to add another box on this chart, or we would need to see a 3% decline to change columns into Os. This charting method can be helpful to normalize the changes across different timeframes, potentially leading to a more consistent technical picture.
The 1% trend chart for SPX sits in a positive trend, on a buy signal, and in a column of Xs, just like the default chart. Monday’s movement saw this chart of SPX push higher, surpassing the July rally high to breach 4618 and mark the first X added in December. This leaves the chart at the same level we topped out at during the March 2022 rally. We are also just four boxes shy of matching the December 2021 chart high, so we are only about 4% away from a new all-time high. The extended rally we have seen over the past few weeks has left this chart on a notable stem, with initial support not seen until around the 4140 level, which also corresponds to the current position of the bullish support line. It is worth noting that this trend line has proven to serve as important support since this chart moved back to a positive trend in December 2022, holding during the retractions in March and October of this year.

So how does the S&P 500 Index typically perform after reaching a new all-time high? There have been 603 trading days since 1927 that have seen the S&P 500 Index close at a new all-time high, which equates to just over 2% of the total market days. Out of those days, only 102 have seen SPX close at a new ATH after spending at least one month between highs. We are currently at 704 days since the last high was reached on January 3, 2022, so not quite 2 years. That is the seventh-longest stretch between all-time highs we have seen since 1927. Some periods have been much longer; there was a 25-year stretch from 1929 through 1954, over 7 years from 1973 – 1980 and 2000 – 2007, then over 5 years from 2007 – 2013. Most of those prior extended periods saw further improvement for the S&P 500 Index after a new all-time high was reached. Forward SPX returns suggest that some near-term consolidation could be seen after a new high, with the 1-week and 1-month forward averages slightly lower than the average from any day. However, those averages expand significantly once we get 3-months out from each instance. Only the fresh all-time high reached in May 2007 saw negative movement 6-months and 1-year afterwords.
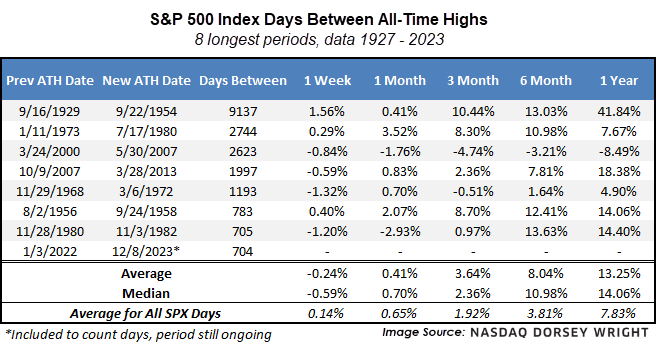
These averages suggest that seeing the S&P 500 Index move to a new all-time high could serve as a further bullish narrative into next year. The sharp rally seen from SPX has left the index in an overbought posture, with a weekly overbought/oversold reading north of 77% based on the market action through Monday. The 1% trend chart would see a reversal lower with a potential move below 4482. We could see the trading band normalize either from a pullback or simply from having SPX remain at or near the current level for a prolonged period.
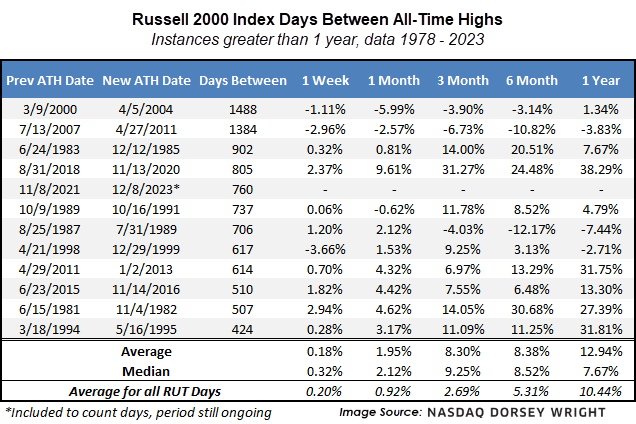
Other areas of the domestic equity market have not seen the same level of improvement as the large-cap-focused benchmarks. This has been most apparent in the underperformance of the Russell 2000 Index RUT, which still sits about 30% away from its all-time high. Our data for the Russell 2000 Index only goes back to 1978, but we are currently in the fifth-longest period without a new all-time high in the small-cap benchmark at 760 days since the last high on November 8, 2021.
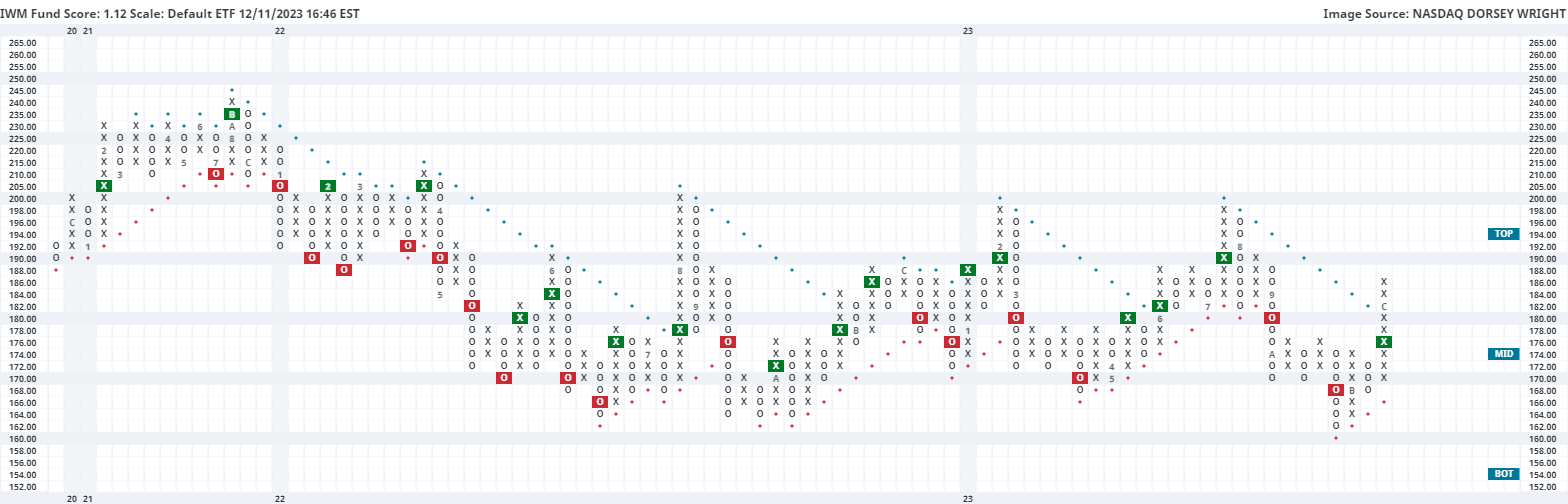
While small-cap benchmarks have continued to trail in performance, we have seen notable improvement over the past few weeks. The S&P 500 and the Russell 2000 reached their near-term bottoms on October 27, 2023. Since that time, the SPX has risen about 12%, while RUT has climbed almost 15%. Even with that sharp rally, the default chart of the iShares Russell 2000 ETF IWM is not on as significant of a stem, sitting at about 60% overbought. We saw the fund return to a positive trend at the beginning of the month after breaking a spread triple top at $178 just a few weeks beforehand. It would be ideal to see further improvement from small caps to help expand the breadth of domestic equities heading into next year. Initial support can be seen at $168, which is also the current location of the bullish support line. Further support can be seen at $162 from the October low. Initial resistance may be seen at $190 with strong resistance seen at $198.
Average Level
47.11
| < - -100 | -100 - -80 | -80 - -60 | -60 - -40 | -40 - -20 | -20 - 0 | 0 - 20 | 20 - 40 | 40 - 60 | 60 - 80 | 80 - 100 | 100 - > |
|---|---|---|---|---|---|---|---|---|---|---|---|
|
Buy signalvoog
|
|||||||||||
|
Sell signalijh
|
|||||||||||
|
Buy signalijr
|
|||||||||||
|
Buy signalXLG
|
|||||||||||
|
Sell signaldvy
|
|||||||||||
|
Buy signalief
|
|||||||||||
|
Buy signaloneq
|
|||||||||||
|
Buy signalicf
|
|||||||||||
|
Sell signalefa
|
|||||||||||
|
Sell signalRSP
|
|||||||||||
|
Buy signaltlt
|
|||||||||||
|
Buy signalshy
|
Buy signalspy
|
||||||||||
|
Buy signalgsg
|
Sell signaleem
|
Buy signaliwm
|
Buy signalhyg
|
Buy signallqd
|
|||||||
|
Sell signalUSO
|
Sell signalgcc
|
Sell signaldx/y
|
Sell signalfxe
|
Buy signalGLD
|
Buy signalQQQ
|
Buy signalagg
|
Buy signalVOOV
|
Buy signaldia
|
|||
| < - -100 | -100 - -80 | -80 - -60 | -60 - -40 | -40 - -20 | -20 - 0 | 0 - 20 | 20 - 40 | 40 - 60 | 60 - 80 | 80 - 100 | 100 - > |
| AGG | iShares US Core Bond ETF |
| USO | United States Oil Fund |
| DIA | SPDR Dow Jones Industrial Average ETF |
| DVY | iShares Dow Jones Select Dividend Index ETF |
| DX/Y | NYCE U.S.Dollar Index Spot |
| EFA | iShares MSCI EAFE ETF |
| FXE | Invesco CurrencyShares Euro Trust |
| GLD | SPDR Gold Trust |
| GSG | iShares S&P GSCI Commodity-Indexed Trust |
| HYG | iShares iBoxx $ High Yield Corporate Bond ETF |
| ICF | iShares Cohen & Steers Realty ETF |
| IEF | iShares Barclays 7-10 Yr. Tres. Bond ETF |
| LQD | iShares iBoxx $ Investment Grade Corp. Bond ETF |
| IJH | iShares S&P 400 MidCap Index Fund |
| ONEQ | Fidelity Nasdaq Composite Index Track |
| QQQ | Invesco QQQ Trust |
| RSP | Invesco S&P 500 Equal Weight ETF |
| IWM | iShares Russell 2000 Index ETF |
| SHY | iShares Barclays 1-3 Year Tres. Bond ETF |
| IJR | iShares S&P 600 SmallCap Index Fund |
| SPY | SPDR S&P 500 Index ETF Trust |
| TLT | iShares Barclays 20+ Year Treasury Bond ETF |
| GCC | WisdomTree Continuous Commodity Index Fund |
| VOOG | Vanguard S&P 500 Growth ETF |
| VOOV | Vanguard S&P 500 Value ETF |
| EEM | iShares MSCI Emerging Markets ETF |
| XLG | Invesco S&P 500 Top 50 ETF |

| Symbol | Company | Sector | Current Price | Action Price | Target | Stop | Notes |
|---|---|---|---|---|---|---|---|
| GPK | Graphic Packaging Intl. | Forest Prods/Paper | $23.30 | 21 - 23 | 26 | 18 | #6 of 12 in favored FORE sector matrix, LT pos mkt RS, triple top, 1.3% yield |
| AIG | American International Group, Inc. | Insurance | $65.53 | hi 50s - low 60s | 68 | 52 | 4 for 5'er, top half of INSU sector matrix, LT pos mkt RS, multiple consec buy signals, 2.35% yield |
| COCO | Vita Coco Company, Inc. | Food Beverages/Soap | $27.20 | mid 20s | 36 | 23 | 4 for 5'er, top decile of FOOD sector matrix, multi consec buy signals, pullback from ATH |
| KRG | Kite Realty Group Trust | Real Estate | $22.00 | 19 - 21 | 34.50 | 16 | 5 for 5'er, 11 of 113 in REAL sector matrix, LT pos mkt RS, spread quintuple top, 4.65% yield |
| IONS | Ionis Pharmaceuticals Inc. | Biomedics/Genetics | $48.69 | 42 - hi 40s | 64 | 38 | 5 TA rating, top decile of BIOM matrix, consec. buy signals, LT RS buy |
| AXON | Axon Enterprise Inc. | Protection Safety Equipment | $236.38 | mid 200s - mid 220s | 278 | 174 | 5 TA rating, higher lows, pullback from rally high, pos. wkly mom. |
| BG | Bunge Limited | Food Beverages/Soap | $104.50 | lo 100s - mid 110s. | 169 | 89 | 5 TA rating, top decile of FOOD sector matrix, consec. buy signals, LT mkt RS pos., R-R > 3 |
| FDX | FedEx Corporation | Aerospace Airline | $272.21 | lo 230s - mid 250s | 364 | 190 | 4 TA rating, top 25% of AERO sector matrix, shakeout buy point, positive mkt RS, R-R > 2, Earn. 12/19 |
| OKE | ONEOK, Inc. | Gas Utilities | $68.24 | low-to-mid 60s | 89 | 55 | 5 for 5'er, top third of GUTI sector matrix, triple top, pullback to oversold, R-R>2.0, 5.8% yield |
| CME | CME Group, Inc. | Wall Street | $211.62 | 200s - mid 210s | 272 | 174 | 4 for 5'er, #5 of 32 in WALL sector matrix, one box from market RS buy, 2% yield |
| ORCL | Oracle Corporation | Software | $113.61 | mid 100s - mid 110s | 138 | 96 | 5 for 5'er, top half of SOFT sector matrix, LT pos mkt RS, trend chart signal flip, 1.5% yield |
| CDW | CDW Corp. | Computers | $213.19 | 200 - 220 | 278 | 184 | 4 for 5'er, top third of COMP sector matrix, LT pos mkt RS, triple top, 1.1% yield |
| CNC | Centene Corporation | Healthcare | $73.77 | hi 60s - hi 70s | 98 | 60 | 5 TA rating, top quintile of healthcare sector matrix, consec. buy signals, LT mkt RS buy |
| ABCB | Ameris Bancorp | Banks | $47.00 | low 40s | 57 | 34 | 4 for 5'er, top quartile of BANK sector matrix, pos trend flip, 1.4% yield |
| AEO | American Eagle Outfitters, Inc. | Retailing | $20.17 | 16 - 19.50 | 33 | 14 | 5 TA rating, top quintile of RETA sector matrix, consec. buy signals, R-R > 3.5. |
| AMZN | Amazon.com Inc. | Internet | $147.42 | 140 - lo 150s | 200 | 118 | 4 TA rating, top 25% of INET sector matrix, consec. buy signals, LT pos trend |
| SBUX | Starbucks Corporation | Restaurants | $96.61 | mid 90s - mid 100s | 137 | 82 | 4 TA rating, top 33% of REST sector matrix, LT RS buy, buy-on-pullback, R-R > 2 |
| MOD | Modine Manufacturing Company | Autos and Parts | $53.36 | 50 - 54 | 77 | 38 | 4 for 5'er, new ATH, pos. trend since 7/22, top quartile of Autos Sector Matrix. |
| WH | Wyndham Hotels & Resorts Inc | Leisure | $78.32 | low 70s - low 80s | 103 | 65 | 4 TA rating, top quartile of leisure sector matrix, consec. buy signals, LT RS buy, R-R > 2. |
| URI | United Rentals, Inc. | Machinery and Tools | $495.06 | 450s - lo 500s | 692 | 384 | 5 TA rating, pos. trend, consec. buys, LT mkt RS buy, R-R > 2 |
| DELL | Dell Technologies Inc Class C | Computers | $68.70 | mid 60s - lo 70s | 101 | 52 | 5 TA rating, top 20% of COMP sector matrix, buy-on-pullback, R-R > 2 |
| ORLY | O'Reilly Automotive, Inc. | Autos and Parts | $945.88 | 912 - 992 | 1264 | 792 | 5 for 5'er, Mkt. RS Buy since 9/2002, Peer RS Buy since 8/2011, Pullback from Recent ATH. |
| FLR | Fluor Corporation | Building | $38.17 | hi 30s | 49 | 32 | 4 for 5'er, top half of favored BUIL sector matrix, spread quad top breakout |
| Symbol | Company | Sector | Current Price | Action Price | Target | Stop | Notes |
|---|
| Symbol | Company | Sector | Current Price | Action Price | Target | Stop | Notes |
|---|---|---|---|---|---|---|---|
| NVO | Novo Nordisk A/S (Denmark) ADR | Drugs | $96.64 | high-90s to high-100s | 121 | 86 | NVO fell to a sell signal Monday. OK to hold here. Maintain $86 stop. |
| Comment | |||||||
|---|---|---|---|---|---|---|---|
|
|
|||||||
FLR Fluor Corporation R ($38.77) - Building - FLR is a 4 for 5'er that ranks in the top half of the favored building sector matrix. On its default chart the stock has completed two consecutive buy signals, most recently breaking a spread quadruple top at $39 that took out resistance dating back to March. Long exposure may be added in the upper $30s and we will set our initial stop at $32, a potential spread triple bottom break on FLR's default chart. We will use the bullish price objective, $49, as our target price.
| 21 | 22 | 23 | ||||||||||||||||||||||||||||||||||||||||||||||||||
| 43.00 | Top | 43.00 | ||||||||||||||||||||||||||||||||||||||||||||||||||
| 42.00 | 42.00 | |||||||||||||||||||||||||||||||||||||||||||||||||||
| 41.00 | 41.00 | |||||||||||||||||||||||||||||||||||||||||||||||||||
| 40.00 | 40.00 | |||||||||||||||||||||||||||||||||||||||||||||||||||
| 39.00 | C | 39.00 | ||||||||||||||||||||||||||||||||||||||||||||||||||
| 38.00 | 3 | X | X | X | 38.00 | |||||||||||||||||||||||||||||||||||||||||||||||
| 37.00 | X | O | X | X | O | X | O | X | 37.00 | |||||||||||||||||||||||||||||||||||||||||||
| 36.00 | X | X | O | X | O | 9 | O | B | O | X | Mid | 36.00 | ||||||||||||||||||||||||||||||||||||||||
| 35.00 | C | O | X | O | X | O | X | A | X | O | 35.00 | |||||||||||||||||||||||||||||||||||||||||
| 34.00 | X | O | X | O | X | O | X | O | X | 34.00 | ||||||||||||||||||||||||||||||||||||||||||
| 33.00 | X | O | X | O | X | O | O | 33.00 | ||||||||||||||||||||||||||||||||||||||||||||
| 32.00 | X | 1 | O | 8 | 32.00 | |||||||||||||||||||||||||||||||||||||||||||||||
| 31.00 | 4 | B | O | 7 | 31.00 | |||||||||||||||||||||||||||||||||||||||||||||||
| 30.00 | X | O | X | O | X | 30.00 | ||||||||||||||||||||||||||||||||||||||||||||||
| 29.00 | X | O | 6 | X | X | O | 6 | • | Bot | 29.00 | ||||||||||||||||||||||||||||||||||||||||||
| 28.00 | X | O | 5 | O | X | X | O | X | 5 | X | • | 28.00 | ||||||||||||||||||||||||||||||||||||||||
| 27.00 | X | O | X | O | 8 | O | A | O | X | O | X | • | 27.00 | |||||||||||||||||||||||||||||||||||||||
| 26.00 | • | X | O | X | O | X | O | X | O | O | • | 26.00 | ||||||||||||||||||||||||||||||||||||||||
| 25.00 | X | • | C | X | O | O | X | 9 | X | • | 25.00 | |||||||||||||||||||||||||||||||||||||||||
| 24.00 | X | 5 | O | • | X | O | X | O | X | O | • | 24.00 | ||||||||||||||||||||||||||||||||||||||||
| 23.00 | X | O | X | O | • | X | O | 3 | O | X | • | 23.00 | ||||||||||||||||||||||||||||||||||||||||
| 22.00 | X | O | X | O | • | X | 1 | X | 7 | • | 22.00 | |||||||||||||||||||||||||||||||||||||||||
| 21.00 | X | X | X | O | X | O | • | X | O | X | • | 21.00 | ||||||||||||||||||||||||||||||||||||||||
| 20.00 | X | O | X | X | O | X | O | X | O | X | • | B | O | • | 20.00 | |||||||||||||||||||||||||||||||||||||
| 19.50 | • | X | O | X | O | X | X | O | X | O | X | O | 6 | O | • | X | • | 19.50 | ||||||||||||||||||||||||||||||||||
| 19.00 | • | X | O | X | X | O | X | O | X | O | X | O | O | X | O | X | • | X | • | 19.00 | ||||||||||||||||||||||||||||||||
| 18.50 | C | X | O | X | O | 2 | O | X | O | X | O | X | X | O | X | O | X | O | • | X | • | 18.50 | ||||||||||||||||||||||||||||||
| 18.00 | X | O | X | O | X | O | X | O | X | O | O | 3 | O | X | O | X | O | X | O | X | • | X | • | 18.00 | ||||||||||||||||||||||||||||
| 17.50 | X | O | 1 | O | O | X | O | X | O | X | O | X | O | • | O | X | O | 8 | O | • | A | • | 17.50 | |||||||||||||||||||||||||||||
| 17.00 | X | O | X | O | O | X | O | X | O | • | • | O | 7 | X | X | O | X | X | • | 17.00 | ||||||||||||||||||||||||||||||||
| 16.50 | X | O | X | O | O | • | O | X | O | X | O | X | O | X | • | 16.50 | ||||||||||||||||||||||||||||||||||||
| 16.00 | X | O | • | O | X | O | X | O | X | O | X | • | 16.00 | |||||||||||||||||||||||||||||||||||||||
| 15.50 | X | • | O | O | X | O | 9 | X | • | 15.50 | ||||||||||||||||||||||||||||||||||||||||||
| 15.00 | X | • | O | O | X | • | 15.00 | |||||||||||||||||||||||||||||||||||||||||||||
| 14.50 | X | • | O | • | 14.50 | |||||||||||||||||||||||||||||||||||||||||||||||
| 14.00 | X | • | • | 14.00 | ||||||||||||||||||||||||||||||||||||||||||||||||
| 13.50 | X | • | 13.50 | |||||||||||||||||||||||||||||||||||||||||||||||||
| 13.00 | • | 13.00 | ||||||||||||||||||||||||||||||||||||||||||||||||||
| 21 | 22 | 23 |
| AVGO Broadcom Ltd ($1,029.24) - Semiconductors - AVGO moved higher Monday to break a double top at $1008 before climbing over 9% intraday to reach $1024. This 5 for 5'er moved to a positive trend in November 2022 and sits in the top decile of the semiconductors sector RS matrix. The weight of the technical evidence is favorable and improving. However, AVGO is entering overbought territory. Those looking to add exposure may be best served waiting for a pullback or normalization of the trading band. Initial support may be seen at $912 with further support seen at $832 and $800. |
| CLH Clean Harbors Inc ($172.84) - Waste Management - CLH broke a third consecutive buy signal today, having put in a nice stair-stepping formation on its default chart. This perfect 5/5'er has put in a productive 2023 campaign, advancing over 50% at the time of this writing. While there is a wide array of resistance above current levels, the overall picture is strong here. Keep an eye on nearby support at $164. |
| DDS Dillard's, Inc. ($381.58) - Retailing - DDS broke a double top at $376 for a second buy signal since November as it rallied to $380, matching the August rally high. The stock is a 5 for 5'er that ranks in the top quartile of the Retailing sector matrix. From here, a move to $384 would mark this highest level on the chart since February. Initial support lies at $360, while additional can be found at $316 and $304, the bullish support line. |
| HLT Hilton Worldwide Holdings Inc ($177.29) - Leisure -HLT reversed back into Xs and broke a double top at $176 as the stock rallied to a new all-time high at $178. The stock is a 5 for 5'er that ranks in the top quartile of the Leisure sector matrix. HLT will again visit overbought territory, so those seeking exposure may look for a pullback to $172 on the chart before adding. Support lies in the $166 to $168 range, while the bullish support line lies at $156. |
| KSS Kohl's Corporation ($26.36) - Retailing - KSS broke a double top at $26 for a second buy signal since November. This follows a positive trend reversal last month which brought KSS up to a 3 for 5'er. The stock maintains positive near-term RS versus the market and its peer group while ranking in the top half of the Retailing sector matrix and having a current yield north of 8%. Resistance lies in the upper $20s. Support lies in the $22 to $20 range. |
| MSS Maison Solutions Inc. Class A ($14.82) - Retailing - MSS broke a triple top at $15 to complete a shakeout pattern and return the stock to a buy signal. The stock is a 5 for 5'er that has maintained positive near-term and long-term RS since November. Resistance lies at $16, while the stock's chart high from last month lies at $22. Support lies at $11.50 and $11, the bullish support line. |
| RRC Range Resources Corp ($29.78) - Oil - RRC fell to a sell signal Monday when it broke a double bottom $29, where it is now testing its bullish support line; a move to $28 would violated RRC's trend line and drop it to a 2 for 5'er. |
| SNOW Snowflake, Inc. Class A ($192.99) - Software - SNOW rose Monday to break a double top at $192, marking a fourth consecutive buy signal and a new 52-week high. This 3 for 5'er moved to a positive trend in November and just reversed back up into X's on its market RS chart. The weight of the technical evidence is improving, however, SNOW is in overbought territory. Those looking to add exposure may be best served waiting for a pullback or normalization of the trading band. Initial support can be seen at $184 with further support offered at $182. |
| USFD US Foods Holding Corp. ($44.99) - Food Beverages/Soap - Shares of USFD printed a third consecutive buy signal on Monday at $45, a fresh all-time high. The 5 for 5'er ranks in the top decile of the food beverages/soap stock sector matrix and continues to trade well-above its bullish support line. Weight of the evidence is positive. Enter with partial positions due to near-term overbought readings. Note that initial support levels are distant. |
| WMT Walmart Inc. ($150.89) - Retailing - WMT broke a double bottom at $150, bringing the stock to a sell signal and violating the bullish support line. This will drop WMT to a 3 for 5'er trading in a negative trend, and this action follows the stock moving into a column of Os on the peer RS chart earlier this month. Initial support now lies at $146, while additional support can be found at $138, the March chart low. |

| Name | Option Symbol | Action | Stop Loss |
|---|---|---|---|
| Meta Platform Inc. - $324.51 | O: 24C320.00D15 | Buy the March 320.00 calls at 27.85 | 312.00 |
| Name | Option | Action |
|---|---|---|
| T-Mobile US Inc. ( TMUS) | Feb. 145.00 Calls | Raise the option stop loss to 14.45 (CP: 16.45) |
| Tesla Inc. ( TSLA) | Mar. 240.00 Calls | Stopped at 24.90 (CP: 24.35) |
| Walmart Inc. ( WMT) | Mar. 155.00 Calls | Stopped at 150.00 (CP: 155.73) |
| Broadcom Ltd ( AVGO) | Mar. 920.00 Calls | Raise the option stop loss to 140.00 (CP: 143.80) |
| Name | Option Symbol | Action | Stop Loss |
|---|---|---|---|
| Freeport-McMoRan Inc. - $37.82 | O: 24Q38.00D17 | Buy the May 38.00 puts at 3.70 | 42.00 |
| Name | Option | Action |
|---|---|---|
| Johnson & Johnson (JNJ) | Mar. 155.00 Puts | Initiate an option stop loss of 2.75 (CP: 4.75) |
| Name | Option Sym. | Call to Sell | Call Price | Investment for 500 Shares | Annual Called Rtn. | Annual Static Rtn. | Downside Protection |
|---|---|---|---|---|---|---|---|
| Guess Inc. $22.07 | O: 24C23.00D15 | Mar. 23.00 | 10,505.35 | $10,505.35 | 32.28% | 25.77% | 6.29% |
| Name | Action |
|---|---|
| Amazon.com Inc. (AMZN) - 147.42 | Sell the March 150.00 Calls. |
| Dexcom Inc. (DXCM) - 116.97 | Sell the March 120.00 Calls. |
| Airbnb, Inc. Class A (ABNB) - 140.68 | Sell the March 150.00 Calls. |
| Name | Covered Write |
|---|---|
| Expedia Group Inc. ( EXPE - 145.50 ) | March 145.00 covered write. |
| Advanced Micro Devices, Inc. ( AMD - 128.92 ) | March 125.00 covered write. |
| Intel Corporation ( INTC - 42.70 ) | March 43.00 covered write. |
Daily Equity & Market Analysis
Loading, Please Wait...
