We review the performance tendencies of major domestic equity indices after reaching new all-time highs and highlight some bullish opportunities that could arise from further improvement in small caps.
Domestic equities continue to see broad-based improvement, with the S&P 500 Index inching closer to a new all-time high. This is depicted on the 1% trend chart for SPX, which can be accessed by changing the chart settings directly above the default point & figure chart. The Percent Trend charts still portray the absolute technical picture for the S&P 500, but simply show those changes using a defined percentage difference in the boxes (1% in our case), rather than a defined point difference to add boxes. This means that the S&P 500 Index needs to advance 1% to add another box on this chart, or we would need to see a 3% decline to change columns into Os. This charting method can be helpful to normalize the changes across different timeframes, potentially leading to a more consistent technical picture.
The 1% trend chart for SPX sits in a positive trend, on a buy signal, and in a column of Xs, just like the default chart. Monday’s movement saw this chart of SPX push higher, surpassing the July rally high to breach 4618 and mark the first X added in December. This leaves the chart at the same level we topped out at during the March 2022 rally. We are also just four boxes shy of matching the December 2021 chart high, so we are only about 4% away from a new all-time high. The extended rally we have seen over the past few weeks has left this chart on a notable stem, with initial support not seen until around the 4140 level, which also corresponds to the current position of the bullish support line. It is worth noting that this trend line has proven to serve as important support since this chart moved back to a positive trend in December 2022, holding during the retractions in March and October of this year.

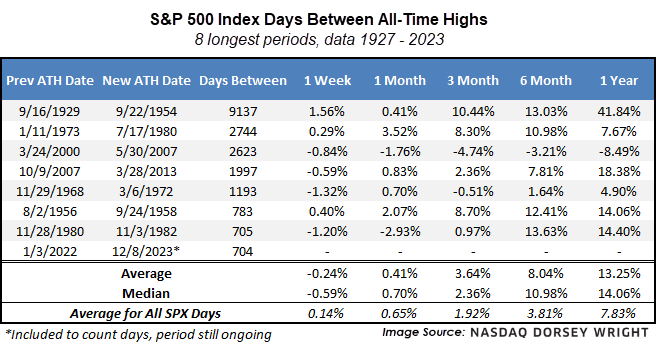
So how does the S&P 500 Index typically perform after reaching a new all-time high? There have been 603 trading days since 1927 that have seen the S&P 500 Index close at a new all-time high, which equates to just over 2% of the total market days. Out of those days, only 102 have seen SPX close at a new ATH after spending at least one month between highs. We are currently at 704 days since the last high was reached on January 3, 2022, so not quite 2 years. That is the seventh-longest stretch between all-time highs we have seen since 1927. Some periods have been much longer; there was a 25-year stretch from 1929 through 1954, over 7 years from 1973 – 1980 and 2000 – 2007, then over 5 years from 2007 – 2013. Most of those prior extended periods saw further improvement for the S&P 500 Index after a new all-time high was reached. Forward SPX returns suggest that some near-term consolidation could be seen after a new high, with the 1-week and 1-month forward averages slightly lower than the average from any day. However, those averages expand significantly once we get 3-months out from each instance. Only the fresh all-time high reached in May 2007 saw negative movement 6-months and 1-year afterwords.
These averages suggest that seeing the S&P 500 Index move to a new all-time high could serve as a further bullish narrative into next year. The sharp rally seen from SPX has left the index in an overbought posture, with a weekly overbought/oversold reading north of 77% based on the market action through Monday. The 1% trend chart would see a reversal lower with a potential move below 4482. We could see the trading band normalize either from a pullback or simply from having SPX remain at or near the current level for a prolonged period.
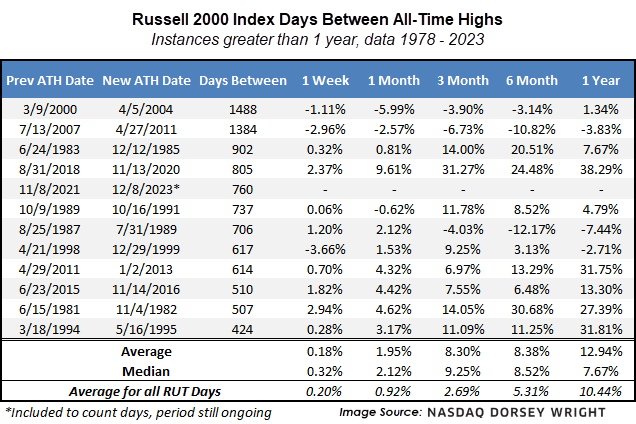
Other areas of the domestic equity market have not seen the same level of improvement as the large-cap-focused benchmarks. This has been most apparent in the underperformance of the Russell 2000 Index RUT, which still sits about 30% away from its all-time high. Our data for the Russell 2000 Index only goes back to 1978, but we are currently in the fifth-longest period without a new all-time high in the small-cap benchmark at 760 days since the last high on November 8, 2021.
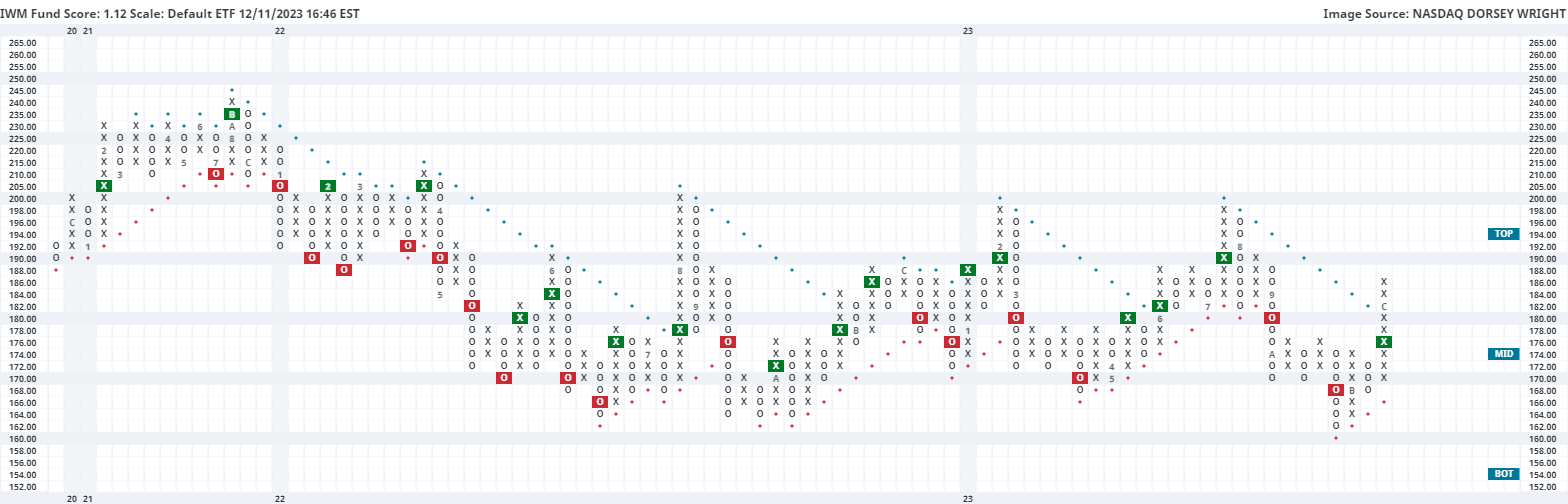
While small-cap benchmarks have continued to trail in performance, we have seen notable improvement over the past few weeks. The S&P 500 and the Russell 2000 reached their near-term bottoms on October 27, 2023. Since that time, the SPX has risen about 12%, while RUT has climbed almost 15%. Even with that sharp rally, the default chart of the iShares Russell 2000 ETF IWM is not on as significant of a stem, sitting at about 60% overbought. We saw the fund return to a positive trend at the beginning of the month after breaking a spread triple top at $178 just a few weeks beforehand. It would be ideal to see further improvement from small caps to help expand the breadth of domestic equities heading into next year. Initial support can be seen at $168, which is also the current location of the bullish support line. Further support can be seen at $162 from the October low. Initial resistance may be seen at $190 with strong resistance seen at $198.