Like July, August has historically been a strong summer month for equities; however, there have been some historic market declines and volatility has typically been higher.
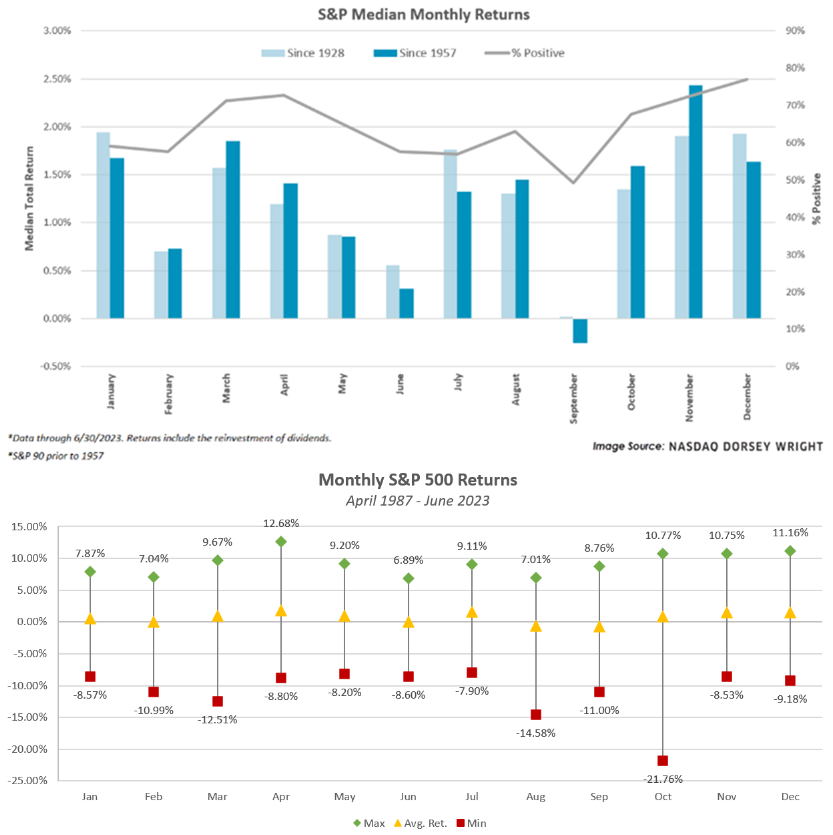
Today marked the last trading day in July. As discussed at the end of June, July has a seasonal tendency to usher positive returns for the market and this year turned out to follow said tendency. We saw positive performance across the equity benchmarks; for example, the Russell 2000 (RUT) added about 5%, the Nasdaq Composite (NASD) gained 4%, and the S&P 500 (SPX) advanced roughly 3%. Note that since 1957 the median SPX return for July was 1.3%, meaning this year’s performance was well above the “typical” July.
As for the coming month, August, median equity returns have also been positive; in fact, August has a better hit rate than July. Since 1957, SPX has posted a gain in August 63% of the time which is higher than July’s batting average of 57%. Although August returns have leaned positive in the past, volatility has historically picked up as evident on our VIX progression chart at the bottom of this report. This uptick in volatility is perhaps further evidenced by the average August return, which is significantly lower than July. The average return in August for SPX since 1957 is just 0.5%, much lower than the 1.5% median, and more than 50% off July’s average return of 1.2%. The August average is pulled down by some notable market meltdowns: the 14% crash in 1998, the 9% decline in 1990 and 1974, and more recently, the 6% pullback in 2015.
When talking about August returns it is difficult not to jump to September, commonly known as the worst month of the year for equities. However, we will not get ahead of ourselves today, and in the hope of enjoying August which tends to be a positive month. When we are closer to September, we will certainly dedicate several pieces to the feared month.