Most Requested Symbols

Last chance to lock in early-bird pricing for a 33% discount!
Inflation, the market’s biggest worry in 2022, has steadily fallen since its peak led most notably by a major fall in energy prices. Recent developments have put this steady decline in jeopardy, and it appears inflation will not go down without a fight.
The average distribution level is 42.51%.
Hancock Whitney Corp. (HWC).
ADM, DDOG, LYB, PHM, PVH, RTX, SMCI, W, XPEL
Call: Dexcom (DXCM); Put: Sealed Air Corporation (SEE); Covered Write: Hess Corporation (HES)
NDW Morning Update Video - July 26, 2023
NDW Morning Update Video – July 26, 2023.
Click here to download MP3
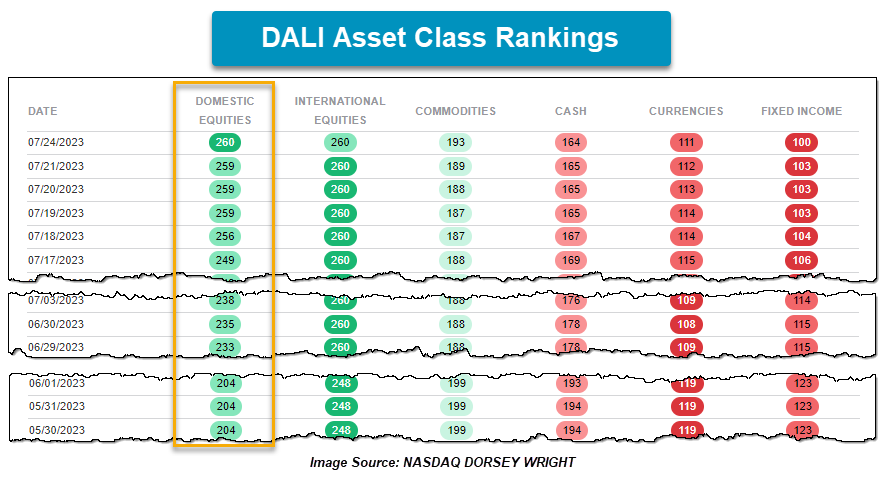
Domestic Equities climbed to 260 tally signals following Monday’s action, tying International Equities in signal count. With the signal tie, DALI resorts to X rank as the tiebreaker which favors Domestic Equities due to its recent strength. Domestic Equities is in the first position of DALI for the first time since early-February 2022. This ends a period of 361 trading days that Domestic Equities ranked outside of the top spot, making it the second longest occurrence going back to the early 2000s. The longest period Domestic Equities ranked out of the number one spot was from August 2003 to May 2010.
Much of the gain in signal strength began around mid-May, with most of the signals coming in June (31) and July (25) – making the asset class the most improved for 2023. Since the end of May, U.S. indices have slightly outpaced International with the S&P 500 SPX adding 8.97% compared to 6.59% for MSCI ACWI ex-US Index MSCIACWIXUS. With International still maintaining positive trending and RS characteristics, U.S. Equities have had quite the uphill climb to overtake International for the top spot.
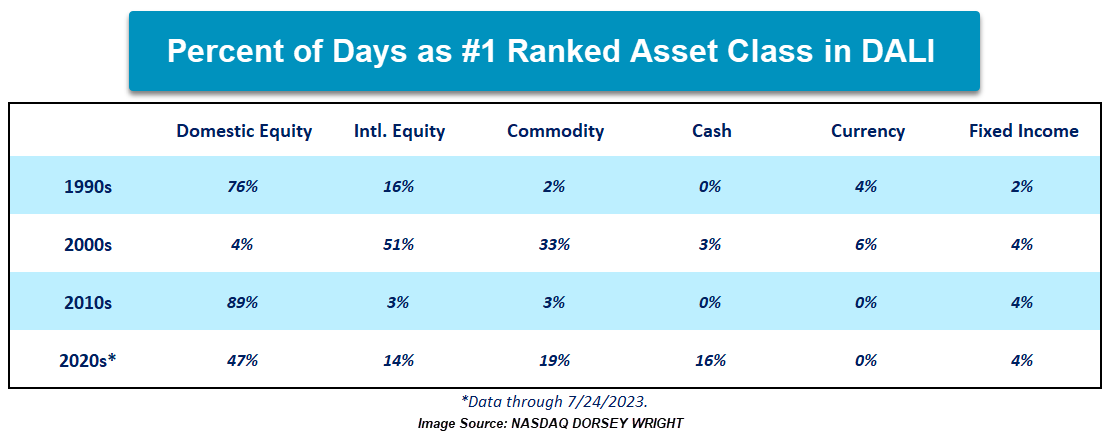
With Domestic Equities moving into the top spot, the table below shows the updated percent of days a particular asset class has held the number 1 ranking within DALI. International Equities have now possessed the top spot in DALI for 14% of the total trading days this decade, and no asset class has held the number 1 ranking for more than half the decade so far. U.S. and International have ranked either 1 or 2 since the latter part of May, giving DALI an offensive tilt. The clear separation by the two equity asset classes confirms that offense tilt as U.S. and International combined possess more tally signals than the remaining four asset classes evaluated. With DALI Tactical Tilt strategies, the change in DALI will likely bring about an increase in Domestic Equities up to their maximum allocation bounds within Moderate and Aggressive strategies. Conversationally, communication to clients that this change is confirming strength within both Equity asset classes, and not a weakness from International, should provide confidence as equity allocations may change or increase. With the recent uptick in Commodities, especially within the agriculture and energy spaces (see the feature below), the asset class has separated itself from Cash and provided an overall offensive tilt to DALI.


September 14th and 15th
The Symposium is pending approval of CE credit toward the CFP®, CIMA®, CPWA®, and RMA certifications.
Event Agenda Coming Soon
Inflation, the market’s biggest worry in 2022, has steadily fallen since its peak led most notably by a major fall in energy prices. Recent developments have put this steady decline in jeopardy, and it appears inflation will not go down without a fight. OPEC+ seems resolute in its defense against crude oil staying below the $70 mark while high temperatures have stoked natural gas demand. On the agricultural front, two major changes have had an impact on food prices. The first is the dissolution of the Black Sea Grain deal between Russia and Ukraine which was highlighted by the destruction of nearly 60k tons of wheat at the Ukrainian port city of Odesa (CNBC). Second, India, a nation that accounts for more than 40% of world rice exports, ordered a major cutback on rice exports that will result in a halving of rice shipments abroad (Reuters). While prices are still well below their peaks from 2022, the recent uptick across many of the major commodities shows that inflation is still putting up a fight.
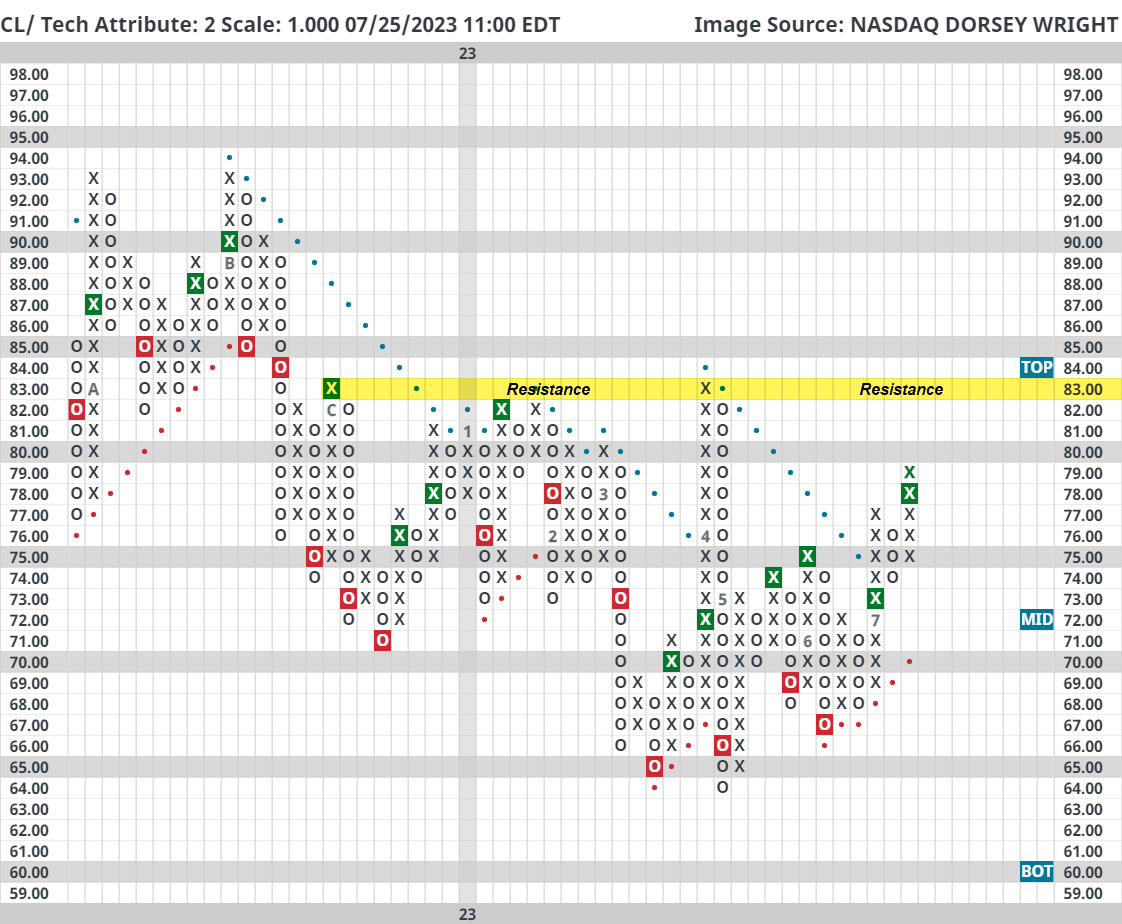
Focusing on energy-related commodities, crude oil (CL/) and gasoline (UJ/) are each up more than 10% in July. Crude returned to a positive trend earlier this month and now trades on two consecutive buy signals. However, crude is approaching major resistance in the low-80s and a move above that area would mark a shift in the energy space and open the door for a test of the low-90s, a range crude last traded in in September and October of last year. While crude has yet to reclaim its 2023 highs, gasoline prices exceeded their April highs and are $0.08 away from testing the October 2022 high. Other than a blip in May, gasoline prices have steadily risen since bottoming in December. Lastly, natural gas (NG/) experienced the most precipitous fall in the energy space until finding a bottom in April. While it is slightly down since the end of May, natural gas is up roughly 27% since bottoming a little over three months ago. None of the three commodities mentioned have strong sustained uptrends but there has been general technical improvement over the last few months. All three have well-established support with stout overhead resistance which has led to large ranges being formed over the last six months. A breakout in either direction would likely lead to a large move. Recently, prices have trended higher with a likely test of the top of each’s respective range looking more likely by the day. The fall in energy prices has been the biggest contributor to falling inflation numbers, so a reversal of that trend would likely have a key effect on inflation data.
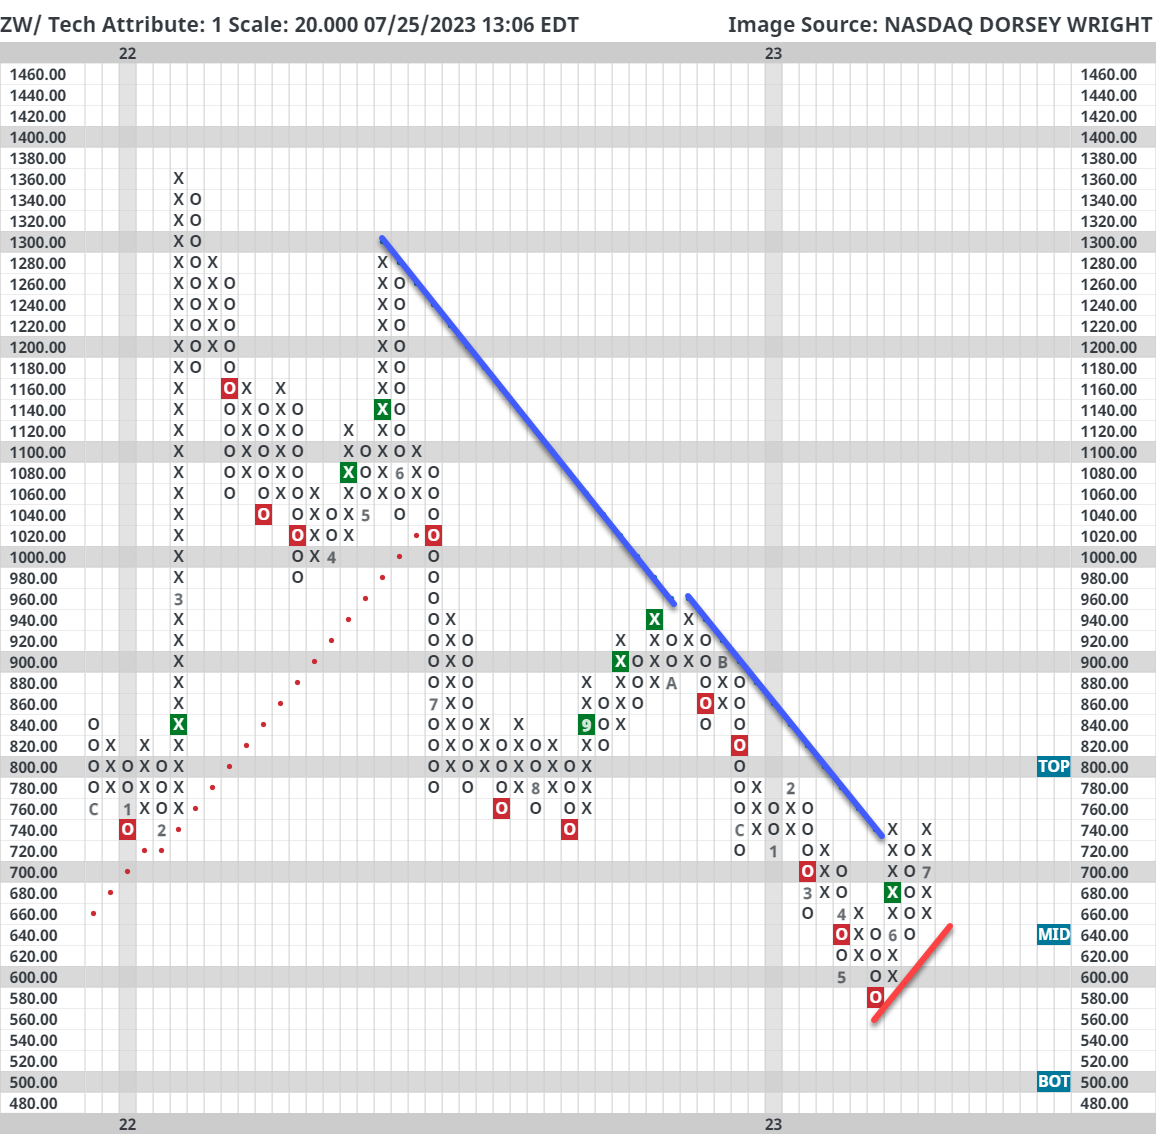
The more recent changes have been in the agriculture space, many agricultural commodities just went through their July harvest. Like equity markets, agriculture markets like wheat have seasonal tendencies as well. During the crop harvest in June and July, supply is bolstered and prices often sell off barring any bad harvests. Prices then usually trend higher. This seasonal trend was broken this year as wheat moved to a buy signal on its 20-point chart, its first buy signal since September. Wheat also entered a positive trend in June breaking through its negative trend line that had been in place since the previous June. The geopolitical influences on wheat were felt fully yesterday as wheat futures (ZW/) went limit up gaining the maximum of 60 points in a single session. Wheat prices had been steadily trending lower since October and food inflation numbers, one of the stickiest, had stabilized since March.
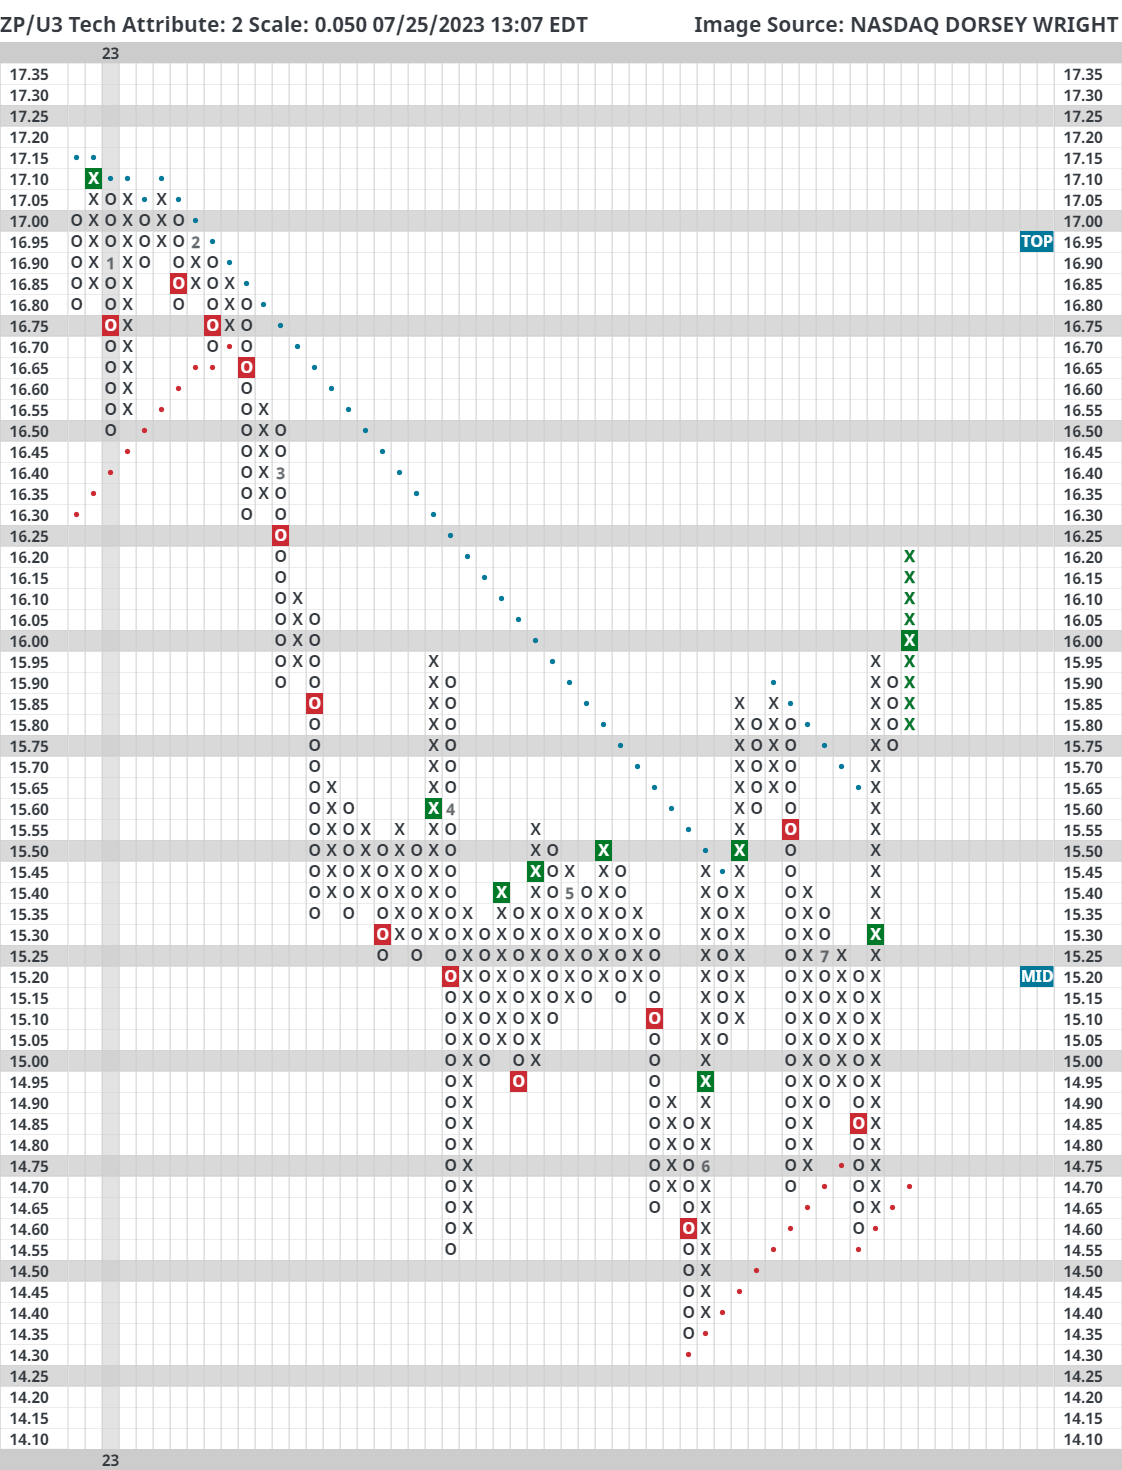
Corn (ZG/) remains in a strong downtrend and sold off heavily in June and early July. Recent news may have helped corn rally from $480 up to $560 but it’s still over 100 points off its 2023 highs. September rough rice futures (ZP/U3) have similar seasonality dynamics to corn as prices usually fall in July. India’s new export ban sent the September futures to their highest level since March on the back of an over 9% rally in less than two weeks. Briefly touched on earlier, food inflation had screeched to a halt since March with the month-over-month change averaging less than 0.1% but this does not appear like it will be sustained due to geopolitical and technical developments over the last several weeks. Both energy and agriculture markets have shown constructive moves in recent weeks. It’s still unclear whether these moves can be built upon further, but this is the first time in many months that commodities are making a joint effort to move higher. Consumer expectations remain relatively high, highlighted by the Conference Board’s one-year inflation expectations that came out this morning at 5.7%. Given the Fed’s “data-driven” approach to derive its rate decisions, an uptick in inflation will raise the chances of more rate hikes and more hawkish rhetoric which will impact both the bond and equity markets.

Average Level
42.51
| < - -100 | -100 - -80 | -80 - -60 | -60 - -40 | -40 - -20 | -20 - 0 | 0 - 20 | 20 - 40 | 40 - 60 | 60 - 80 | 80 - 100 | 100 - > |
|---|---|---|---|---|---|---|---|---|---|---|---|
|
Buy signaleem
|
|||||||||||
|
Buy signalfxe
|
Sell signaldvy
|
||||||||||
|
Buy signalqqq
|
Buy signalXLG
|
Buy signalRSP
|
|||||||||
|
Buy signaloneq
|
Sell signalijh
|
Buy signalspy
|
|||||||||
|
Sell signalief
|
Buy signalijr
|
Buy signalvoog
|
Buy signalgcc
|
||||||||
|
Sell signaldx/y
|
Sell signaltlt
|
Sell signalGLD
|
Buy signalefa
|
Buy signalicf
|
Buy signaluso
|
Buy signalVOOV
|
|||||
|
Buy signalshy
|
Sell signalagg
|
Buy signallqd
|
Buy signalhyg
|
Buy signaliwm
|
Buy signaldia
|
Buy signalgsg
|
|||||
| < - -100 | -100 - -80 | -80 - -60 | -60 - -40 | -40 - -20 | -20 - 0 | 0 - 20 | 20 - 40 | 40 - 60 | 60 - 80 | 80 - 100 | 100 - > |
| AGG | iShares US Core Bond ETF |
| USO | United States Oil Fund |
| DIA | SPDR Dow Jones Industrial Average ETF |
| DVY | iShares Dow Jones Select Dividend Index ETF |
| DX/Y | NYCE U.S.Dollar Index Spot |
| EFA | iShares MSCI EAFE ETF |
| FXE | Invesco CurrencyShares Euro Trust |
| GLD | SPDR Gold Trust |
| GSG | iShares S&P GSCI Commodity-Indexed Trust |
| HYG | iShares iBoxx $ High Yield Corporate Bond ETF |
| ICF | iShares Cohen & Steers Realty ETF |
| IEF | iShares Barclays 7-10 Yr. Tres. Bond ETF |
| LQD | iShares iBoxx $ Investment Grade Corp. Bond ETF |
| IJH | iShares S&P 400 MidCap Index Fund |
| ONEQ | Fidelity Nasdaq Composite Index Track |
| QQQ | Invesco QQQ Trust |
| RSP | Invesco S&P 500 Equal Weight ETF |
| IWM | iShares Russell 2000 Index ETF |
| SHY | iShares Barclays 1-3 Year Tres. Bond ETF |
| IJR | iShares S&P 600 SmallCap Index Fund |
| SPY | SPDR S&P 500 Index ETF Trust |
| TLT | iShares Barclays 20+ Year Treasury Bond ETF |
| GCC | WisdomTree Continuous Commodity Index Fund |
| VOOG | Vanguard S&P 500 Growth ETF |
| VOOV | Vanguard S&P 500 Value ETF |
| EEM | iShares MSCI Emerging Markets ETF |
| XLG | Invesco S&P 500 Top 50 ETF |
| Symbol | Company | Sector | Current Price | Action Price | Target | Stop | Notes |
|---|---|---|---|---|---|---|---|
| GPK | Graphic Packaging Intl. | Forest Prods/Paper | $23.90 | 21 - 23 | 26 | 18 | 5 for 5'er, #2 of 15 in favored FORE sector matrix, LT pos mkt RS, triple top, 1.3% yield, Earn. 8/1 |
| V | Visa Inc. | Finance | $240.74 | 210s - 220s | 262 | 188 | 5 for 5'er top third of FIN sector matrix, LT pos mkt RS, spread quintuple top, Earn. 7/25 |
| BJRI | BJ's Restaurants Inc. | Restaurants | $33.76 | low 30s | 55 | 26 | 3 for 5'er, top third of favored REST sector matrix, triple top, pullback from 52-week high, R-R>3.5, Earn. 7/27 |
| TXRH | Texas Roadhouse, Inc. | Restaurants | $113.62 | 100s | 125 | 90 | 5 TA rating, top half REST sector matrix, consec. buy signals, LT RS buy, 2.10% yield, Earn. 7/27 |
| UBS | UBS AG (Switzerland) ADR | Banks | $21.42 | 18 - 22 | 38.50 | 16 | 5 for 5'er, #5 of 126 in BANK sector matrix, bullish triangle, R-R>4.0, 2.75% yield |
| BRK.B | Berkshire Hathaway Inc | Insurance | $349.63 | mid 300s - low 330s | 396 | 280 | 5 TA rating, top third of INSU sector matrix, LT pos. trend, LT RS buy, buy-on-pullback |
| DRI | Darden Restaurants, Inc. | Restaurants | $170.08 | mid 150s - mid 160s | 192 | 130 | 5 TA rating, pos. trend, LT RS buy, pos. weekly mom., recent price normalization |
| CMCSA | Comcast Corporation | Media | $43.29 | hi 30s - low 40s | 50 | 33 | 4 for 5'er, top third of MEDI sector matrix, multiple consec buy signal, pullback to middle of trading band, 2.94% yield, Earn. 7/27 |
| VVV | Valvoline Inc | Autos and Parts | $38.77 | mid - hi 30s | 53 | 30 | 5 TA rating, top third in the AUTO sector RS matrix, consec. buy signals, buy-on-pullback, R-R > 2, Earn. 8/1 |
| HCA | HCA Healthcare Inc. | Healthcare | $285.18 | mid 270s - lo 300s | 392 | 236 | 5 TA rating, top 20% of HEAL sector, consec. buy signals, LT market RS buy, buy-on-pullback, Earn. 7/27 |
| PEP | PepsiCo, Inc. | Food Beverages/Soap | $190.92 | 180 - lo 190s | 250 | 152 | 4 TA rating, top third of FOOD sector matrix, LT RS buy, normalized entry point, 2.72% yield |
| ANSS | Ansys Inc | Software | $339.84 | 320s - 340s | 404 | 280 | 5 for 5'er, top third of SOFT sector matrix, LT pos mkt RS, multiple consec buy signals, Earn. 8/2 |
| SEM | Select Medical Holdings Corporation | Healthcare | $31.54 | hi 20s - lo 30s | 52.50 | 23 | 5 TA rating, top third of HEAL sector matrix, LT RS buy, normalized prices, recent pos. wkly mom., R-R > 3, Earn. 8/3 |
| MDLZ | Mondelez International, Inc. Class A | Food Beverages/Soap | $74.32 | hi 60s - mid 70s | 95 | 59 | 4 for 5'er. top 25% of favored FOOD sector matrix, multiple buy signals, pullback from ATH, 2.1% yield, Earn. 7/27 |
| AJG | Arthur J. Gallagher & Co. | Insurance | $219.64 | hi 200s - hi 210s | 298 | 180 | 5 for 5'er, 10 of 71 in favored INSU sector matrix, LT pos mkt RS, R-R>2.0, Earn. 7/27 |
| RSG | Republic Services, Inc. | Waste Management | $154.30 | lo 140s - mid 150s | 190 | 120 | 5 TA rating, top third of WAST sector matrix, consec. buy signals, pos. wkly mom., Earn. 7/31 |
| ALKS | Alkermes Incorporated | Biomedics/Genetics | $31.79 | hi 20s - low 30s | 48 | 24 | 5 for 5'er, top half of favored BIOM sector matrix, spread triple top, pull back from 52-week high, R-R>3.0, Earn. 7/27 |
| AFL | AFLAC Incorporated | Insurance | $72.46 | hi 60s - lo 70s | 87 | 56 | 5 TA rating, top quintile of INSU sector matrix, LT pos. trend, RS buy, recent consec. buy signals, Earn. 8/1 |
| ACA | Arcosa Inc | Transports/Non Air | $75.98 | low-to-mid $70s | 98 | 65 | 4 for 5'er, #8 of 50 in favored TRAN sector matrix, one box from peer RS buy signal, R-R>2.0, Earn. 8/1 |
| LIN | Linde Plc | Chemicals | $384.69 | 370s - 380s | 440 | 316 | 5 for 5'er, #6 of 47 in favored CHEM sector matrix, LT pos mkt RS, triple top, 1.35% yield |
| VRTX | Vertex Pharmaceuticals Incorporated | Biomedics/Genetics | $357.05 | hi 330s - lo 370s | 444 | 280 | 4 TA rating, top half of BIOM sector matrix, consec. buy signals, LT RS buy, pos. wkly and mo. momentum flips, Earn. 8/1 |
| SPB | Spectrum Brands Holdings | Food Beverages/Soap | $77.30 | mid-to-hi 70s | 97 | 63 | 5 for 5'er, #3 of 78 in favored FOOD sector matrix, LT pos mkt RS, 2.2% yield, Earn 8/10 |
| FERG | Ferguson PLC | Building | $159.58 | lo 150s - mid 160s | 204 | 132 | 4 TA rating, LT mkt RS buy & pos. trend, consec. buy signals, near-term price consolidation |
| LULU | Lululemon Athletica Inc. | Retailing | $380.39 | 370s - 390s | 452 | 320 | 5 for 5'er, top 25% of RETA sector matrix, triple top |
| INTU | Intuit Inc. | Software | $488.50 | 470s - 490s | 672 | 400 | 4 for 5'er, favored SOFT sector matrix, LT pos mkt RS, spread quintuple top, pos trend flip, Earn. 8/21 |
| HWC | Hancock Whitney Corp | Banks | $43.24 | hi 30s - mid 40s | 66 | 34 | 5 TA rating, top half of BANK sector matrix, LT RS buy, pos. wkly mom., 2.83% yield |
| Symbol | Company | Sector | Current Price | Action Price | Target | Stop | Notes |
|---|---|---|---|---|---|---|---|
| LAUR | Laureate Education Inc | Business Products | $12.56 | (11.50-12.50) | 6 | 13.50 | 2 for 5'er, LT negative trend & market RS, spread triple bottom, R-R>3.0, Earn. 8/2 |
| Symbol | Company | Sector | Current Price | Action Price | Target | Stop | Notes |
|---|---|---|---|---|---|---|---|
| GE | General Electric Company | Electronics | $110.25 | 93 | GE moved into overbought territory Tuesday. We will raise our stop to $93. |
| Comment | |||||||
|---|---|---|---|---|---|---|---|
|
|
|||||||
HWC Hancock Whitney Corp R ($42.98) - Banks - HWC has a strong 5 for 5 TA rating and sits in the top half of the banks' sector RS matrix. The stock moved back into a positive trend last week after giving a second consecutive buy signal at $44 and has maintained an RS buy signal against the market since late 2020. Weekly momentum recently flipped positive as well, suggesting the potential for further upside from here. The last few days of price action have seen HWC pull back slightly, offering a more opportune entry point for potential long investors. Exposure may be considered in the high $30s to mid-$40s. Our initial stop will be set at $34, which would move the stock into a negative trend. The bullish price objective of $66 will serve as our price target, offering a reward-to-risk ratio north of 2.50. Note that HWC also carries a 2.83% yield.
| 22 | 23 | ||||||||||||||||||||||||||||||||||||||||||||||||||||
| 59.00 | X | • | 59.00 | ||||||||||||||||||||||||||||||||||||||||||||||||||
| 58.00 | X | O | • | • | 58.00 | ||||||||||||||||||||||||||||||||||||||||||||||||
| 57.00 | X | O | • | • | X | • | 57.00 | ||||||||||||||||||||||||||||||||||||||||||||||
| 56.00 | X | O | X | 3 | • | • | • | X | X | O | • | 56.00 | |||||||||||||||||||||||||||||||||||||||||
| 55.00 | X | O | 2 | O | X | O | X | • | X | • | X | O | X | O | • | • | 55.00 | ||||||||||||||||||||||||||||||||||||
| 54.00 | X | O | X | O | X | O | X | O | X | O | • | X | O | X | O | X | • | 54.00 | |||||||||||||||||||||||||||||||||||
| 53.00 | X | X | O | X | O | X | O | X | O | X | O | • | X | B | O | X | O | • | 53.00 | ||||||||||||||||||||||||||||||||||
| 52.00 | X | B | O | X | O | O | O | X | O | 4 | • | X | X | C | 2 | O | • | 52.00 | |||||||||||||||||||||||||||||||||||
| 51.00 | X | O | X | O | 1 | O | O | X | • | • | X | O | X | X | O | X | X | O | • | 51.00 | |||||||||||||||||||||||||||||||||
| 50.00 | X | X | O | X | O | X | X | O | X | O | X | • | X | O | X | O | X | O | 1 | O | X | O | • | 50.00 | |||||||||||||||||||||||||||||
| 49.00 | A | O | X | O | O | X | O | X | • | O | X | O | X | X | O | 8 | O | X | O | A | X | O | X | O | X | O | • | 49.00 | |||||||||||||||||||||||||
| 48.00 | X | O | X | O | X | O | X | • | O | O | X | O | X | O | X | 9 | X | O | X | O | X | • | O | X | O | X | 3 | • | Top | 48.00 | |||||||||||||||||||||||
| 47.00 | X | O | C | O | X | • | O | X | O | X | 6 | X | O | O | X | O | X | • | O | O | O | • | 47.00 | ||||||||||||||||||||||||||||||
| 46.00 | X | X | O | • | 5 | O | X | O | X | O | • | O | • | O | • | 46.00 | |||||||||||||||||||||||||||||||||||||
| 45.00 | X | O | X | • | O | O | X | • | • | O | • | 45.00 | |||||||||||||||||||||||||||||||||||||||||
| 44.00 | X | O | X | • | O | X | • | O | • | X | 44.00 | ||||||||||||||||||||||||||||||||||||||||||
| 43.00 | X | 9 | X | • | O | X | • | O | X | X | 43.00 | ||||||||||||||||||||||||||||||||||||||||||
| 42.00 | O | • | 7 | • | O | X | O | X | 42.00 | ||||||||||||||||||||||||||||||||||||||||||||
| 41.00 | • | • | O | X | X | O | 7 | 41.00 | |||||||||||||||||||||||||||||||||||||||||||||
| 40.00 | • | O | X | O | X | O | X | 40.00 | |||||||||||||||||||||||||||||||||||||||||||||
| 39.00 | • | O | X | O | X | 6 | O | X | Mid | 39.00 | |||||||||||||||||||||||||||||||||||||||||||
| 38.00 | • | O | X | O | X | O | 4 | X | O | 38.00 | |||||||||||||||||||||||||||||||||||||||||||
| 37.00 | • | O | O | X | O | X | O | X | 37.00 | ||||||||||||||||||||||||||||||||||||||||||||
| 36.00 | • | O | O | X | O | X | 36.00 | ||||||||||||||||||||||||||||||||||||||||||||||
| 35.00 | • | O | 5 | X | X | 35.00 | |||||||||||||||||||||||||||||||||||||||||||||||
| 34.00 | • | O | X | O | X | • | 34.00 | ||||||||||||||||||||||||||||||||||||||||||||||
| 33.00 | • | O | X | O | X | • | 33.00 | ||||||||||||||||||||||||||||||||||||||||||||||
| 32.00 | • | O | O | • | 32.00 | ||||||||||||||||||||||||||||||||||||||||||||||||
| 22 | 23 |

| ADM Archer-Daniels-Midland Company ($86.05) - Food Beverages/Soap - Shares of ADM broke through their bearish resistance line on Tuesday due to a favorable earnings response. The stock is now a 3 for 5'er yet still within a wide trading range. Initial support is distant, offered down around $73. |
| DDOG Datadog Inc Class A ($115.30) - Software - DDOG rose Tuesday to break a double top at $118, marking a third consecutive buy signal. This 5 for 5'er moved to a positive trend in May and ranks in the top quintile of the favored software sector RS matrix. Weekly momentum also recently flipped positive, suggesting the potential for further upside from here. The weight of the technical evidence is favorable here and continues to improve. Initial support is seen at $110 with further support offered at $96. Note that earnings are expected on 8/8. |
| LYB LyondellBasell Industries NV ($93.74) - Chemicals - LYB gave a second consecutive buy signal on Tuesday when it broke a spread quadruple top at $94, taking out resistance that had been in place since May. The move adds evidence to an already positive technical picture as LYB is a 3 for 5'er and ranks in the top half of the favored chemicals sector matrix. From here, the stock faces overhead resistance at $95, while support can be found at $90. Earnings are expected on 8/4. |
| PHM PulteGroup, Inc. ($83.43) - Building - PHM reversed into Xs and rallied to break a double top at $83 for a sixth consecutive buy signal and a new high for the stock. PHM is a 4 for 5'er that ranks in the top quintile of the Building sector matrix. Those seeking exposure to the stock may look to add on a pullback to $80 on the chart. Initial support lies at $77 and $75, while additional support can be found at $66. |
| PVH Phillips-Van Heusen Corporation ($84.53) - Textiles/Apparel - PVH broke a double bottom at $85 for the first sell signal since mid-June. This follows the stock rallying to $93 and putting in a lower top at $90. PVH is testing the bullish support line, which would be violated with a move below $84 and drop the stock to a 2 for 5'er. From here, additional support lies in the $82 to $81 range along with $76, the June 2023 low |
| RTX Raytheon Technologies Corp. ($86.13) - Aerospace Airline - RTX was down big on the back of earnings, falling as much as 12% on the day. This will push this stock further into technically unacceptable range, moving back into a column of O's against the market. RTX will now earn 0 technical attribute points for the first time since late 2020, and exposure should be limited. As the day does bring RTX into heavily oversold territory, consider cutting current positions on rallies. |
| SMCI Super Micro Computer, Inc. ($321.35) - Computers - SMCI advanced Tuesday to complete a bullish triangle at $316 before reaching $320 intraday. This 5 for 5'er moved to a positive trend in February and ranks 1st out of 45 names in the favored computers sector RS matrix. Weekly momentum also just flipped positive, suggesting the potential for further price appreciation. The technical picture is strong and continues to improve. However, the recent rally has left SMCI in an overbought position. Initial support is offered at $296 with further support found at $284, $268, and $248. |
| W Wayfair Inc. ($68.30) - Retailing - W reversed into Os and broke a double bottom at $69. This is the first sell signal for W since May and follows the stock meeting resistance on three occasions at $73 this month. The stock remains a 5 for 5'er and ranks in the top decile of the Retailing sector matrix. From here, a move to $74 would return to stock to a buy signal and match the February rally high. Initial support lies at current levels while additional support lies at $57 and $55. |
| XPEL XPEL, Inc. ($78.37) - Autos and Parts - XPEL broke a double bottom to complete a bullish signal reversal pattern for the stock's first sell signal since mid-May. XPEL remains a 5 for 5'er that ranks in the top half of the Autos and Parts sector matrix, and this action brings the stock back toward the middle of the trading band following a rally near 52-week highs. Support for the stock lies at $74, the bullish support line, as well as at $69. |
| Name | Option Symbol | Action | Stop Loss |
|---|---|---|---|
| Dexcom Inc. - $130.31 | DXCM2315L130 | Buy the December 130.00 calls at 12.90 | 118.00 |
| Name | Option | Action |
|---|---|---|
| Fiserv, Inc. ( FI) | Sep. 110.00 Calls | Raise the option stop loss to 18.90 (CP: 20.90) |
| The TJX Companies, Inc. ( TJX) | Oct. 80.00 Calls | Raise the option stop loss to 6.80 (CP: 8.80) |
| Molson Coors Company ( TAP) | Oct. 65.00 Calls | Raise the option stop loss to 5.00 (CP: 7.00) |
| Tractor Supply Company ( TSCO) | Oct. 210.00 Calls | Stopped at 13.30 (CP: 12.60) |
| Name | Option Symbol | Action | Stop Loss |
|---|---|---|---|
| Sealed Air Corporation - $46.64 | SEE2320V45 | Buy the October 45.00 puts at 1.75 | 50.00 |
| Name | Option | Action |
|---|---|---|
| Freeport-McMoRan Inc. (FCX) | Nov. 39.00 Puts | Stopped at 44.00 (CP: 43.99) |
| The Sherwin-Williams Company (SHW) | Dec. 250.00 Puts | Stopped at 280.00 (CP: 276.31) |
| Name | Option Sym. | Call to Sell | Call Price | Investment for 500 Shares | Annual Called Rtn. | Annual Static Rtn. | Downside Protection |
|---|---|---|---|---|---|---|---|
| Hess Corporation $145.66 | HES2317K150 | Nov. 150.00 | 10.40 | $69,501.10 | 21.74% | 20.13% | 5.97% |
| Name | Action |
|---|---|
| CrowdStrike Holdings, Inc. Class A (CRWD) - 149.74 | Sell the October 155.00 Calls. |
| Roku, Inc. Class A (ROKU) - 71.86 | Sell the October 65.00 Calls. |
| International Game Technology (IGT) - 33.01 | Sell the October 33.00 Calls. |
| Palantir Technologies Inc. Class A (PLTR) - 16.32 | Sell the November 18.00 Calls. |
| Schlumberger Limited (SLB) - 57.02 | Sell the November 60.00 Calls. |
| Aptiv PLC (APTV) - 109.43 | Sell the November 115.00 Calls. |
| Generac Holdings, Inc. (GNRC) - 146.60 | Sell the November 145.00 Calls. |
| Arista Networks Inc (ANET) - 171.72 | Sell the December 180.00 Calls. |
| Norwegian Cruise Line Holdings Ltd. (NCLH) - 20.81 | Sell the December 22.00 Calls. |
| KB Home (KBH) - 52.99 | Sell the October 55.00 Calls. |
| Wynn Resorts, Limited (WYNN) - 107.51 | Sell the December 110.00 Calls. |
| Name | Covered Write |
|---|---|
| Delta Air Lines Inc. ( DAL - 47.48 ) | December 50.00 covered write. |
Daily Equity & Market Analysis
Loading, Please Wait...
