Most Requested Symbols

The Nasdaq-100 Index has seen roughly 40% of the trading days this year experience a gain or loss of at least 1%, which is back in line with historical averages.
The average distribution level is 5.35%.
Today's featured stock is Fortinet Inc. (FTNT).
CCS, FSLR, LRCX, NUE, PAG, and TSLA
Call: Fortinet (FTNT); Put: Halliburton (HAL) Covered Write: Northern Oil & Gas (NOG).
NDW Morning Update Video - June 27, 2023
NDW Morning Update Video – June 27, 2023.
Click here to download MP3
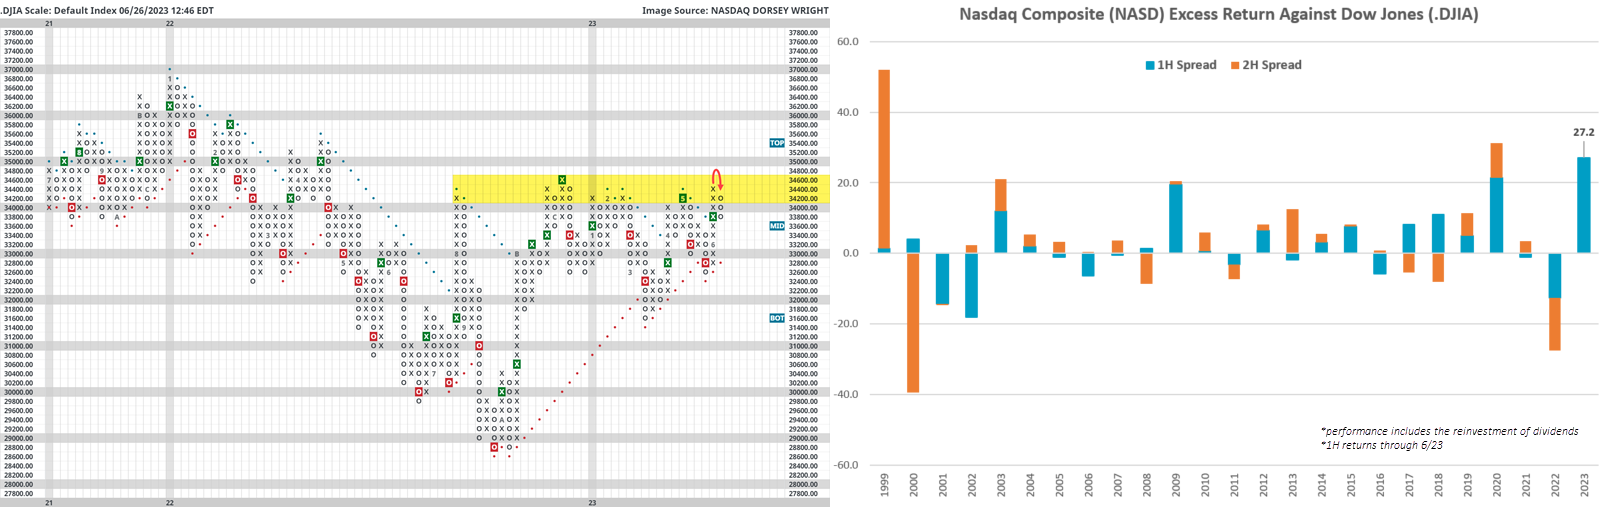
Equity benchmarks exhaled last week; the Nasdaq Composite (NASD) and S&P 500 (SPX) each dipped about 1.4% while the Dow Jones (.DJIA) slid 1.7%. The downturn was enough to push each index back into a column of Os on its default Point & Figure chart; however, SPX and NASD pulled back towards the August 2022 old resistance level while the Dow retreated beneath its 2023 highs. Point being - based on our charting methods, the NASD and SPX reversals appear to be healthy while the Dow reversal is notably less constructive. We see the technical discrepancy more clearly via index tracking ETFs like SPY and DIA, which carry fund scores of 4.46 and 2.71, respectively.
A further point on recent performance - the Dow is currently lagging SPX year-to-date by over 10% and NASD by nearly 30%, which suggests to some that the Dow could qualify for a “catch up” trade should things keep progressing. Although, of the four other instances since 1999 that NASD has outpaced the Dow by 10%+ by this point in the year, NASD continued to outperform the rest of the year 75% of the time. The only year when this was not the case was 2018.
Returning to the Point & Figure chart to close, bulls should look to see the Dow post a higher bottom and break above the 34,400 – 34,600 range in the months ahead and then go on to challenge the early 2022 chart highs.

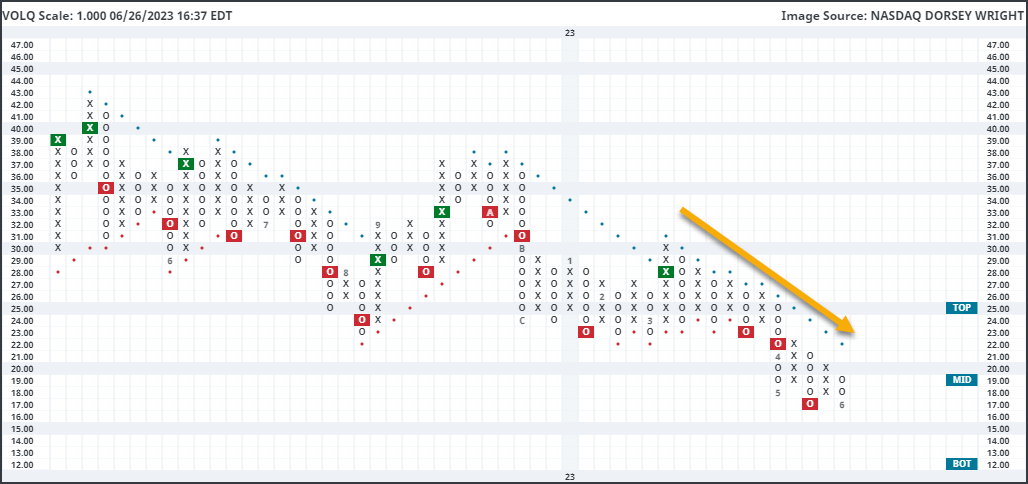
Domestic equity markets have experienced dampening volatility throughout the second quarter of the year. This has been especially evident in large-cap-focused indices, such as the Nasdaq-100 Index NDX, which has gained over 35% year-to-date through the market action on Monday, June 26. That includes an improvement of almost 13% in the second quarter alone. Meanwhile, the Nasdaq-100 Volatility Index VOLQ has continued to move steadily lower. This Index seeks to track the 30-day implied volatility for the Nasdaq-100 Index and can be viewed similarly to the VIX. Higher readings point toward higher volatility, while lower readings point toward expectations of more muted movement. Examining the 1-point chart of VOLQ clearly shows the steady decline in volatility over the past three months. The index topped out at 30 in March, moved into a negative trend later that month at $23, and most recently fell to a double bottom formation matching 52-week lows at 17. While the reading has decreased significantly, we have seen VOLQ print much lower levels at other points in recent memory. It hit 14 in the summer of 2021 and moved as low as the 10 level in December 2019. The late-2010s showed a consistently low field position for VOLQ, with its all-time low on this chart sitting at 9 in March 2017. While we have seen dampening volatility for the NDX over the past few months, we have seen lower levels during prior peaks in large-cap growth markets.
Another way to track volatility in the NDX is by counting the number of days the index sees a gain or loss exceeding 1% in value, which we examine in our NDX Volatility Study. This is meant to provide insight into the actual experience felt by investors during different market environments. So far this year, the NDX has seen 49 trading days that have moved either up or down at least 1%. That equates to roughly 40% of this year's trading days. While that may seem like a lot, it is directly in line with the average percent of volatile trading days in any year since our data began in 1986. For comparison, we saw 65% of the trading days in 2022 hit the 1% mark, which was the most in any year since 2002. Out of those volatile days seen in 2023, 30 occurred in the first quarter, while just 19 have occurred so far in the second quarter. It is an overall positive to see volatility continue to recede while the NDX has stormed higher over the past few months.
Another positive sign can be seen by breaking down the count of “extreme” days so far this year by the direction of the move. By random happenstance, the breakdown of positive to negative 1% days in 2023 directly follows the breakdown of the days in Q1 and Q2; there have been 30 positive 1% days and 19 negative 1% days. Said another way, 25% of the trading days so far this year have seen NDX move at least 1% higher, while 15.83% have seen it move at least 1% lower. That equates to a 9.17% spread between the percentage of positive days and the percentage of negative days, which is the most extensive spread favoring positive days since 2009. Only two other years have seen a larger spread, which occurred in 1998 (9.92%) and 1999 (11.90%).
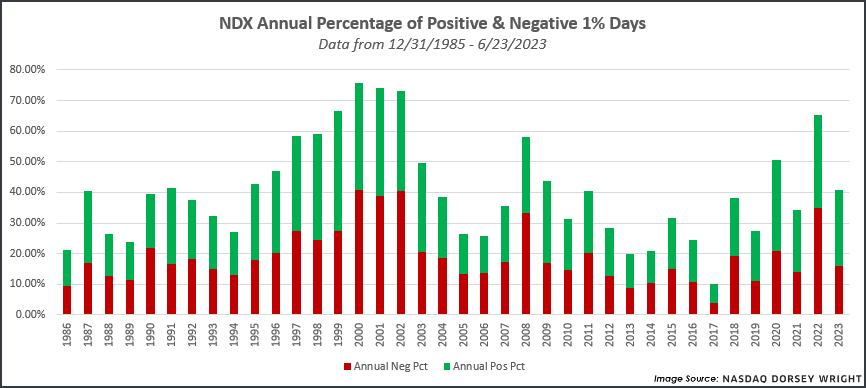
The important point with this spread data is that we are seeing significantly more sharp moves higher than sharp moves lower this year, which has historically only occurred in two market environments: the formation of the dot-com bubble in the late 1990s and the bear market exit in 2009. The current market environment has been attributed to both of those timeframes. Some view the current AI-induced mania as the beginning of another bubble. It is worth pointing out that the overall percentage of 1% days experienced by the NDX would not support this theory in the same way that we saw in the late 1990s. At that time, the NDX saw the percentage of volatile days continuously elevating from 58% in 1997 to sitting north of 70% from 2000 through 2002. So, while we saw significantly more positive 1% days than negative 1% days in the final two years of the 20th century, the overall level of volatility was continuing to rise as well. Fast forwarding to the current market environment, we are faced with a very different picture. Overall volatility has come down sharply over the past few months, but the days that have been “extreme” have seen consistent movement higher.
Average Level
5.35
| < - -100 | -100 - -80 | -80 - -60 | -60 - -40 | -40 - -20 | -20 - 0 | 0 - 20 | 20 - 40 | 40 - 60 | 60 - 80 | 80 - 100 | 100 - > |
|---|---|---|---|---|---|---|---|---|---|---|---|
|
Sell signalTLT
|
|||||||||||
|
Sell signaldx/y
|
|||||||||||
|
Buy signalhyg
|
Buy signalijr
|
||||||||||
|
Buy signalefa
|
Sell signalagg
|
Buy signaldia
|
|||||||||
|
Sell signaldvy
|
Sell signalgcc
|
Buy signalfxe
|
|||||||||
|
Sell signalief
|
Sell signallqd
|
Buy signalRSP
|
|||||||||
|
Sell signalGLD
|
Sell signalicf
|
Buy signaleem
|
Buy signaliwm
|
Buy signalvoog
|
Buy signaloneq
|
||||||
|
Buy signalshy
|
Sell signaluso
|
Buy signalgsg
|
Sell signalijh
|
Buy signalVOOV
|
Buy signalspy
|
Buy signalXLG
|
Buy signalqqq
|
||||
| < - -100 | -100 - -80 | -80 - -60 | -60 - -40 | -40 - -20 | -20 - 0 | 0 - 20 | 20 - 40 | 40 - 60 | 60 - 80 | 80 - 100 | 100 - > |
| AGG | iShares US Core Bond ETF |
| USO | United States Oil Fund |
| DIA | SPDR Dow Jones Industrial Average ETF |
| DVY | iShares Dow Jones Select Dividend Index ETF |
| DX/Y | NYCE U.S.Dollar Index Spot |
| EFA | iShares MSCI EAFE ETF |
| FXE | Invesco CurrencyShares Euro Trust |
| GLD | SPDR Gold Trust |
| GSG | iShares S&P GSCI Commodity-Indexed Trust |
| HYG | iShares iBoxx $ High Yield Corporate Bond ETF |
| ICF | iShares Cohen & Steers Realty ETF |
| IEF | iShares Barclays 7-10 Yr. Tres. Bond ETF |
| LQD | iShares iBoxx $ Investment Grade Corp. Bond ETF |
| IJH | iShares S&P 400 MidCap Index Fund |
| ONEQ | Fidelity Nasdaq Composite Index Track |
| QQQ | Invesco QQQ Trust |
| RSP | Invesco S&P 500 Equal Weight ETF |
| IWM | iShares Russell 2000 Index ETF |
| SHY | iShares Barclays 1-3 Year Tres. Bond ETF |
| IJR | iShares S&P 600 SmallCap Index Fund |
| SPY | SPDR S&P 500 Index ETF Trust |
| TLT | iShares Barclays 20+ Year Treasury Bond ETF |
| GCC | WisdomTree Continuous Commodity Index Fund |
| VOOG | Vanguard S&P 500 Growth ETF |
| VOOV | Vanguard S&P 500 Value ETF |
| EEM | iShares MSCI Emerging Markets ETF |
| XLG | Invesco S&P 500 Top 50 ETF |

| Symbol | Company | Sector | Current Price | Action Price | Target | Stop | Notes |
|---|---|---|---|---|---|---|---|
| GPK | Graphic Packaging Intl. | Forest Prods/Paper | $23.60 | 21 - 23 | 26 | 18 | 5 for 5'er, #2 of 15 in favored FORE sector matrix, LT pos mkt RS, triple top, 1.3% yield |
| V | Visa Inc. | Finance | $229.55 | 210s - 220s | 262 | 188 | 5 for 5'er top third of FIN sector matrix, LT pos mkt RS, spread quintuple top |
| MRK | Merck & Co., Inc. | Drugs | $114.60 | mid 100s - low 110s | 137 | 89 | 4 for 5'er top third of DRUG sector matrix, multiple consec buys, pullback from ATH, 2.7% yield |
| BJRI | BJ's Restaurants Inc. | Restaurants | $30.37 | low 30s | 55 | 26 | 3 for 5'er, top third of favored REST sector matrix, triple top, pullback from 52-week high, R-R>3.5, Earn. 7/19 |
| FI | Fiserv, Inc. | Computers | $120.49 | mid 100s - mid 110s | 123 | 91 | 5 for 5'er, top 25% of COMP sector matrix, LT pos mkt RS, pullback from 52-week high |
| TXRH | Texas Roadhouse, Inc. | Restaurants | $108.81 | 100s | 125 | 90 | 5 TA rating, top half REST sector matrix, consec. buy signals, LT RS buy, 2.10% yield |
| UBS | UBS AG (Switzerland) ADR | Banks | $19.76 | 18 - 22 | 38.50 | 16 | 5 for 5'er, #5 of 126 in BANK sector matrix, bullish triangle, R-R>4.0, 2.75% yield |
| BRK.B | Berkshire Hathaway Inc | Insurance | $335.25 | mid 300s - low 330s | 396 | 280 | 5 TA rating, top third of INSU sector matrix, LT pos. trend, LT RS buy, buy-on-pullback |
| CLX | The Clorox Company | Household Goods | $156.14 | 160s | 194 | 136 | 5 for 5'er, 7th of 26 in HOUS sector matrix, RS buy signal, triple top, 2.8% yield |
| AER | AerCap Holdings NV | Aerospace Airline | $60.60 | hi 50s - low 60s | 72 | 49 | 5 for 5'er, top half of AERO, sector matrix, triple top breakout |
| CBRE | CBRE Group, Inc. | Real Estate | $75.23 | 72 - low 80s | 91 | 66 | 4 TA rating, top half of REAL sector matrix, recent pos. trend, LT RS buy |
| DRI | Darden Restaurants, Inc. | Restaurants | $161.30 | mid 150s - mid 160s | 192 | 130 | 5 TA rating, pos. trend, LT RS buy, pos. weekly mom., recent price normalization |
| CMCSA | Comcast Corporation | Media | $40.09 | hi 30s - low 40s | 50 | 33 | 4 for 5'er, top third of MEDI sector matrix, multiple consec buy signal, pullback to middle of trading band, 2.94% yield |
| SAIA | Saia, Inc. | Transports/Non Air | $312.46 | 290s - 300s | 380 | 264 | 5 for 5'er, top 10% of favored TRAN sector matrix, LT pos mkt RS, bearish signal reversal, pos trend change, R-R>2.0 |
| GE | General Electric Company | Electronics | $103.78 | hi 90s - hi 100s | -- | 86 | 5 for 5'er, #4 of 67 in ELEC sector matrix, LT pos mkt RS, triple top breakout |
| SKX | Skechers U.S.A, Inc. | Textiles/Apparel | $50.78 | lo-mid 50s | 67 | 41 | 5 TA rating, #2 of 23 names in TEXT sector matrix, pos. trend, RS buy, price normalization |
| SHOP | Shopify Inc | Internet | $63.79 | hi 50s - low 60s | 81 | 51 | 5 for 5'er, #1 of 52 in INET sector matrix, bullish signal reversal, R-R>2.0 |
| CRM | Salesforce Inc. | Software | $210.09 | hi 190s - 220 | 258 | 168 | 4 TA rating, top 20% of SOFT sector matrix, consec. buy signals, buy-on-pullback |
| AXP | American Express Company | Finance | $168.07 | mid 160s - mid 170s | 222 | 146 | 4 for 5'er, 14th of 72 in FINA sector matrix, pos trend flip, spread triple top, pos wkly mom flip, R-R>2.0, Earn. 7/20 |
| IPG | The Interpublic Group of Companies, Inc. | Media | $38.48 | hi 30s - low 40s | 66 | 32 | 5 for 5'er, #1 of 30 in MEDI sector matrix, spread quad top, R-R>3.0, 3.1% yield, Earn. 7/19 |
| TTWO | Take-Two Interactive Software, Inc. | Software | $141.85 | 130s | 182 | 108 | 4 for 5'er, top third of favored SOFT sector matrix, one box from peer RS buy signal |
| RS | Reliance Steel & Aluminum Co | Steel/Iron | $258.26 | mid 240s - low 260s | 320 | 204 | 5 for 5'er, #4 of 18 in favored STEE sector matrix, LT pos peer & mkt RS, triple top breakout, 1.6% yield |
| VVV | Valvoline Inc | Autos and Parts | $36.06 | mid - hi 30s | 53 | 30 | 5 TA rating, top third in the AUTO sector RS matrix, consec. buy signals, buy-on-pullback, R-R > 2 |
| HCA | HCA Healthcare Inc. | Healthcare | $295.40 | mid 270s - lo 300s | 392 | 236 | 5 TA rating, top 20% of HEAL sector, consec. buy signals, LT market RS buy, buy-on-pullback, Earn. 7/20 |
| PEP | PepsiCo, Inc. | Food Beverages/Soap | $186.07 | 180 - lo 190s | 250 | 152 | 4 TA rating, top third of FOOD sector matrix, LT RS buy, normalized entry point, 2.72% yield, Earn. 7/13 |
| ANSS | Ansys Inc | Software | $319.35 | 320s - 340s | 404 | 280 | 5 for 5'er, top third of SOFT sector matrix, LT pos mkt RS, multiple consec buy signals |
| SEM | Select Medical Holdings Corporation | Healthcare | $29.45 | hi 20s - lo 30s | 52.50 | 23 | 5 TA rating, top third of HEAL sector matrix, LT RS buy, normalized prices, recent pos. wkly mom., R-R > 3 |
| AL | Air Lease Corp. | Aerospace Airline | $40.18 | hi 30s - low 40s | 64 | 35 | 4 for 5'er, favored AERO sector matrix, bullish triangle, R-R>4.0, 1.95% yield |
| FTNT | Fortinet Inc. | Software | $71.59 | hi 60s - low 70s | 92 | 60 | 5 for 5'er, top 25% of favored SOFT sector matrix, LT pos peer RS, triple top, good R-R |
| Symbol | Company | Sector | Current Price | Action Price | Target | Stop | Notes |
|---|---|---|---|---|---|---|---|
| LAUR | Laureate Education Inc | Business Products | $11.61 | (11.50-12.50) | 6 | 13.50 | 0 for 5'er, LT negative trend & market RS, spread triple bottom, OBOS>100%, R-R>3.0 |
| Comment | |||||||
|---|---|---|---|---|---|---|---|
|
|
|||||||
FTNT Fortinet Inc. R ($71.44) - Software - FTNT is a 5 for 5'er that ranks in the top quartile of the favored software sector matrix and has been on a peer RS buy signal since 2015. On its default chart, FTNT has completed three consecutive buy signals, most recently breaking a triple top at $72. Long exposure may be added in the high $60s to low $70s and we will set our initial stop at $60, which would take out multiple levels of support on FTNT's default chart. We will use the bullish price objective, $92, as our target price, giving us a reward-to-risk ratio approaching 2.0.
| 23 | |||||||||||||||||||||||||||||||||||||||||||||||||||||
| 74.00 | X | 74.00 | |||||||||||||||||||||||||||||||||||||||||||||||||||
| 73.00 | X | O | 73.00 | ||||||||||||||||||||||||||||||||||||||||||||||||||
| 72.00 | X | O | 72.00 | ||||||||||||||||||||||||||||||||||||||||||||||||||
| 71.00 | X | X | X | O | 71.00 | ||||||||||||||||||||||||||||||||||||||||||||||||
| 70.00 | X | O | 6 | O | X | 70.00 | |||||||||||||||||||||||||||||||||||||||||||||||
| 69.00 | • | X | X | O | X | O | X | 69.00 | |||||||||||||||||||||||||||||||||||||||||||||
| 68.00 | • | X | O | X | O | X | O | X | Mid | 68.00 | |||||||||||||||||||||||||||||||||||||||||||
| 67.00 | • | 4 | O | X | O | X | O | 67.00 | |||||||||||||||||||||||||||||||||||||||||||||
| 66.00 | • | X | O | X | O | X | 66.00 | ||||||||||||||||||||||||||||||||||||||||||||||
| 65.00 | • | X | O | X | O | 65.00 | |||||||||||||||||||||||||||||||||||||||||||||||
| 64.00 | • | • | X | O | X | 64.00 | |||||||||||||||||||||||||||||||||||||||||||||||
| 63.00 | O | • | • | X | X | X | • | X | X | O | X | • | 63.00 | ||||||||||||||||||||||||||||||||||||||||
| 62.00 | O | • | X | • | X | O | X | O | X | O | • | X | O | 3 | X | O | X | • | 62.00 | ||||||||||||||||||||||||||||||||||
| 61.00 | O | X | X | • | X | O | • | X | O | X | O | X | O | • | X | X | O | X | O | X | 5 | • | 61.00 | ||||||||||||||||||||||||||||||
| 60.00 | O | X | O | X | O | 6 | O | X | • | X | O | X | O | 8 | O | • | X | O | X | O | X | O | X | • | 60.00 | ||||||||||||||||||||||||||||
| 59.00 | O | X | O | X | O | X | O | X | O | 7 | O | X | O | X | O | • | • | X | O | X | O | O | X | • | 59.00 | ||||||||||||||||||||||||||||
| 58.00 | O | X | O | X | O | X | O | X | O | X | O | X | O | X | O | B | • | • | X | O | O | • | 58.00 | ||||||||||||||||||||||||||||||
| 57.00 | 5 | X | O | X | X | O | O | X | O | X | O | X | O | X | O | X | O | X | • | • | X | • | Bot | 57.00 | |||||||||||||||||||||||||||||
| 56.00 | O | X | O | X | O | X | O | X | O | O | • | O | • | O | X | O | X | O | • | X | • | X | • | 56.00 | |||||||||||||||||||||||||||||
| 55.00 | O | X | O | X | X | O | X | • | O | X | • | • | • | O | X | X | O | X | O | X | • | X | O | • | X | • | 55.00 | ||||||||||||||||||||||||||
| 54.00 | O | O | X | O | X | O | • | O | X | • | O | X | O | X | X | O | X | O | C | O | X | O | • | X | 2 | • | 54.00 | ||||||||||||||||||||||||||
| 53.00 | O | X | O | X | • | O | • | O | X | O | X | O | X | O | X | O | X | O | X | O | • | X | O | X | • | 53.00 | |||||||||||||||||||||||||||
| 52.00 | O | X | O | X | • | • | O | X | O | X | O | X | O | X | O | X | O | X | O | • | X | O | X | • | 52.00 | ||||||||||||||||||||||||||||
| 51.00 | O | X | O | • | O | X | O | A | O | X | O | X | O | O | O | X | X | O | • | 51.00 | |||||||||||||||||||||||||||||||||
| 50.00 | O | X | • | O | X | O | X | O | X | O | X | O | X | X | O | X | • | 50.00 | |||||||||||||||||||||||||||||||||||
| 49.00 | O | • | O | X | O | X | O | X | O | X | O | X | O | X | O | X | • | 49.00 | |||||||||||||||||||||||||||||||||||
| 48.00 | • | 9 | O | O | X | O | X | O | X | O | X | O | • | 48.00 | |||||||||||||||||||||||||||||||||||||||
| 47.00 | O | X | O | X | • | 1 | O | X | • | 47.00 | |||||||||||||||||||||||||||||||||||||||||||
| 46.00 | O | O | X | • | O | • | 46.00 | ||||||||||||||||||||||||||||||||||||||||||||||
| 45.00 | O | X | • | • | 45.00 | ||||||||||||||||||||||||||||||||||||||||||||||||
| 44.00 | O | X | • | 44.00 | |||||||||||||||||||||||||||||||||||||||||||||||||
| 43.00 | O | • | 43.00 | ||||||||||||||||||||||||||||||||||||||||||||||||||
| 23 |
| CCS Century Communities Inc ($71.85) - Building - CCS posted a double top buy signal today at $73, moving to new 2023 highs in the process. This perfect 5/5'er sits in the top half of the Building sector matrix and remains in actionable territory at current levels. Support is offered below at $69, with overhead resistance dating back to January of 2022 at $76. |
| FSLR First Solar, Inc. ($178.55) - Electronics - FSLR moved lower Monday to break a double bottom at $180 before falling to $178 intraday. This 2 for 5'er moved to an RS sell signal against its Electronics peers last week and sits in the lower quartile of that sector matrix. Weekly momentum also recently flipped negative, suggesting the potential for further weakness from here. The weight of the technical evidence is now negative and weakening. Further support may be seen at $172, with the bullish support line currently positioned at $168. Overhead resistance may be seen initially at $188. |
| LRCX Lam Research Corporation ($620.33) - Semiconductors - LRCX rose Monday to break a double top at $632, marking a sixth consecutive buy signal. This 3 for 5'er moved to a positive trend in November 2022 and ranks in the top quartile of the favored semiconductors sector RS matrix. The weight of the technical evidence continues to improve. Initial support can be seen at $600, with further support seen at $560. Note the potential for further overhead resistance at $640. |
| NUE Nucor Corporation ($155.37) - Steel/Iron - NUE gave a second consecutive buy signal on Monday when it broke a double top at $158, where it now sits against resistance. The move adds evidence to an already positive technical picture as NUE is a 4 for 5'er and move to a positive trend earlier this month. From here, the first level of support sits at $148. |
| PAG Penske Automotive Group, Inc. ($159.90) - Autos and Parts - PAG broke double top at $160 for a fourth buy signal since late March and counts as a new all-time high. The stock is a 5 for 5'er that ranks sixth (out of 58) in the Autos and Parts sector matrix and is accompanied by a yield of roughly 1.7%. Initial support lies at $152 while the bullish support line is at $138. |
| TSLA Tesla Inc. ($246.07) - Autos and Parts - TSLA broke a double bottom at $244 to complete a bullish signal reversal. This follows four consecutive buy signals and a rally up to $276, the stock's highest level since September 2022. The stock remains a 5 for 5'er after the furious run, meaning technical strength remains for intermediate to long-term holders. Short-term holders may seek to exit on the breakdown here. Support on the default chart lies at $196 and $180. |

| Name | Option Symbol | Action | Stop Loss |
|---|---|---|---|
| Fortinet Inc. - $71.06 | O: 23J70.00D20 | Buy the October 70.00 calls at 6.70 | 66.00 |
| Name | Option | Action |
|---|---|---|
|
|
||
| Name | Option Symbol | Action | Stop Loss |
|---|---|---|---|
| Halliburton Company - $31.67 | O: 23V32.00D20 | Buy the October 32.00 puts at 2.81 | 35.00 |
| Name | Option | Action |
|---|---|---|
|
|
||
| Name | Option Sym. | Call to Sell | Call Price | Investment for 500 Shares | Annual Called Rtn. | Annual Static Rtn. | Downside Protection |
|---|---|---|---|---|---|---|---|
| Northern Oil & Gas Inc. $32.07 | O: 23J34.00D20 | Oct. 34.00 | 2.25 | $15,672.45 | 23.32% | 19.02% | 5.70% |
| Name | Action |
|---|---|
| On Semiconductor Corp. (ON) - 87.52 | Sell the September 90.00 Calls. |
| Apollo Global Management Inc. (APO) - 73.00 | Sell the September 72.50 Calls. |
| Carnival Corporation (CCL) - 15.80 | Sell the September 14.00 Calls. |
| CrowdStrike Holdings, Inc. Class A (CRWD) - 143.64 | Sell the October 155.00 Calls. |
| Capital One Financial Corporation (COF) - 106.60 | Sell the September 115.00 Calls. |
| Dell Technologies Inc Class C (DELL) - 50.87 | Sell the October 50.00 Calls. |
| Tapestry Inc. (TPR) - 42.91 | Sell the November 45.00 Calls. |
| EQT Corporation (EQT) - 39.18 | Sell the September 41.00 Calls. |
| Nucor Corporation (NUE) - 153.79 | Sell the October 160.00 Calls. |
| Take-Two Interactive Software, Inc. (TTWO) - 141.85 | Sell the September 140.00 Calls. |
| Bath & Body Works Inc. (BBWI) - 37.21 | Sell the August 40.00 Calls. |
| United Airlines Holdings Inc. (UAL) - 52.65 | Sell the December 55.00 Calls. |
| EQT Corporation (EQT) - 39.18 | Sell the December 40.00 Calls. |
| Fortinet Inc. (FTNT) - 71.59 | Sell the October 75.00 Calls. |
| The Chemours Company (CC) - 33.48 | Sell the October 34.00 Calls. |
| Name | Covered Write |
|---|---|
|
|
|
Daily Equity & Market Analysis
Loading, Please Wait...
