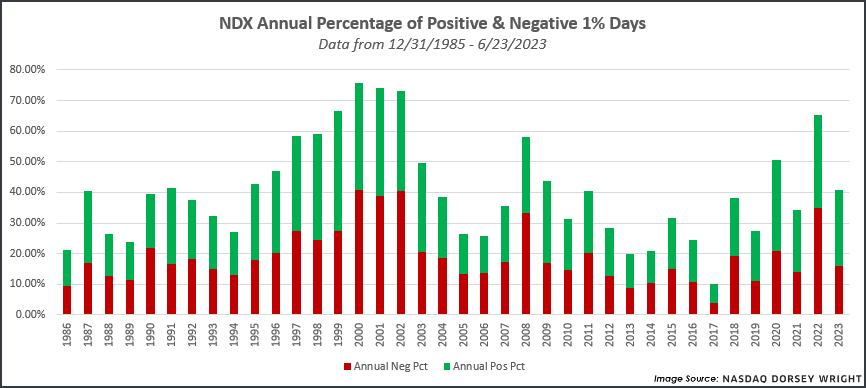
The Nasdaq-100 Index has seen roughly 40% of the trading days this year experience a gain or loss of at least 1%, which is back in line with historical averages.
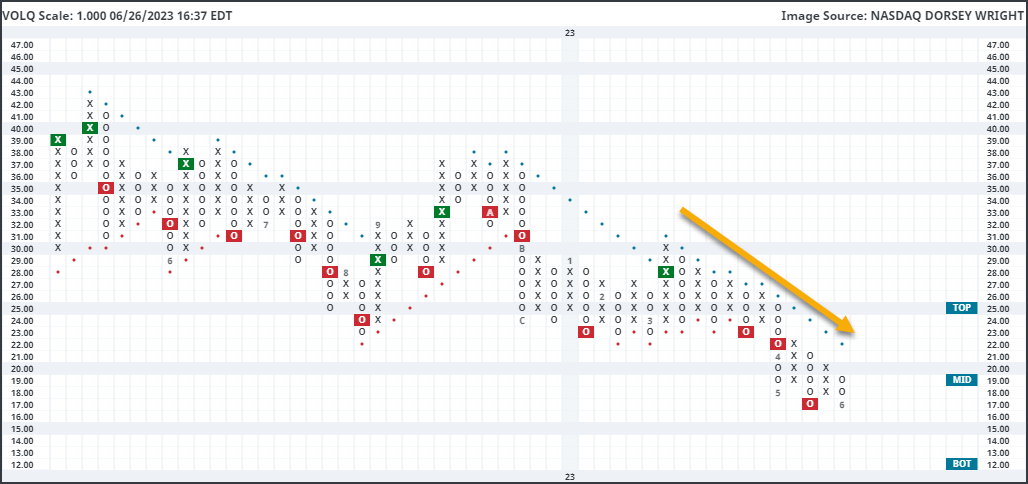
Domestic equity markets have experienced dampening volatility throughout the second quarter of the year. This has been especially evident in large-cap-focused indices, such as the Nasdaq-100 Index NDX, which has gained over 35% year-to-date through the market action on Monday, June 26. That includes an improvement of almost 13% in the second quarter alone. Meanwhile, the Nasdaq-100 Volatility Index VOLQ has continued to move steadily lower. This Index seeks to track the 30-day implied volatility for the Nasdaq-100 Index and can be viewed similarly to the VIX. Higher readings point toward higher volatility, while lower readings point toward expectations of more muted movement. Examining the 1-point chart of VOLQ clearly shows the steady decline in volatility over the past three months. The index topped out at 30 in March, moved into a negative trend later that month at $23, and most recently fell to a double bottom formation matching 52-week lows at 17. While the reading has decreased significantly, we have seen VOLQ print much lower levels at other points in recent memory. It hit 14 in the summer of 2021 and moved as low as the 10 level in December 2019. The late-2010s showed a consistently low field position for VOLQ, with its all-time low on this chart sitting at 9 in March 2017. While we have seen dampening volatility for the NDX over the past few months, we have seen lower levels during prior peaks in large-cap growth markets.

Another way to track volatility in the NDX is by counting the number of days the index sees a gain or loss exceeding 1% in value, which we examine in our NDX Volatility Study. This is meant to provide insight into the actual experience felt by investors during different market environments. So far this year, the NDX has seen 49 trading days that have moved either up or down at least 1%. That equates to roughly 40% of this year's trading days. While that may seem like a lot, it is directly in line with the average percent of volatile trading days in any year since our data began in 1986. For comparison, we saw 65% of the trading days in 2022 hit the 1% mark, which was the most in any year since 2002. Out of those volatile days seen in 2023, 30 occurred in the first quarter, while just 19 have occurred so far in the second quarter. It is an overall positive to see volatility continue to recede while the NDX has stormed higher over the past few months.
Another positive sign can be seen by breaking down the count of “extreme” days so far this year by the direction of the move. By random happenstance, the breakdown of positive to negative 1% days in 2023 directly follows the breakdown of the days in Q1 and Q2; there have been 30 positive 1% days and 19 negative 1% days. Said another way, 25% of the trading days so far this year have seen NDX move at least 1% higher, while 15.83% have seen it move at least 1% lower. That equates to a 9.17% spread between the percentage of positive days and the percentage of negative days, which is the most extensive spread favoring positive days since 2009. Only two other years have seen a larger spread, which occurred in 1998 (9.92%) and 1999 (11.90%).

The important point with this spread data is that we are seeing significantly more sharp moves higher than sharp moves lower this year, which has historically only occurred in two market environments: the formation of the dot-com bubble in the late 1990s and the bear market exit in 2009. The current market environment has been attributed to both of those timeframes. Some view the current AI-induced mania as the beginning of another bubble. It is worth pointing out that the overall percentage of 1% days experienced by the NDX would not support this theory in the same way that we saw in the late 1990s. At that time, the NDX saw the percentage of volatile days continuously elevating from 58% in 1997 to sitting north of 70% from 2000 through 2002. So, while we saw significantly more positive 1% days than negative 1% days in the final two years of the 20th century, the overall level of volatility was continuing to rise as well. Fast forwarding to the current market environment, we are faced with a very different picture. Overall volatility has come down sharply over the past few months, but the days that have been “extreme” have seen consistent movement higher.
