Most Requested Symbols

The average distribution level is 1.49%.
Today's featured stock is CBRE Group, Inc. (CBRE).
HLT, WYNN, GPC, ZTS, RJF, STLD, & RPD.
Call: CBRE Group (CBRE); Put: Bunge Limited (BG); Covered Write: Occidental Petroleum (OXY)
NDW Morning Update Video - May 24, 2023
NDW Morning Update Video – May 24, 2023.
Click here to download MP3
Upcoming Webinar: Navigating Volatile Markets - Utilizing Sector Rotation with Fixed Income
Join us on Amplify's inaugural Institutional Asset Manager webinar series on June 7 at 4 pm ET. Thought leaders for BondBloxx and Nasdaq Dorsey Wright will offer perspective on:

The battle between growth and value investing saw a change last week. The 3.25% relative strength (RS) relationship between the Vanguard Growth ETF VUG and the Vanguard Value ETF VTV moved to an RS buy signal following the market action on Thursday, May 18, favoring the growth representative for the first time in over a year. This relationship examines which of these two broad representatives, VUG or VTV, has demonstrated the most consistent outperformance and thereby is potentially a better investment. So far this year, the Vanguard Growth ETF has gained over 22%, significantly outpacing the Vanguard Value ETF at a -2% return over the same timeframe (through 5/22). This is in stark contrast to what we saw last year, as VUG returned -33% in 2022, much worse than the -4.5% drop from VTV.
This relative strength relationship between VUG and VTV has been extremely consistent over the years. If we leave out the initial buy signal given in December 1998, there have only been three prior signal changes; the relationship moved to favor value in October 2000, growth in July 2008, and then value in March 2022. Each of those signal changes also saw consecutive signals given in either direction.
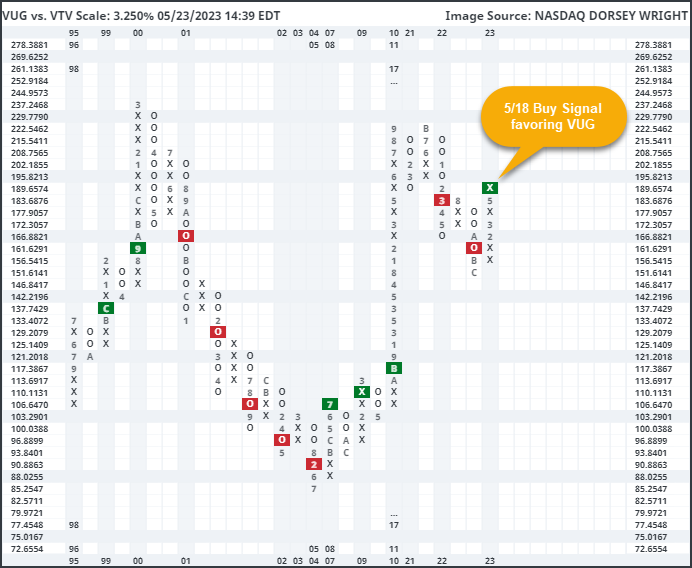
There are many ways to examine the growth/value relationship through the technical analysis lens implemented here at Nasdaq Dorsey Wright. As we covered last week, the rolling six-month performance spread between VUG and VTV has reached an extreme level. It is rare to see VUG outpace VTV by more than 20% in six months, which has only happened on four other occasions. When examined independently, that suggests it may be prudent to look toward potential “value” in the value camp. However, it is also important to note that on three of those four prior occasions, we saw the spread widen north of 35% in favor of growth before turning back around, and two of those instances saw a spread greater than 40%. Said another way, the extended growth vs. value spread has shown the potential to become more extended once reaching the current level.
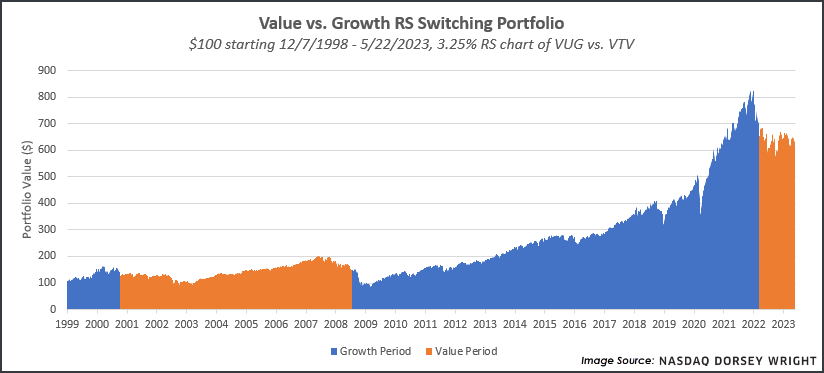
As we touched on above, the RS relationship between VUG and VTV RS has only seen four signal changes over the past 25 years, so these signals tend to last for prolonged periods of time. This RS relationship can also be used in different ways but is most helpful as an indication for further confirmation of trend establishment. Although, using it as a standalone trigger for investing in either growth or value has also proved profitable over the past two decades. To show this, we examined a hypothetical portfolio growth of $100 based on the signal changes of this RS relationship. When this chart was on a buy signal, our hypothetical portfolio owned VUG. When it moved to a sell signal, our portfolio owned VTV. As we can see below, this RS switching approach led our $100 portfolio to over $634 through the market movement Monday (5/22). While we would not suggest using this singular RS relationship to steer the value vs. growth weightings in your portfolio, the hypothetical test does show the potential effect of maintaining an objective, rules-based approach to portfolio management.

Although summer doesn’t officially begin for about another month, many Americans recognize Memorial Day as the unofficial start of the season, which is right around the corner. Many of us are looking forward to the warm weather, beach vacations, and the other usual summer activities. However, in the investment world, the summer months are associated with lackluster returns, also known as the "Summertime Blues." This year, we enter the summer months after what has been a strong start to 2023 despite poor breadth as the S&P 500 (SPX) is currently up over 9% year-to-date.
The table below shows the returns of both the Dow Jones Industrial Average and the S&P 500 during the summer months (May 31st to August 31st) back to 1981. The S&P 500 and the Dow Jones Industrial Average have each finished in negative territory in 15 of the past 41 summers (or about 37% of the time). Of those 15 down summers, there were 13 summers in which SPX and DJIA were both down at the same time. While less than half of the summers have been negative for these benchmarks, the bad summers were indeed bad, with some down double digits over the three-month period. For instance, in the summer of 1990, SPX fell -10.69%. In 1998, it saw a drop of -12.24%, but the worst summer came in 2002 during the tech crash when the index declined -14.16%. During the summer of 2008, which began a famously longer slide as SPX fell -8.39%. The market has bucked the trend over the last several years, however, 2022 was the weakest summer since 2015.

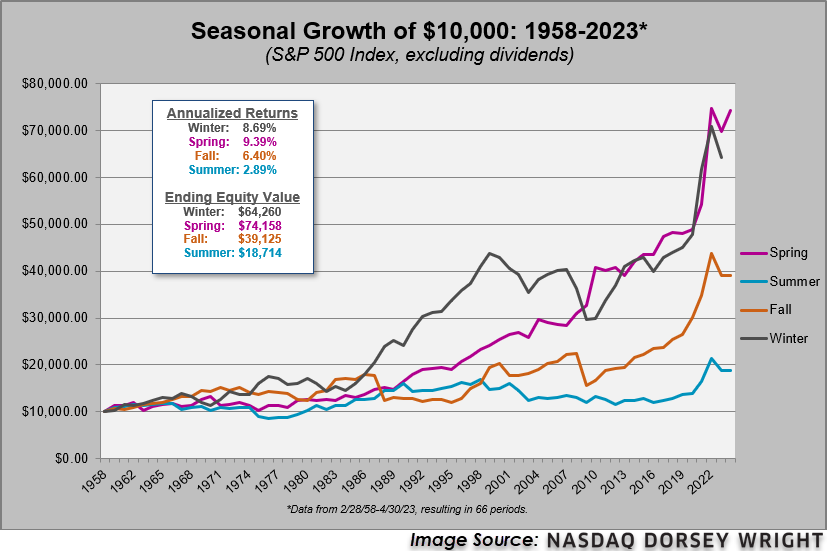
To determine if there is one month that tends to have an outsized effect on summer returns, we compiled a monthly summary of S&P 500 returns going back to 1958. What we found is that the summer months tend to have a lower median return than most of the other months of the year. It is the month of September that has historically provided the lowest median return at -0.35%, but it is followed closely by June which has a median return of just 0.08%. Notice too that the spread, i.e., the max return in a given month versus the minimum return in a given month, is relatively low for the summer months (namely June and July). A closer look at the month of June reveals a max return of 6.89% in the last 60 years, which it posted in 2019, and which followed a May return of -6.58%. Every other month, except February, had a maximum return of more than 8%. Clearly, June has historically been one of the weaker months for SPX returns. However, we can't blame the Summertime Blues on June alone. August has experienced the second-largest drawdown (after October) at -14.56%, which compares unfavorably to the other months' minimums which seem to hover around -10%.

To take this concept one step further, we looked at four hypothetical portfolios specific to each of the four seasons. Defined as follows:
Winter Portfolio Dates: 11/30 - 2/28
Spring Portfolio Dates: 2/28 - 5/31
Summer Portfolio Dates: 5/31 - 8/31
Fall Portfolio Dates: 8/31 – 11/30
The end result? The summer portfolio greatly underperformed the other three seasons - fall, winter, and spring. If you were to invest only during the spring months (March through May), the initial investment would have had a cumulative return of over 600% from 1958 through April of 2023 (since May has not yet completed), with an annualized return of 9.39%, making it the best performing seasonal portfolio. The winter portfolio deserves an honorable mention because it produced an over 500% return over the study period. The point of the graph below is to show that the summer months paled in comparison to the others, gaining just 87% since 1958 - that results in an annualized rate of return of only 2.89%.
There have been exceptions along the way (like the summers of 2020 and 2021), but the Summertime Blues have been a common occurrence for market participants over the last 60 years and the summer months have occasionally produced some significant down markets, like 2022. However, this does not mean that we should all simply go to cash at the end of every spring - faced between the summer market return or earning nothing by going to cash, on average, investors have ultimately been better off by taking the market return.
Average Level
1.49
| < - -100 | -100 - -80 | -80 - -60 | -60 - -40 | -40 - -20 | -20 - 0 | 0 - 20 | 20 - 40 | 40 - 60 | 60 - 80 | 80 - 100 | 100 - > |
|---|---|---|---|---|---|---|---|---|---|---|---|
|
Buy signalhyg
|
|||||||||||
|
Sell signalijr
|
|||||||||||
|
Buy signaldia
|
|||||||||||
|
Sell signalTLT
|
Sell signalief
|
Buy signalfxe
|
Sell signalijh
|
||||||||
|
Sell signallqd
|
Sell signaldvy
|
Buy signalUSO
|
Sell signalRSP
|
Buy signalefa
|
Buy signaloneq
|
||||||
|
Sell signalgcc
|
Sell signalgsg
|
Sell signalicf
|
Sell signaleem
|
Sell signaldx/y
|
Buy signalspy
|
Buy signalqqq
|
|||||
|
Sell signalagg
|
Buy signalshy
|
Sell signalGLD
|
Sell signaliwm
|
Buy signalVOOV
|
Buy signalvoog
|
Buy signalxlg
|
|||||
| < - -100 | -100 - -80 | -80 - -60 | -60 - -40 | -40 - -20 | -20 - 0 | 0 - 20 | 20 - 40 | 40 - 60 | 60 - 80 | 80 - 100 | 100 - > |
| AGG | iShares US Core Bond ETF |
| USO | United States Oil Fund |
| DIA | SPDR Dow Jones Industrial Average ETF |
| DVY | iShares Dow Jones Select Dividend Index ETF |
| DX/Y | NYCE U.S.Dollar Index Spot |
| EFA | iShares MSCI EAFE ETF |
| FXE | Invesco CurrencyShares Euro Trust |
| GLD | SPDR Gold Trust |
| GSG | iShares S&P GSCI Commodity-Indexed Trust |
| HYG | iShares iBoxx $ High Yield Corporate Bond ETF |
| ICF | iShares Cohen & Steers Realty ETF |
| IEF | iShares Barclays 7-10 Yr. Tres. Bond ETF |
| LQD | iShares iBoxx $ Investment Grade Corp. Bond ETF |
| IJH | iShares S&P 400 MidCap Index Fund |
| ONEQ | Fidelity Nasdaq Composite Index Track |
| QQQ | Invesco QQQ Trust |
| RSP | Invesco S&P 500 Equal Weight ETF |
| IWM | iShares Russell 2000 Index ETF |
| SHY | iShares Barclays 1-3 Year Tres. Bond ETF |
| IJR | iShares S&P 600 SmallCap Index Fund |
| SPY | SPDR S&P 500 Index ETF Trust |
| TLT | iShares Barclays 20+ Year Treasury Bond ETF |
| GCC | WisdomTree Continuous Commodity Index Fund |
| VOOG | Vanguard S&P 500 Growth ETF |
| VOOV | Vanguard S&P 500 Value ETF |
| EEM | iShares MSCI Emerging Markets ETF |
| XLG | Invesco S&P 500 Top 50 ETF |

| Symbol | Company | Sector | Current Price | Action Price | Target | Stop | Notes |
|---|---|---|---|---|---|---|---|
| GPK | Graphic Packaging Intl. | Forest Prods/Paper | $25.65 | 21 - 23 | 26 | 18 | 5 for 5'er, #2 of 15 in favored FORE sector matrix, LT pos mkt RS, triple top, 1.3% yield |
| V | Visa Inc. | Finance | $231.28 | 210s - 220s | 262 | 188 | 5 for 5'er top third of FIN sector matrix, LT pos mkt RS, spread quintuple top |
| MRK | Merck & Co., Inc. | Drugs | $114.49 | mid 100s - low 110s | 137 | 89 | 4 for 5'er top third of DRUG sector matrix, multiple consec buys, pullback from ATH, 2.7% yield |
| BJRI | BJ's Restaurants Inc. | Restaurants | $30.98 | low 30s | 55 | 26 | 3 for 5'er, top third of favored REST sector matrix, triple top, pullback from 52-week high, R-R>3.5 |
| FISV | Fiserv, Inc. | Computers | $119.54 | mid 100s - mid 110s | 123 | 91 | 5 for 5'er, top 25% of COMP sector matrix, LT pos mkt RS, pullback from 52-week high |
| TXRH | Texas Roadhouse, Inc. | Restaurants | $112.09 | 100s | 125 | 90 | 5 TA rating, top half REST sector matrix, consec. buy signals, LT RS buy, 2.10% yield |
| TTD | The Trade Desk Inc | Internet | $68.52 | hi 50s - mid 60s | 85 | 50 | 5 TA rating, top quartile of INET sector matrix, pos. trend, RS buy signal, pos. wkly mom., R-R > 2 |
| LVS | Las Vegas Sands Corp. | Gaming | $59.49 | low-to-mid 60s | 78 | 55 | 5 for 5'er, #3 of 16 in favored GAME sector matrix, quintuple top, pos wkly mom flip |
| UBS | UBS AG (Switzerland) ADR | Banks | $20.19 | 18 - 22 | 38.50 | 16 | 5 for 5'er, #5 of 126 in BANK sector matrix, bullish triangle, R-R>4.0, 2.75% yield |
| RLI | R L I Corp | Insurance | $130.04 | lo 130s - hi 140s | 190 | 112 | 5 TA rating, top quintile of INSU sector matrix, LT RS buy, pos. wkly. mom., buy-on-pullback |
| HXL | Hexcel Corporation | Aerospace Airline | $72.74 | hi 60s - mid 70s | 94 | 59 | 5 TA rating, top quintile of AERO sector matrix, pos wkly. mom., buy-on-pullback |
| DXCM | Dexcom Inc. | Healthcare | $119.29 | mid 110s - mid 120s | 154 | 102 | 5 for 5'er, top half of favored HEAL sector matrix, spread triple top, good R-R |
| FIX | Comfort Systems U.S.A. | Building | $150.99 | hi 140s - mid 150s | 198 | 126 | 5 for 5'er, 11 of 71 in BUIL sector matrix, LT pos mkt RS, spread quad top, R-R>2.0 |
| BRK.B | Berkshire Hathaway Inc | Insurance | $329.13 | mid 300s - low 330s | 396 | 280 | 5 TA rating, top third of INSU sector matrix, LT pos. trend, LT RS buy, buy-on-pullback |
| ON | On Semiconductor Corp. | Semiconductors | $85.24 | hi 70s - mid 80s | 110 | 66 | 5 for 5'er, top 25% of favored SEMI sector matrix, LT pos mkt RS, spread quintuple top, R-R>2.0 |
| CP | Canadian Pacific Railway Limited | Transports/Non Air | $81.34 | hi 70s - hi 80s | 99 | 71 | 4 TA rating, top half of TRAN sector RS matrix, LT RS buy, recent pos. monthly mom. |
| CLX | The Clorox Company | Household Goods | $162.82 | 160s | 194 | 136 | 5 for 5'er, 7th of 26 in HOUS sector matrix, RS buy signal, triple top, 2.8% yield |
| PH | Parker-Hannifin Corporation | Machinery and Tools | $334.14 | mid 320s - hi 340s | $388 | 300 | 5 TA rating, top quintile of MACH sector matrix, LT RS buy, consec. buy signals |
| AER | AerCap Holdings NV | Aerospace Airline | $58.64 | hi 50s - low 60s | 72 | 49 | 5 for 5'er, top half of AERO, sector matrix, triple top breakout |
| CBRE | CBRE Group, Inc. | Real Estate | $78.06 | 72 - low 80s | 91 | 66 | 4 TA rating, top half of REAL sector matrix, recent pos. trend, LT RS buy |
| Symbol | Company | Sector | Current Price | Action Price | Target | Stop | Notes |
|---|---|---|---|---|---|---|---|
| LAUR | Laureate Education Inc | Business Products | $12.26 | (11.50-12.50) | 6 | 13.50 | 0 for 5'er, LT negative trend & market RS, spread triple bottom, OBOS>100%, R-R>3.0, Earn. 5/4 |
| DBX | Dropbox, Inc. Class A | Software | $22.48 | low 20s | 14 | 25 | 1 for 5'er, 66 of 138 in unfavored SOFT sector matrix, LT neg mkt RS, R-R>3.5 |
| Comment | |||||||
|---|---|---|---|---|---|---|---|
|
|
|||||||
CBRE CBRE Group, Inc. R ($76.13) - Real Estate - CBRE has a favorable 4 for 5 TA rating and sits in the top half of the real estate sector RS matrix. The stock moved higher last week to break a double top at $77 before rising further to $78, which broke through the bearish resistance line and moved CBRE back to a positive trend. The recent improvement has been a steady ascent from March lows, providing several near-term support levels for further price movement. The weight of the technical evidence is favorable and continues to improve. Exposure may be considered from $72 to the low $80s. Our initial stop will be set at $66, which would violate multiple support levels and move the stock back to a negative trend. The bullish price objective of $91 will serve as our price target.
| 23 | |||||||||||||||||||||||||||||||||||||||||||||||||||||
| 89.00 | X | • | X | X | • | 89.00 | |||||||||||||||||||||||||||||||||||||||||||||||
| 88.00 | X | O | • | • | X | O | X | O | • | 88.00 | |||||||||||||||||||||||||||||||||||||||||||
| 87.00 | X | O | • | X | • | X | O | X | O | • | 87.00 | ||||||||||||||||||||||||||||||||||||||||||
| 86.00 | O | • | X | O | • | X | 2 | O | X | O | X | • | Top | 86.00 | |||||||||||||||||||||||||||||||||||||||
| 85.00 | O | X | • | X | X | O | • | X | O | X | O | O | X | O | • | 85.00 | |||||||||||||||||||||||||||||||||||||
| 84.00 | O | X | O | X | • | X | O | X | O | • | X | O | X | 3 | X | O | • | 84.00 | |||||||||||||||||||||||||||||||||||
| 83.00 | O | X | O | X | O | • | X | O | X | O | • | X | O | X | O | O | • | 83.00 | |||||||||||||||||||||||||||||||||||
| 82.00 | 5 | X | O | X | X | O | X | 8 | O | X | • | X | O | O | • | 82.00 | |||||||||||||||||||||||||||||||||||||
| 81.00 | O | O | X | O | X | 6 | X | O | X | O | • | X | • | O | • | 81.00 | |||||||||||||||||||||||||||||||||||||
| 80.00 | O | X | O | X | O | X | O | X | O | • | C | X | X | • | O | • | 80.00 | ||||||||||||||||||||||||||||||||||||
| 79.00 | O | X | O | X | O | X | O | X | O | • | X | X | O | X | O | X | • | O | • | 79.00 | |||||||||||||||||||||||||||||||||
| 78.00 | O | X | O | X | O | X | 9 | X | O | • | X | O | X | O | X | O | 1 | • | O | • | X | 78.00 | |||||||||||||||||||||||||||||||
| 77.00 | O | O | O | X | X | O | O | • | X | O | X | O | X | O | X | • | O | X | • | X | 77.00 | ||||||||||||||||||||||||||||||||
| 76.00 | O | X | O | X | • | O | X | O | X | O | O | X | • | O | X | X | O | X | X | 76.00 | |||||||||||||||||||||||||||||||||
| 75.00 | O | X | 7 | O | X | • | O | X | O | X | O | • | O | X | O | X | O | X | O | X | 75.00 | ||||||||||||||||||||||||||||||||
| 74.00 | O | X | O | X | O | • | O | X | O | X | • | O | X | O | X | 5 | X | O | X | 74.00 | |||||||||||||||||||||||||||||||||
| 73.00 | O | X | O | X | • | O | X | X | X | X | O | • | O | O | 4 | X | X | O | O | X | Mid | 73.00 | |||||||||||||||||||||||||||||||
| 72.00 | O | X | O | • | O | X | O | X | O | B | O | X | • | O | X | O | X | O | X | O | • | 72.00 | |||||||||||||||||||||||||||||||
| 71.00 | O | X | • | O | X | O | X | X | O | X | O | X | • | O | X | O | X | O | X | • | 71.00 | ||||||||||||||||||||||||||||||||
| 70.00 | O | X | • | O | A | O | X | O | X | O | X | O | X | • | O | X | O | X | O | 70.00 | |||||||||||||||||||||||||||||||||
| 69.00 | O | X | • | O | X | O | X | O | X | O | X | O | • | O | X | O | 69.00 | ||||||||||||||||||||||||||||||||||||
| 68.00 | O | • | O | X | O | X | O | X | O | • | • | O | X | 68.00 | |||||||||||||||||||||||||||||||||||||||
| 67.00 | • | O | O | O | • | • | O | 67.00 | |||||||||||||||||||||||||||||||||||||||||||||
| 23 |
| GPC Genuine Parts Company ($160.69) - Autos and Parts - GPC broke a double bottom at $162 to complete a bullish signal reversal and violate the bullish support line This will shift the trend of GPC back to negative and drop the stock to a 3 for 5'er. Support lies at current levels as well as at $154. From here, a move above $176 would flip the trend back to positive and clear notable resistance that dates to early March. |
| HLT Hilton Worldwide Holdings Inc ($138.42) - Leisure - HLT reversed into Os and broke a triple bottom at $138, returning the stock to a sell signal and flipping the trend back to negative. The stock will drop to a 4 for 5'er after what counts as the third trend reversal since the beginning of 2023. Resistance now lies from $146 to $152, the February rally high. Support lies at $130, the March low, and $124. |
| RJF Raymond James Financial Inc ($90.55) - Wall Street - RJF shares moved higher today to break a double top at $92 to mark its first buy signal. This 2 for 5'er has been in a negative trend since March but on an RS buy signal versus the market since October 2021. RJF shares are trading near the middle of their trading band with a weekly overbought/oversold reading of -1%. From here, support is offered at $82. |
| RPD Rapid7 Inc. ($42.44) - Software - RPD fell Tuesday to break a double bottom at $43, marking a second consecutive sell signal. This 2 for 5'er has been in a negative trend since May 2022 and saw weekly momentum recently flip negative, suggesting the potential for further weakness from here. Note that the stock is at support from earlier this month, with additional support offered at $38. Overhead resistance may be seen at $47 and $49, the current location of the bearish resistance line. |
| STLD Steel Dynamics Inc. ($95.65) - Steel/Iron - STLD returned to a sell signal on Tuesday, taking out two levels of support at $94 and $93, marking a new 2023 low for the stock. STLD is a 3 for 5'er and ranks 11th out of 18 names in the steel/iron sector matrix. STLD now sits against support at $92m a level it has rallied from twice previously since November of last year. |
| WYNN Wynn Resorts, Limited ($102.06) - Gaming - WYNN reversed into Os and broke a spread triple bottom at $102 for a second sell signal since meeting resistance at $116 for a fourth time earlier this month. Below $102, the March low, support isn't found on the default chart until the bullish support line at $85. Support on the 1-point per box chart lies in the $101 to $100 range. WYNN still remains a 5 for 5'er and from here, a move above $112 would return the stick to a buy signal. |
| ZTS Zoetis Inc. ($171.73) - Drugs - ZTS shares moved lower today to break a double bottom at $174 to mark its first sell signal. This 4 for 5'er has been in a positive trend but on an RS sell signal versus the market since November. ZTS shares are trading near the middle of their trading band with a weekly overbought/oversold reading of 35%. From here, support is offered at $160. |

| Name | Option Symbol | Action | Stop Loss |
|---|---|---|---|
| CBRE Group, Inc. - $76.44 | CBRE2315I80 | Buy the September 80.00 calls at 3.80 | 71.00 |
| Name | Option | Action |
|---|---|---|
| Broadcom Ltd ( AVGO) | Sep. 640.00 Calls | Raise the option stop loss to 75.30 (CP: 77.30) |
| On Semiconductor Corp. ( ON) | Sep. 80.00 Calls | Stopped at 10.85 (CP: 10.20) |
| Honeywell International, Inc. ( HON) | Sep. 190.00 Calls | Stopped at 13.60 (CP: 13.50) |
| Name | Option Symbol | Action | Stop Loss |
|---|---|---|---|
| Bunge Limited - $92.10 | BG2320V90 | Buy the October 90.00 puts at 5.50 | 96.00 |
| Name | Option | Action |
|---|---|---|
| Best Buy Co., Inc. (BBY) | Jun. 75.00 Puts | Raise the option stop loss to 4.85 (CP: 6.85) |
| NIKE, Inc. (NKE) | Jul. 120.00 Puts | Raise the option stop loss to 10.30 (CP: 12.30) |
| Apache Corporation (APA) | Jul. 40.00 Puts | Stopped at 6.45 (CP: 6.40) |
| Target Corporation (TGT) | Sep. 155.00 Puts | Raise the option stop loss to 11.10 (CP: 13.10) |
| Name | Option Sym. | Call to Sell | Call Price | Investment for 500 Shares | Annual Called Rtn. | Annual Static Rtn. | Downside Protection |
|---|---|---|---|---|---|---|---|
| Occidental Petroleum Corporation $59.04 | OXY2315I62.5 | Sep. 62.50 | 3.50 | $28,506.90 | 27.21% | 15.96% | 4.79% |
| Name | Action |
|---|---|
| Dexcom Inc. (DXCM) - 119.29 | Sell the September 125.00 Calls. |
| Array Technologies Inc (ARRY) - 24.37 | Sell the July 25.00 Calls. |
| Applied Materials, Inc. (AMAT) - 126.55 | Sell the September 130.00 Calls. |
| Amazon.com Inc. (AMZN) - 115.01 | Sell the August 120.00 Calls. |
| Advanced Micro Devices, Inc. (AMD) - 108.00 | Sell the August 115.00 Calls. |
| Tapestry Inc. (TPR) - 42.18 | Sell the November 45.00 Calls. |
| Name | Covered Write |
|---|---|
| Las Vegas Sands Corp. ( LVS - 59.49 ) | September 62.50 covered write. |
| Discover Financial Services ( DFS - 101.06 ) | October 105.00 covered write. |
Daily Equity & Market Analysis
Loading, Please Wait...
