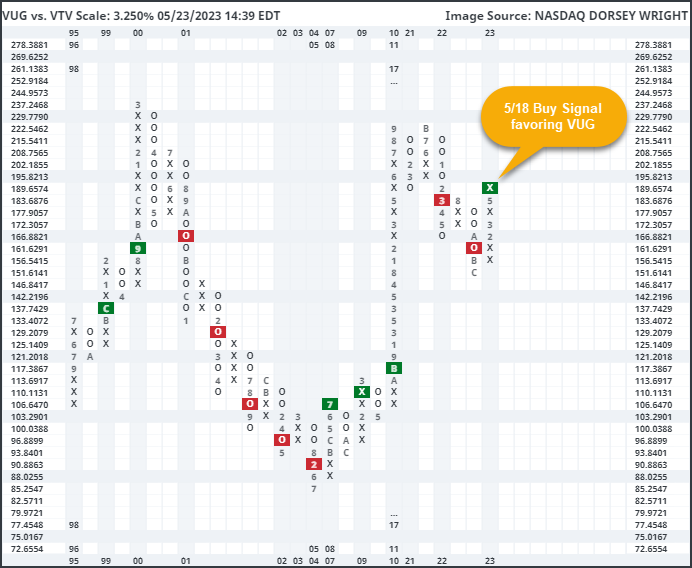
The RS relationship between broad Growth (VUG) and Value (VTV) moved back to a buy signal last week, favoring Growth for the first time in over a year.
Upcoming Webinar: Navigating Volatile Markets - Utilizing Sector Rotation with Fixed Income
Join us on Amplify's inaugural Institutional Asset Manager webinar series on June 7 at 4 pm ET. Thought leaders for BondBloxx and Nasdaq Dorsey Wright will offer perspective on:
- Why sectors matter in high yield
- How tactical allocation and sector rotation can be effective strategies for optimizing fixed-income investments
- How to apply these strategies to your portfolio through the NDW BondBloxx High Yield Sector Rotation ETF Model

The battle between growth and value investing saw a change last week. The 3.25% relative strength (RS) relationship between the Vanguard Growth ETF VUG and the Vanguard Value ETF VTV moved to an RS buy signal following the market action on Thursday, May 18, favoring the growth representative for the first time in over a year. This relationship examines which of these two broad representatives, VUG or VTV, has demonstrated the most consistent outperformance and thereby is potentially a better investment. So far this year, the Vanguard Growth ETF has gained over 22%, significantly outpacing the Vanguard Value ETF at a -2% return over the same timeframe (through 5/22). This is in stark contrast to what we saw last year, as VUG returned -33% in 2022, much worse than the -4.5% drop from VTV.
This relative strength relationship between VUG and VTV has been extremely consistent over the years. If we leave out the initial buy signal given in December 1998, there have only been three prior signal changes; the relationship moved to favor value in October 2000, growth in July 2008, and then value in March 2022. Each of those signal changes also saw consecutive signals given in either direction.
There are many ways to examine the growth/value relationship through the technical analysis lens implemented here at Nasdaq Dorsey Wright. As we covered last week, the rolling six-month performance spread between VUG and VTV has reached an extreme level. It is rare to see VUG outpace VTV by more than 20% in six months, which has only happened on four other occasions. When examined independently, that suggests it may be prudent to look toward potential “value” in the value camp. However, it is also important to note that on three of those four prior occasions, we saw the spread widen north of 35% in favor of growth before turning back around, and two of those instances saw a spread greater than 40%. Said another way, the extended growth vs. value spread has shown the potential to become more extended once reaching the current level.
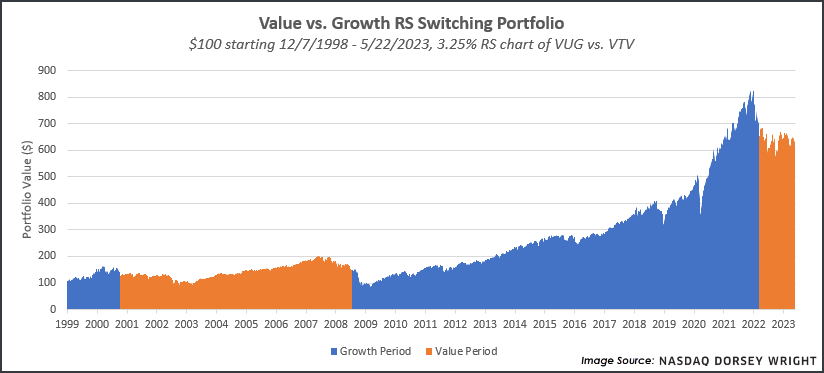
As we touched on above, the RS relationship between VUG and VTV RS has only seen four signal changes over the past 25 years, so these signals tend to last for prolonged periods of time. This RS relationship can also be used in different ways but is most helpful as an indication for further confirmation of trend establishment. Although, using it as a standalone trigger for investing in either growth or value has also proved profitable over the past two decades. To show this, we examined a hypothetical portfolio growth of $100 based on the signal changes of this RS relationship. When this chart was on a buy signal, our hypothetical portfolio owned VUG. When it moved to a sell signal, our portfolio owned VTV. As we can see below, this RS switching approach led our $100 portfolio to over $634 through the market movement Monday (5/22). While we would not suggest using this singular RS relationship to steer the value vs. growth weightings in your portfolio, the hypothetical test does show the potential effect of maintaining an objective, rules-based approach to portfolio management.