
One year ago, almost to the day, we were talking about the technical weakness from homebuilder stocks. That downtrend worsened as it continued for most of 2022; however, in November we began to see constructive moves from Homebuilders and that technical strength remains intact today.
One year ago, almost to the day, we were talking about the technical weakness from homebuilder stocks. That downtrend worsened as it continued for most of 2022; however, in November we began to see constructive moves from Homebuilders and that technical strength remains intact today.
Below is a Point & Figure chart of the SPDR S&P Homebuilders ETF (XHB). For background, “the fund seeks to provide exposure to the homebuilders segment of the S&P TMI, comprising the Homebuilding sub-industry, and may include exposure to the Building Products, Home Furnishings, Home Improvement Retail, Home Furnishing Retail, and Household Appliances sub-industries” (ssga.com). As previously mentioned, the recent technical strength is notable given a string of five consecutive Point & Figure buy signals and a fund score of 4.33. Additionally, note that XHB recently rallied above its August 2022 chart high at $68, a material point of resistance, and has since pulled back (earlier this week) to that prior area of resistance.
There is little to say negative about this chart, but if we were to nitpick, the recent pullback came after a test of the March 2022 high at $72. Like with other charts, the March 2022 highs are another notable area of resistance and market memory. Furthermore, even if XHB was able to break through its March highs at $72, it would still sit roughly 20% away from its all-time chart highs from December 2021 at $86.

Before moving forward with the technical talk and some long ideas, it’s worth stepping back to consider what could be catalyzing this rally. After all, a 14% year-to-date gain (through 2/9) and a nearly 20% run since the end of October 2022 does not happen without some type of rationale.
Admittedly, there are a variety of potential tailwinds, but the most prominent is likely the recent decline in interest rates - more specifically, the softening in mortgage rates. In short, cheaper debt/financing options make purchasing a home more affordable for more people, which in turn helps builders sell more homes. The line chart below plots the average 30YR Fixed Rate Mortgage in the United States, and as called out, in November 2022 rates peaked which is about when homebuilder stocks put in their latest bottom.
However, notice that since last Friday’s (2/3) huge nonfarm payroll beat (517k vs 185k consensus) homebuilder stocks have slid…not enough to give Point & Figure sell signals or break trend, but enough to expose their current sensitivity to potential changes in interest rates. The connection here is that a persistently strong labor market gives the Fed more leash to keep hiking rates. From 2/3 – 2/9, XHB is down 3.22% while the S&P 500 has lost just 1.28%.
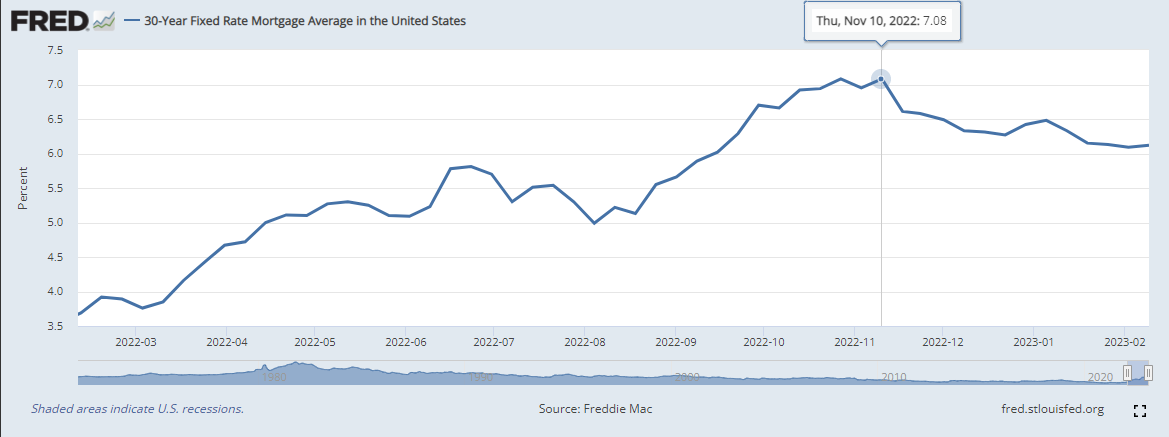
On November 17, 2022, Freddie Mac changed the methodology of the Primary Mortgage Market Survey® (PMMS®). The weekly mortgage rate is now based on applications submitted to Freddie Mac from lenders across the country. The takeaway here is the same, as confirmable in recent treasury yield movement, but this adjustment should be noted. For more information regarding Freddie Mac’s enhancement, see their research note.
It is important to distinguish homebuilder stocks from real estate stocks, especially in today’s discussion, because the two spaces can easily overlap mentally when talking about macro tailwinds like interest rates. However, when looking beneath the hood of sector funds it becomes a bit easier to make separation. For example, the holdings of the Real Estate Select Sector SPDR Fund (XLRE) are predominantly REITs (Real Estate Investment Trusts) while those underlying the SPDR Homebuilders ETF (XHB) tend to lean and act more consumer discretionary. Two explicit examples are Home Depot (HD) and Lowe’s (LOW), each of which are holdings in XHB.
At a fund level, with a score north of 4.0 XHB looks like the better investment right now compared to XLRE’s fund score of 1.09, despite the recent breakout into a positive trend. Within XHB, there are plenty of stocks to pick from if wanting individual exposure. In fact, over 90% trade on Point & Figure buy signals and 96% trade in a positive trend. A couple of our favorites are highlighted below, each reversing large downtrends from 2022.
Builders FirstSource (BLDR), a manufacturer and supplier of building materials, has been a high attribute stock (rated as a 3 or better) consistently since April 2020 - since November 10th of 2022 it has been rated a perfect 5 for 5’er. Action in January/early February ran the stock within a few percent of its all-time chart high at $86, but BLDR recently pulled back out of overbought territory towards its March 2022 highs in the upper $70 range. Due to the exhale, those interested in taking long exposure may begin doing so here. Additional positions could be established with a reversal up into Xs, which would create a higher level of support. Note earnings are expected on 2/28.
D.R. Horton (DHI) is another positive standout with a 4 for 5 technical attribute rating. Recent market action also led this name to within several percent of its all-time chart high first reached in December 2021. DHI pulled back into Os earlier this week which creates a more actionable entry point for those seeking fresh exposure.

