Most Requested Symbols

The average distribution level is 15.68%.
Today's featured stock is Illinois Tool Works Inc.(ITW).
AER, ALB, AZO, BFAM, CCK, ECL, FCX, LQDT, and MSI
Call: Lennar Corporation (LEN); Put: CSX Corporation (CSX); Covered Write: Steel Dynamics Inc (STLD).
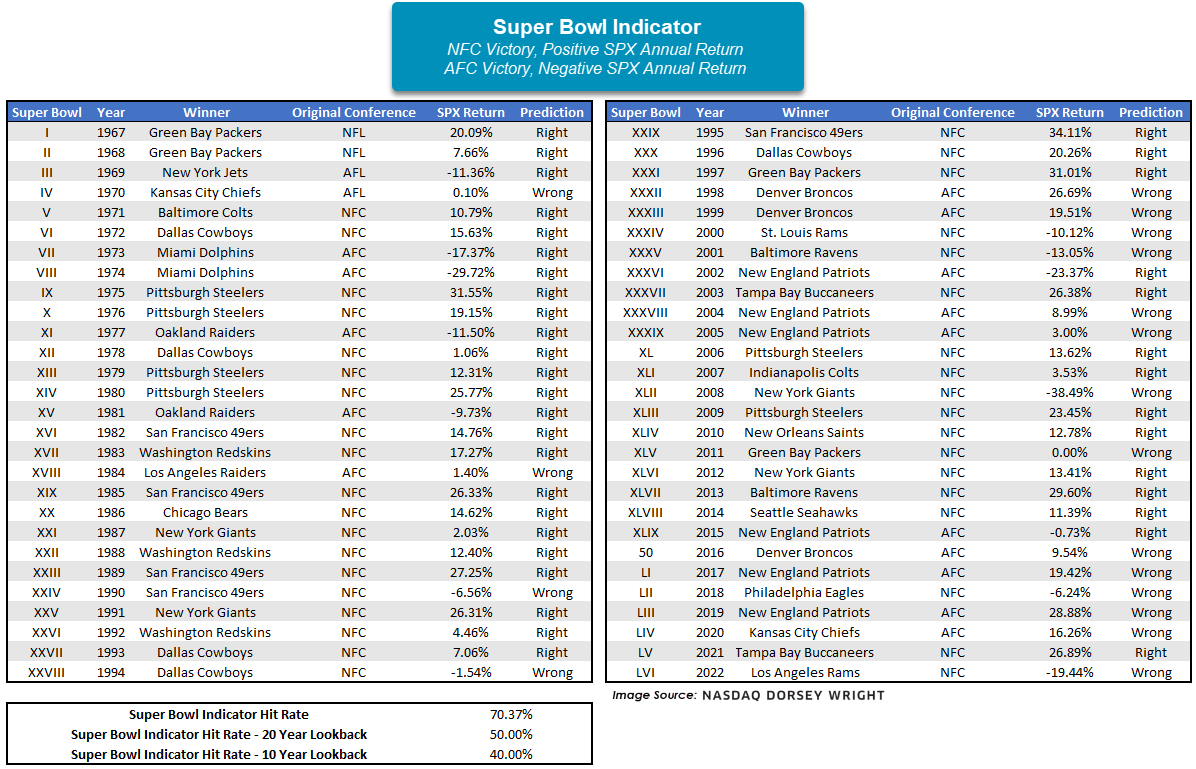
As longtime readers of this report are aware, there is an unofficial market indicator known as the Super Bowl Indicator, first introduced in 1978 by Leonard Koppett, a sportswriter for The New York Times. The indicator suggests that if a team from the American Football Conference (AFC) wins, then there is a gloomy outlook for the stock market, defined by the S&P 500 Index (SPX) for the rest of the year. Conversely, if a team that was in the NFL before the NFL/AFL merger OR a team from the National Football Conference (NFC) wins, it will be a positive year for the market.
On Sunday, the Kansas City Chiefs will represent the AFC for the third time in the past four years and the Philadelphia Eagles will represent the NFC for the first time since 2018. After the Eagles won that Super Bowl in 2018, the SPX ended the year with an annual decline of -6.24%, marking a false reading from the Super Bowl Indicator. The Chief’s last victory in 2020 also proved to be a false indicator, as the S&P 500 ended that year up over 16%. Over the last 20 years, this ‘Indicator’ has seen an equal split between right and wrong indications, with the last correct “signal” occurring with the Buccaneers’ win in 2021. However, going back to Super Bowl I, it has been correct about 70% of the time. Pure coincidence? Almost certainly. But if you don't have an allegiance with either team playing Sunday, you may want to cheer for the Eagles to take home the Lombardi trophy in hopes this will lead to positive domestic equity returns throughout the rest of the year.

One year ago, almost to the day, we were talking about the technical weakness from homebuilder stocks. That downtrend worsened as it continued for most of 2022; however, in November we began to see constructive moves from Homebuilders and that technical strength remains intact today.
Below is a Point & Figure chart of the SPDR S&P Homebuilders ETF (XHB). For background, “the fund seeks to provide exposure to the homebuilders segment of the S&P TMI, comprising the Homebuilding sub-industry, and may include exposure to the Building Products, Home Furnishings, Home Improvement Retail, Home Furnishing Retail, and Household Appliances sub-industries” (ssga.com). As previously mentioned, the recent technical strength is notable given a string of five consecutive Point & Figure buy signals and a fund score of 4.33. Additionally, note that XHB recently rallied above its August 2022 chart high at $68, a material point of resistance, and has since pulled back (earlier this week) to that prior area of resistance.
There is little to say negative about this chart, but if we were to nitpick, the recent pullback came after a test of the March 2022 high at $72. Like with other charts, the March 2022 highs are another notable area of resistance and market memory. Furthermore, even if XHB was able to break through its March highs at $72, it would still sit roughly 20% away from its all-time chart highs from December 2021 at $86.

Before moving forward with the technical talk and some long ideas, it’s worth stepping back to consider what could be catalyzing this rally. After all, a 14% year-to-date gain (through 2/9) and a nearly 20% run since the end of October 2022 does not happen without some type of rationale.
Admittedly, there are a variety of potential tailwinds, but the most prominent is likely the recent decline in interest rates - more specifically, the softening in mortgage rates. In short, cheaper debt/financing options make purchasing a home more affordable for more people, which in turn helps builders sell more homes. The line chart below plots the average 30YR Fixed Rate Mortgage in the United States, and as called out, in November 2022 rates peaked which is about when homebuilder stocks put in their latest bottom.
However, notice that since last Friday’s (2/3) huge nonfarm payroll beat (517k vs 185k consensus) homebuilder stocks have slid…not enough to give Point & Figure sell signals or break trend, but enough to expose their current sensitivity to potential changes in interest rates. The connection here is that a persistently strong labor market gives the Fed more leash to keep hiking rates. From 2/3 – 2/9, XHB is down 3.22% while the S&P 500 has lost just 1.28%.
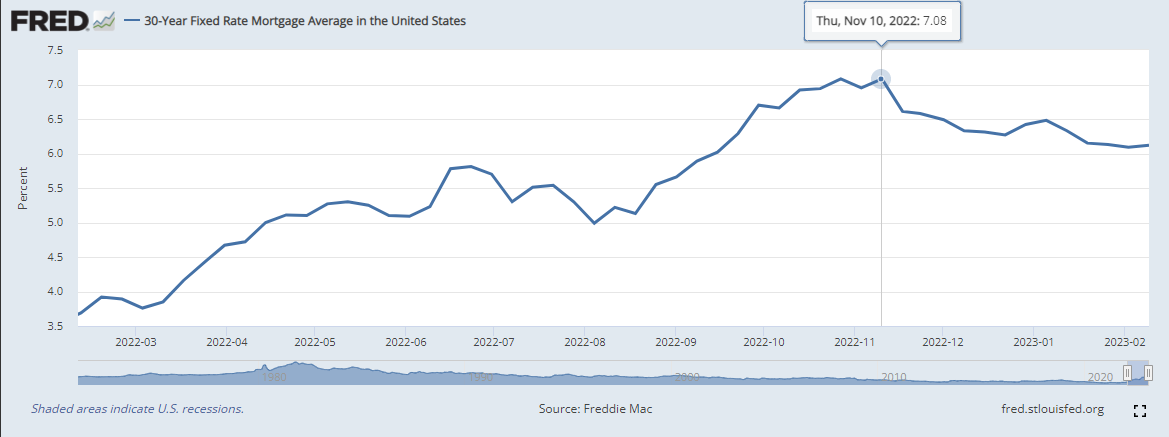
On November 17, 2022, Freddie Mac changed the methodology of the Primary Mortgage Market Survey® (PMMS®). The weekly mortgage rate is now based on applications submitted to Freddie Mac from lenders across the country. The takeaway here is the same, as confirmable in recent treasury yield movement, but this adjustment should be noted. For more information regarding Freddie Mac’s enhancement, see their research note.
It is important to distinguish homebuilder stocks from real estate stocks, especially in today’s discussion, because the two spaces can easily overlap mentally when talking about macro tailwinds like interest rates. However, when looking beneath the hood of sector funds it becomes a bit easier to make separation. For example, the holdings of the Real Estate Select Sector SPDR Fund (XLRE) are predominantly REITs (Real Estate Investment Trusts) while those underlying the SPDR Homebuilders ETF (XHB) tend to lean and act more consumer discretionary. Two explicit examples are Home Depot (HD) and Lowe’s (LOW), each of which are holdings in XHB.
At a fund level, with a score north of 4.0 XHB looks like the better investment right now compared to XLRE’s fund score of 1.09, despite the recent breakout into a positive trend. Within XHB, there are plenty of stocks to pick from if wanting individual exposure. In fact, over 90% trade on Point & Figure buy signals and 96% trade in a positive trend. A couple of our favorites are highlighted below, each reversing large downtrends from 2022.
Builders FirstSource (BLDR), a manufacturer and supplier of building materials, has been a high attribute stock (rated as a 3 or better) consistently since April 2020 - since November 10th of 2022 it has been rated a perfect 5 for 5’er. Action in January/early February ran the stock within a few percent of its all-time chart high at $86, but BLDR recently pulled back out of overbought territory towards its March 2022 highs in the upper $70 range. Due to the exhale, those interested in taking long exposure may begin doing so here. Additional positions could be established with a reversal up into Xs, which would create a higher level of support. Note earnings are expected on 2/28.
D.R. Horton (DHI) is another positive standout with a 4 for 5 technical attribute rating. Recent market action also led this name to within several percent of its all-time chart high first reached in December 2021. DHI pulled back into Os earlier this week which creates a more actionable entry point for those seeking fresh exposure.

| Symbol | Name | Price | Yield | PnF Trend | RS Signal | RS Col. | Fund Score | 200 Day MA | Weekly Mom |
|---|---|---|---|---|---|---|---|---|---|
| DIA | SPDR Dow Jones Industrial Average ETF Trust | 337.08 | 1.87 | Positive | Sell | O | 2.66 | 323.38 | -1W |
| EEM | iShares MSCI Emerging Markets ETF | 40.58 | 2.30 | Positive | Sell | X | 3.48 | 39.09 | -1W |
| EFA | iShares MSCI EAFE ETF | 70.98 | 2.47 | Positive | Sell | X | 4.30 | 64.48 | +4W |
| FM | iShares MSCI Frontier and Select EM ETF | 25.71 | 2.62 | Positive | Sell | O | 1.84 | 26.69 | -1W |
| IJH | iShares S&P MidCap 400 Index Fund | 262.44 | 1.54 | Positive | Sell | X | 4.36 | 243.63 | +4W |
| IJR | iShares S&P SmallCap 600 Index Fund | 103.39 | 1.29 | Positive | Sell | O | 3.32 | 97.34 | +4W |
| QQQ | Invesco QQQ Trust | 301.68 | 0.72 | Positive | Sell | O | 2.68 | 290.92 | +4W |
| RSP | Invesco S&P 500 Equal Weight ETF | 150.50 | 1.69 | Positive | Buy | X | 5.31 | 142.12 | +4W |
| SPY | SPDR S&P 500 ETF Trust | 407.09 | 1.56 | Positive | Sell | O | 2.70 | 393.61 | +4W |
| XLG | Invesco S&P 500 Top 50 ETF | 299.15 | 1.25 | Positive | Sell | O | 2.52 | 293.78 | +4W |
The SPDR Dow Jones Industrial Average ETF Trust DIA remains unchanged this week, sitting in a column of O’s at a price of $330. The fund has a current score of 2.66 with a negative score direction of -0.66, and it now scores below the average US score of 3.26. DIA remains in a positive trend at current levels. Support is offered at $290 on the default chart, the September 2022 chart low, with overhead resistance at $345.
The iShares MSCI Emerging Markets ETF EEM remains in a column of Os this week and is sitting at a price of $40. EEM is trading on three consecutive buy signals and in a positive trend to start the year. Support is now seen at a price of $38.00, the December lows.
The iShares MSCI EAFE ETF EFA sits in a column of X’s this week at an unchanged price of $72.00. The fund remains in a positive trend at current levels and now sits at more actionable territory with a weekly OBOS reading of 56%. The fund now showcases a strong 4.30 fund score, outpacing the average non-US score of 3.21. Support is offered at $55 on the default chart.
The iShares MSCI Frontier and Select EM ETF FM reversed down into a column of O’s this week, its first chart action since mid-January. The fund has a weak score of 1.84 but is paired with a positive 0.40 score direction. FM is now seen at a price of $25.50. Support is seen below at $23.50, lows for 2022.
The iShares S&P MidCap 400 Index Fund IJH remains in a column of X’s this week, trading on a buy signal and in a positive trend. The fund has a current fund score of 4.36, above the average US score of 3.26. Support can be found at $240 on the default chart, the December 2022 lows.
The iShares S&P SmallCap 600 Index Fund IJR rests in a column of X’s and sits at an unchanged price of $108. The fund showcases an acceptable 3.32 fund score after breaking a string of 2 consecutive sell signals and breaking back into a positive trend with recent action. Support is offered at $98 on the default trend chart with overhead resistance at $110, the March 2022 highs.
The Invesco QQQ Trust QQQ remains in a column of X’s this week, sitting at a price of $310. QQQ moved to a positive trend earlier this month but still has an unacceptable fund score of 2.68. The current fund score is lower than the average US fund (3.26), and the fund holds a now positive 1.39 score direction. Initial support is offered at $260.
The Invesco S&P 500 Equal Weight ETF RSP remains in a column of X’s this week, sitting at a price of $154, having returned to a buy signal at breaking a triple top at $152 earlier this month. RSP holds a positive 1.48 score direction and has a fund score of 5.31. This beats the average S&P 500 Index fund score of 3.59 and remains the highest score of the funds in this report. Support is seen at $140 on the default chart.
The SPDR S&P 500 ETF Trust SPY remains in a column of X’s this week, the fund recently returned to a buy signal after breaking a triple top at $415. The fund has a 2.70 score posting which is below the average S&P 500 Index fund score of 3.59. Support is seen at $375 on the default chart, December 2022 lows.
The Invesco S&P 500 Top 50 ETF XLG remains on a string of two consecutive buy signals this week, sitting at a price of $305. XLG now has a 2.52 fund score with a now positive score direction of 0.92. XLG still scores below the average US Fund (3.26). Support is seen at $275 on the default chart.

Average Level
15.68
| < - -100 | -100 - -80 | -80 - -60 | -60 - -40 | -40 - -20 | -20 - 0 | 0 - 20 | 20 - 40 | 40 - 60 | 60 - 80 | 80 - 100 | 100 - > |
|---|---|---|---|---|---|---|---|---|---|---|---|
|
Buy signalief
|
|||||||||||
|
Buy signalgcc
|
Buy signaleem
|
||||||||||
|
Sell signalgsg
|
Buy signalvoog
|
Buy signalijr
|
|||||||||
|
Buy signaltlt
|
Buy signalhyg
|
Buy signalRSP
|
Buy signalijh
|
||||||||
|
Sell signaldx/y
|
Sell signaldvy
|
Buy signalicf
|
Buy signalxlg
|
||||||||
|
Sell signallqd
|
Buy signaldia
|
Buy signalspy
|
Buy signaloneq
|
||||||||
|
Sell signalagg
|
Buy signalgld
|
Buy signalVOOV
|
Buy signalefa
|
||||||||
|
Buy signalshy
|
Buy signaluso
|
Buy signalfxe
|
Buy signaliwm
|
Buy signalqqq
|
|||||||
| < - -100 | -100 - -80 | -80 - -60 | -60 - -40 | -40 - -20 | -20 - 0 | 0 - 20 | 20 - 40 | 40 - 60 | 60 - 80 | 80 - 100 | 100 - > |
| AGG | iShares US Core Bond ETF |
| USO | United States Oil Fund |
| DIA | SPDR Dow Jones Industrial Average ETF |
| DVY | iShares Dow Jones Select Dividend Index ETF |
| DX/Y | NYCE U.S.Dollar Index Spot |
| EFA | iShares MSCI EAFE ETF |
| FXE | Invesco CurrencyShares Euro Trust |
| GLD | SPDR Gold Trust |
| GSG | iShares S&P GSCI Commodity-Indexed Trust |
| HYG | iShares iBoxx $ High Yield Corporate Bond ETF |
| ICF | iShares Cohen & Steers Realty ETF |
| IEF | iShares Barclays 7-10 Yr. Tres. Bond ETF |
| LQD | iShares iBoxx $ Investment Grade Corp. Bond ETF |
| IJH | iShares S&P 400 MidCap Index Fund |
| ONEQ | Fidelity Nasdaq Composite Index Track |
| QQQ | Invesco QQQ Trust |
| RSP | Invesco S&P 500 Equal Weight ETF |
| IWM | iShares Russell 2000 Index ETF |
| SHY | iShares Barclays 1-3 Year Tres. Bond ETF |
| IJR | iShares S&P 600 SmallCap Index Fund |
| SPY | SPDR S&P 500 Index ETF Trust |
| TLT | iShares Barclays 20+ Year Treasury Bond ETF |
| GCC | WisdomTree Continuous Commodity Index Fund |
| VOOG | Vanguard S&P 500 Growth ETF |
| VOOV | Vanguard S&P 500 Value ETF |
| EEM | iShares MSCI Emerging Markets ETF |
| XLG | Invesco S&P 500 Top 50 ETF |
| Symbol | Company | Sector | Current Price | Action Price | Target | Stop | Notes |
|---|---|---|---|---|---|---|---|
| GPK | Graphic Packaging Intl. | Forest Prods/Paper | $23.20 | 21 - 23 | 26 | 18 | 5 for 5'er, #2 of 15 in favored FORE sector matrix, LT pos mkt RS, triple top, 1.3% yield |
| RF | Regions Financial Corporation | Banks | $23.53 | low 20s | 32.50 | 17.50 | 4 for 5'er, top half of favored BANK sector matrix, one box from RS buy signal, R-R>3.0, 3.6% yield |
| AES | The AES Corporation | Utilities/Electricity | $25.58 | lo-mid 20s | 43.50 | 18.50 | 5 TA rating, top quintile EUTI sector, buy-on-pullback, 2.52% yield, R-R > 4.5, Earn. 2/27 |
| PGR | The Progressive Corporation | Insurance | $137.18 | low 120s - low 130s | 168 | 106 | 4 for 5'er, top quartile of favored INSU sector matrix, one box from mkt RS buy, spread triple top |
| BDX | Becton, Dickinson and Company | Healthcare | $245.23 | 240s - mid 250s | 308 | 212 | 5 for 5'er, LT pos mkt RS, quad top breakout, pos trend change, 1.5% yield, |
| EAT | Brinker International Inc | Restaurants | $40.67 | mid 30s | 56 | 27 | 4 TA rating, top quintile REST sector matrix, 4 consec. buy signals, R-R > 2, |
| TECK | Teck Resources Limited | Metals Non Ferrous | $42.00 | mid-to-high $30s | 51 | 31 | 5 for 5'er, top half of favored META sector matrix, triple top, pos trend flip, R-R>2.0, Earn. 2/21 |
| COHU | Cohu, Inc. | Semiconductors | $36.65 | mid 30s | 51 | 29 | 4 for 5'er. top 10% of SEMI sector matrix, big base breakout, R-R>2.5, Earn. 2/16 |
| TJX | The TJX Companies, Inc. | Retailing | $80.76 | 77 - 81 | 94 | 62 | 4 for 5'er, top quintile of RETA sector matrix, multiple consec buy signals, 1.5% yield. Earn. 2/21 |
| TRI | Thomson Reuters Corporation | Media | $114.96 | hi 100s - mid 110s | 91 | 4 for 5'er, 5th of 44 in MEDI sector matrix, one box from mkt RS buy signal, bullish triangle, R-R>2.0, 1.6% yield, Earn. 2/9 | |
| TSCO | Tractor Supply Company | Retailing | $233.76 | mid 210s - high 230s | 298 | 186 | 5 TA rating, LT market RS buy, recent peer RS buy, top half RETA sector matrix |
| MSI | Motorola Solutions Inc. | Telephone | $257.15 | hi 240s - lo 270s | 316 | 212 | 5 TA rating, top decile of TELE sector matrix, consec. buy signals, LT mkt RS buy, Earn. 2/9 |
| AON | Aon Corporation | Insurance | $317.38 | mid 290s - low 310s | 324 | 264 | 4 for 5'er, top half of favored INSU sector matrix, one box from mkt RS buy signal, bullish catapult |
| V | Visa Inc. | Finance | $229.35 | 210s - 220s | 262 | 188 | 5 for 5'er top third of FIN sector matrix, LT pos mkt RS, spread quintuple top |
| APO | Apollo Global Management Inc. | Wall Street | $68.40 | mid 60s - low 70s | 92 | 56 | 5 TA rating, 5 consec. buy signals, LT RS buy, 2.41% yield, R-R > 2 |
| AME | Ametek Inc | Electronics | $144.36 | hi 130s - lo 150s | 186 | 124 | 5 TA rating, top half of ELEC sector matrix, 4 consec. buys, recent pos. wkly mom., LT RS buy, |
| ADC | Agree Realty Corporation | Real Estate | $71.80 | low-to-mid $70s | 88 | 63 | 4 for 5'er, top half of REAL sector matrix. multiple consec buy signals, 3.9% yield, Earn. 2/14 |
| DKS | Dick's Sporting Goods, Inc. | Retailing | $129.79 | lo 120s - mid 130s | 176 | 106 | 5 TA rating, top quintile of RETA sector matrix, R-R > 2.50, Earn. 3/7 |
| AVGO | Broadcom Ltd | Semiconductors | $599.41 | mid 560s - lo 620s | 696 | 496 | 5 TA rating, top half SEMI sector matrix, fifth consec. buy signal, bullish triangle, LT mkt RS buy, Earn. 3/2 |
| UNVR | Univar Solutions Inc. | Chemicals | $33.12 | mid-30s | 59 | 28 | 5 TA rating, top decile CHEM sector, consec. buy signals, recent pos. wkly mom., R-R > 3, Earn. 2/21 |
| CMI | Cummins Inc. | Machinery and Tools | $246.16 | 240 - 260 | 300 | 212 | 4 for 5'er, top half of favored MACH sector matrix, triple top, 2.45% yield |
| TT | Trane Technologies PLC | Machinery and Tools | $181.56 | mid 170s - mid 180s | 228 | 158 | 5 for 5'er, top half of favored MACH sector matrix, LT pos mkt RS, big base breakout, buy on pullback, 1.45% yield |
| OLN | Olin Corp | Chemicals | $60.09 | upper 50s - low 60s | 85 | 50 | 5 TA rating, top 20% of Chemicals sector matrix, buy-on-pullback, R-R > 2 |
| ITW | Illinois Tool Works Inc. | Machinery and Tools | $235.01 | 220s - 240s | - | 194 | 3 for 5'er, favored MACH sector, LT pos mkt RS, multiple consec buy signals, pullback from ATH, 2.2% yield |
| Symbol | Company | Sector | Current Price | Action Price | Target | Stop | Notes |
|---|---|---|---|---|---|---|---|
| GO | Grocery Outlet Holding Corp. | Retailing | $29.88 | (29 - 32) | 17 | 36 | 0 for 5'er, bottom decile of RETA sector matrix, LT neg market RS, R-R>2.0, Earn. 2/27 |
| Comment | |||||||
|---|---|---|---|---|---|---|---|
|
|
|||||||
ITW Illinois Tool Works Inc. R ($235.40) - Machinery and Tools - ITW is a 3 for 5'er, member of the favored machinery and tools sector matrix, that has been on a market RS buy since 2016. ON its default chart, ITW has completed four consecutive buy signals, most recently breaking a double top at $236, which carries the stock to a new all-time high and heavily overbought territory. The stock subsequently pulled back to the mid $230s, offering an try point for new long exposure. Positions may be added in the mid $220s to low $240s and we will set our initial stop at $194, the potential trend line violation on ITW's default chart. ITW also carries a 2.2% yield.
| 21 | 22 | 23 | |||||||||||||||||||||||||||||||||||||||||||||||||||
| 252.00 | • | X | Top | 252.00 | |||||||||||||||||||||||||||||||||||||||||||||||||
| 248.00 | X | • | • | X | O | 248.00 | |||||||||||||||||||||||||||||||||||||||||||||||
| 244.00 | X | C | O | X | • | X | O | 244.00 | |||||||||||||||||||||||||||||||||||||||||||||
| 240.00 | X | X | O | X | O | 2 | O | • | 2 | O | 240.00 | ||||||||||||||||||||||||||||||||||||||||||
| 236.00 | 5 | O | X | O | X | 1 | X | O | • | X | O | 236.00 | |||||||||||||||||||||||||||||||||||||||||
| 232.00 | 4 | O | 8 | B | O | O | X | O | • | X | X | 232.00 | |||||||||||||||||||||||||||||||||||||||||
| 228.00 | X | O | X | O | X | O | O | • | X | 1 | O | X | 228.00 | ||||||||||||||||||||||||||||||||||||||||
| 224.00 | X | X | 6 | X | O | X | O | • | X | O | X | O | X | Mid | 224.00 | ||||||||||||||||||||||||||||||||||||||
| 220.00 | X | O | X | O | 9 | A | O | X | • | • | X | O | X | O | 220.00 | ||||||||||||||||||||||||||||||||||||||
| 216.00 | X | O | X | O | X | O | X | O | • | X | • | B | C | 216.00 | |||||||||||||||||||||||||||||||||||||||
| 212.00 | X | O | X | O | X | O | X | O | X | • | 8 | O | • | X | 212.00 | ||||||||||||||||||||||||||||||||||||||
| 208.00 | X | X | O | 3 | O | 3 | X | 4 | X | X | O | X | • | X | O | X | • | X | 208.00 | ||||||||||||||||||||||||||||||||||
| 204.00 | X | O | X | O | X | O | O | X | O | X | O | X | O | • | X | O | X | O | • | X | 204.00 | ||||||||||||||||||||||||||||||||
| 200.00 | X | X | O | B | C | X | 2 | O | X | O | X | O | X | O | • | X | O | 9 | O | • | X | 200.00 | |||||||||||||||||||||||||||||||
| 198.00 | O | X | O | X | X | O | X | 1 | X | O | X | O | X | O | X | O | 6 | • | X | O | X | O | X | • | X | Bot | 198.00 | ||||||||||||||||||||||||||
| 196.00 | O | X | O | X | O | X | O | X | O | X | O | X | • | O | 5 | O | • | X | O | X | O | X | O | • | X | X | • | 196.00 | |||||||||||||||||||||||||
| 194.00 | 9 | X | O | X | O | X | O | O | O | • | O | • | X | O | O | X | O | X | X | O | X | • | 194.00 | ||||||||||||||||||||||||||||||
| 192.00 | O | X | O | X | O | X | • | O | X | O | O | X | O | X | O | X | • | 192.00 | |||||||||||||||||||||||||||||||||||
| 190.00 | O | O | A | • | O | X | O | X | O | X | O | • | 190.00 | ||||||||||||||||||||||||||||||||||||||||
| 188.00 | • | O | X | X | O | A | O | X | • | 188.00 | |||||||||||||||||||||||||||||||||||||||||||
| 186.00 | • | O | X | O | X | X | O | X | O | X | • | 186.00 | |||||||||||||||||||||||||||||||||||||||||
| 184.00 | • | O | X | O | 7 | X | O | X | O | X | O | X | • | 184.00 | |||||||||||||||||||||||||||||||||||||||
| 182.00 | • | O | X | O | X | O | X | O | X | • | O | O | • | 182.00 | |||||||||||||||||||||||||||||||||||||||
| 180.00 | • | O | X | O | X | O | X | O | X | • | • | 180.00 | |||||||||||||||||||||||||||||||||||||||||
| 178.00 | • | O | O | O | O | X | • | 178.00 | |||||||||||||||||||||||||||||||||||||||||||||
| 176.00 | • | O | X | • | 176.00 | ||||||||||||||||||||||||||||||||||||||||||||||||
| 174.00 | • | O | • | 174.00 | |||||||||||||||||||||||||||||||||||||||||||||||||
| 21 | 22 | 23 |

| AER AerCap Holdings NV ($61.72) - Aerospace Airline - AER broke a double bottom at $61 to initiate a shakeout pattern. The stock is a 5 for 5'er that ranks 2nd (out of 44) in the Aerospace Airline sector matrix. From here, the action point for the shakeout pattern would be a reversal into Xs at $64 and the pattern would be complete with the triple break at $66. This breakout would mark the highest level on the chart in 12 months. Support lies at $56. |
| ALB Albemarle Corp ($268.29) - Chemicals - ALB fell to a sell signal on Friday when it broke a double bottom at $268. The outlook for ALB remains positive as it is a 4 for 5'er trading in a positive trend. From here, the next level of support on ALB's default chart sits at $236. |
| AZO Autozone, Inc. ($2,550.95) - Autos and Parts - AZO broke a quadruple top at $2528 as it rallied to $2560. The stock is a 4 for 5'er that lies just a box below the December chart high. A move to $2624 would be a new chart high for AZO. Support lies at $2400 and $2304. |
| BFAM Bright Horizons Family Solution Inc. ($74.04) - Leisure - BFAM shares returned to a sell signal on Friday with a double bottom break at $74. Note this breakdown comes after a near test of the bearish resistance line. The weight of the evidence remains negative here. Beyond $73, the next level of identifiable support is not offered until around $60. Note earnings are expected on 2/16. |
| CCK Crown Holdings, Inc. ($84.89) - Business Products - CCK took out two levels of support in its default chart in Friday's trading adding to an already negative technical picture as the stock is an unfavorable 2 for 5'er and ranks 83rd out of 93 names in the business products sector matrix. From here, the net level of support is CCK's bullish support line which currently sits at $82. |
| ECL Ecolab Inc. ($146.06) - Chemicals - ECL continued lower, violating its trend line in Friday's trading when it hit $144. The move will drop the stock to a 0 for 5'er; ECL also ranks in the bottom quartile of the chemicals sector matrix. From here, the next level of support sits at $142. |
| FCX Freeport-McMoRan Inc. ($42.36) - Metals Non Ferrous - FCX fell to a sell signal Friday when it broke a double bottom at $42. The weight of evidence remains positive as FCX is a 3 for 5'er and ranks fourth out 15 names in the favored metals non ferrous sector matrix. Form here, the next level of support sits at $37. |
| LQDT Liquidity Services, Inc. ($13.22) - Internet - LQDT shares broke a double bottom at $13 on Friday, resulting in a second consecutive sell signal. The 0 for 5'er continues to rank near the bottom of its stock sector matrix and trade beneath its bearish resistance line. Avoid because supply is in control. Support is offered here, and again at $11.50 which is the low from May 2022. |
| MSI Motorola Solutions Inc. ($271.52) - Telephone - MSI moved higher Friday after their earnings release to break a double top at $272, marking a fourth consecutive buy signal and matching its all-time chart high last reached in November 2022. This 5 for 5'er moved to a positive trend in October and ranks in the top third of the favored telephone sector RS matrix. The weight of the technical evidence has remained consistently strong. Initial support may be seen at $252 with further support seen at $248. |
| Name | Option Symbol | Action | Stop Loss |
|---|---|---|---|
| Lennar Corporation - $101.63 | O: 23F100.00D16 | Buy the June 100.00 calls at 7.30 | 94.00 |
| Name | Option | Action |
|---|---|---|
| AbbVie Inc. ( ABBV) | Jun. 145.00 Calls | Initiate an option stop loss of 10.45 (CP: 12.45) |
| Exxon Mobil Corporation ( XOM) | Jun. 115.00 Calls | Initiate an option stop loss of 8.20 (CP: 10.20) |
| Caesars Entertainment Inc. ( CZR) | Jun. 55.00 Calls | Stopped at 52.00 (CP: 51.85) |
| Name | Option Symbol | Action | Stop Loss |
|---|---|---|---|
| CSX Corporation - $31.57 | O: 23Q32.50D19 | Buy the May 32.50 puts at 2.15 | 34.00 |
| Name | Option | Action |
|---|---|---|
| Ecolab Inc. (ECL) | Apr. 155.00 Puts | Raise the option stop loss to 9.70 (CP: 11.70) |
| Name | Option Sym. | Call to Sell | Call Price | Investment for 500 Shares | Annual Called Rtn. | Annual Static Rtn. | Downside Protection |
|---|---|---|---|---|---|---|---|
| Steel Dynamics Inc. $121.35 | O: 23E125.00D19 | May. 125.00 | 8.80 | $57,334.80 | 82.84% | 68.12% | 6.13% |
| Name | Action |
|---|---|
| Freeport-McMoRan Inc. (FCX) - 42.94 | Sell the May 44.00 Calls. |
| Cleveland-Cliffs Inc. (CLF) - 19.88 | Sell the April 20.00 Calls. |
| Royal Caribbean Cruises Ltd. (RCL) - 73.53 | Sell the June 75.00 Calls. |
| American Airlines Group Inc. (AAL) - 16.66 | Sell the May 17.00 Calls. |
| Las Vegas Sands Corp. (LVS) - 57.52 | Sell the June 60.00 Calls. |
| Halliburton Company (HAL) - 37.66 | Sell the July 43.00 Calls. |
| Synchrony Financial (SYF) - 36.24 | Sell the May 38.00 Calls. |
| Hess Corporation (HES) - 140.64 | Sell the May 145.00 Calls. |
| The Boeing Company (BA) - 211.99 | Sell the May 215.00 Calls. |
| Arista Networks Inc (ANET) - 136.52 | Sell the June 145.00 Calls. |
| Name | Covered Write |
|---|---|
| Alcoa Inc. ( AA - 50.01 ) | April 55.00 covered write. |
Daily Equity & Market Analysis
Loading, Please Wait...
