
Most Requested Symbols

Whatever happened to the Qs, anyway?
Today's featured stock is Ally Financial Inc.(ALLY).
AMZN, BRKS, CLCT, CVNA, KNSL, MATX, MTSI, NOW & SHAK
Call: Nike (NKE); Put: Phillip Morris (PM); Covered Write: LM Ericsson (ERIC).
NDW Virtual Symposium - December 10, 2020 - 12pm to 4pm ET
Join us for this free half-day event that will provide you with in-depth knowledge on how to use Point & Figure Relative Strength to create a scalable, repeatable process for your business to sharpen your value proposition. Click here to see the full agenda. Click here to register today! *CFP & CIMA CE pending
Event sessions include:
Foundations of Relative Strength/Momentum investing
Knowledge of our toolbox of technical market indicators
How to apply RS as a means of identifying factors that are leading in changing market environments
We are excited to announce phase three of the Nasdaq Dorsey Wright Model Builder with the launch of Matrix and FSM-based Relative Strength (RS) Testing Service. As part of this launch, we are granting you free access to the service for the remainder of 2020. The tool is designed to help you more easily design, test, implement, and monitor custom models powered by the Nasdaq Dorsey Wright methodology. Through the end of December, be sure to join us each Thursday at 1 pm EST for a custom modeler demo presented by the analyst team.
11/19/2020: Static Model Builder Demo Replay - Click Here
11/12/2020: Matrix Model Builder Demo Replay - Click here
11/5/2020: FSM Model Builder Demo Replay - Click here
Click here to register for future Nasdaq Dorsey Wright Model Builder Demos
The return of Black Friday discounts means that the holiday shopping season is officially upon us. As we do every year, we want to give you some ideas for the holiday shopping season that won't break the bank. Furthermore, your support of these companies directly helps the small businesses of America. Some of these companies are even offering special discounts to Nasdaq Dorsey Wright clients!
Boston Coffee Cake
The Boston Coffee Cake Company was among the first recommendations on our Holiday Gift Idea list many years ago, and today it remains a perennial favorite. This company has always been very professional in their ordering and delivery services, and even as they've grown they have not lost that "home-baked" appeal. Some of the office favorites include their Triple Chocolate and Cinnamon Walnut Coffeecakes. Client feedback tends to rate Pecan Delight and Applicious just as favorably. You don’t necessarily need to take our word for it; Boston Coffee Cake was awarded the gold medal as a USA Taste Champion by the American Masters of Taste. Boston Coffee Cake does offer sugar-free and kosher-certified cakes and there are a number of different gift sets too if you want something more than just a cake.
If you are pinched for time and don't want to be in the kitchen cooking this holiday, try a Boston Coffee Cake, or if you are looking for something for the office or for clients, they make great gifts. As an additional sweetener, if you mention that you heard about them from Dorsey, Wright & Associates, you will receive a 20% discount on the entire order including shipping. Reference the promo code DORSEY. You can get the DWA discount over the phone or through their online ordering process as well. Give it a try, you'll not regret it.
Contact Info:

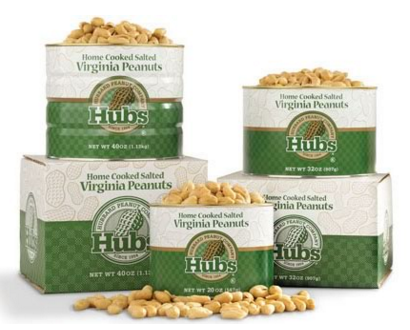
Hubs Peanuts
What gift can be more easily shared among family, friends, or a group of co-workers? What gift could complement a wider array of foods or beverages at a gathering? And what gift could be easier on the budget? Peanuts! We’re not suggesting just any peanuts either. We think you should try Hubs “home-cooked” Virginia peanuts. The Hubbard Peanut Company is located about 80 miles south of Richmond, Virginia, in the town of Sedley, Virginia, and is the original and oldest continuously family-owned and operated processor of a style of peanuts that has become the gold standard in the peanut industry. For 60+ years, Hubs Peanuts, located in the heart of peanut territory, has chosen peanuts from the top 1% of the harvest and turned them into tasty nuggets of nutritional goodness for peanut lovers around the world.
Go traditional with their salted peanuts or if you would rather add a little flair, we suggest the sweet heat! Use the promo code DW2020 when ordering for a 10% discount!
Contact Info:
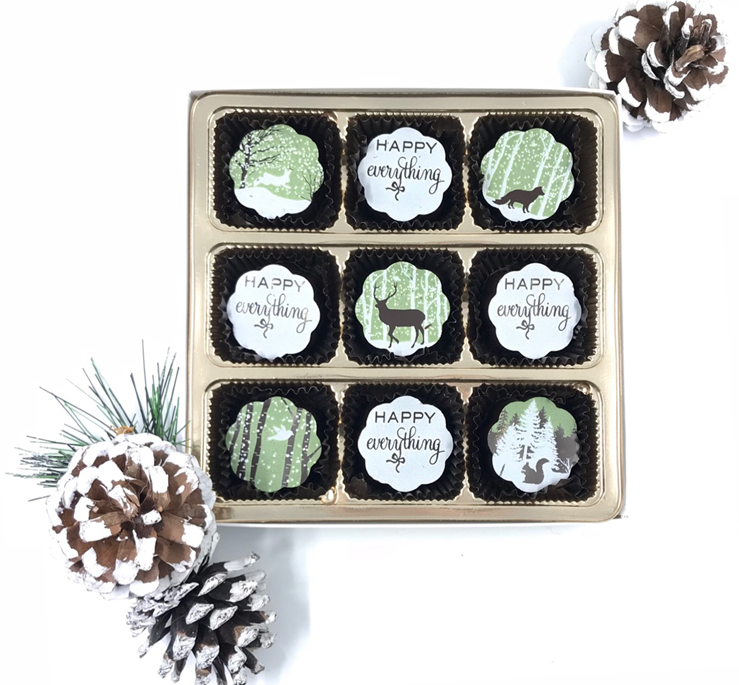
Chocolates by Kelly
What would a holiday gift list be without fine chocolates? We'd argue it would be like Thanksgiving without a turkey or football. Fear not! If you are going for the "wow" factor, the offerings of "Chocolates by Kelly" will provide plenty of that. Kelly Walker is a local artisan that originated in Richmond, VA, and her chosen material is chocolate, which is sold in some of the finest gourmet boutiques on the East Coast. She specializes in handmade chocolate creations that make for a spectacular gift idea for even the most high-brow of chocolate lovers on your list. For clients, teachers, moms, spouses ... nothing says "thank you" like chocolate, and this year Kelly has offered to extend some special pricing to clients of NDW for orders placed before the end of the year. Her website will give you an idea of what her chocolate assortments will look like when they arrive, all of which are extremely pleasing on both the eyes and the tongue in our experience. Whether you go with a traditional 12-piece chocolate assortment or a "Chocolate of the Month" subscription for someone very special, we think whoever is on the other end of this gift will be impressed. You can order online to send a one-time gift or a monthly subscription of these decadent treats, or call/email Kelly direct for larger bulk orders! Our one suggestion is that you be sure to include something for yourself on any order you place with Kelly. Oh, and that your order should include the Spiced Chai Truffle for milk chocolate lovers, and the Cherry Pomegranate Truffle for those who favor the dark.
Contact Info:
Customers now have the ability to fully customize both the chocolates and the packaging for a truly unique gift experience.

Chouquette
Sarah Dwyer, the owner of Chouquette Artisan Chocolates and Confections of Bethesda, MD, left the business world for a year at Le Cordon Bleu in Paris where she learned how to make authentic, European-style soft and flavorful caramels. Using real ingredients—sugar, local butter, and cream—with natural infusions of balsamic, caramel, raspberry, vanilla, and single-origin coffee beans, she creates confections as beautiful as they are delicious. With special labeling of each flavor, never bite into the wrong chocolate again. You can also put custom logos on any chocolate purchase. Be sure to use the code "DWA20" or "NASDAQ20" for 20% off your entire order.
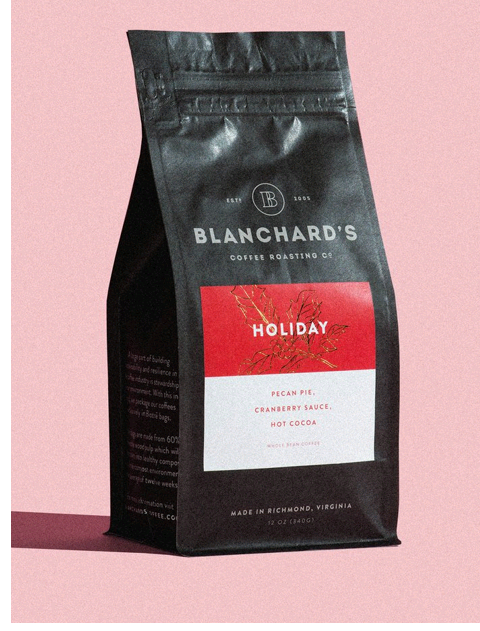
Blanchard's Coffee
Have you ever noticed that when you call the NDW office in the morning, no matter whom you speak with, we are all awake and alert? Well, for that we have to give at least some credit to David Blanchard and the good folks down at Blanchard's Coffee. David is a stockbroker here in Richmond, Virginia, who always had a certain love for coffee, enough so that he purchased a commercial coffee roaster a few years back and began providing freshly roasted coffee to friends and family as a hobby. Being the only Richmond operation to actually roast coffee, it eventually caught the eye of a local grocery chain, and, long story short, David's coffee operation moved out of his garage and began providing the freshest coffee around to the central Virginia area and beyond. Their brand is high quality, fresh roasted, coffee that can be shipped anywhere in the country within a few days of actually being roasted. If your town is anything like Richmond was a few years ago, freshly roasted coffee is probably a lot like your expertise—something your clients can't find anywhere else.
Blanchard's offers a number of potential gift ideas for clients that may appeal to you including holiday gift boxes, individual bags of coffee, or even custom packs. They have everything from coffee strong enough to please Tom Dorsey (like Dark as Dark) to organic fair trade options, and many others. Again, for a special wholesale discount be sure to tell them that Nasdaq Dorsey Wright sent you.
Contact Info:
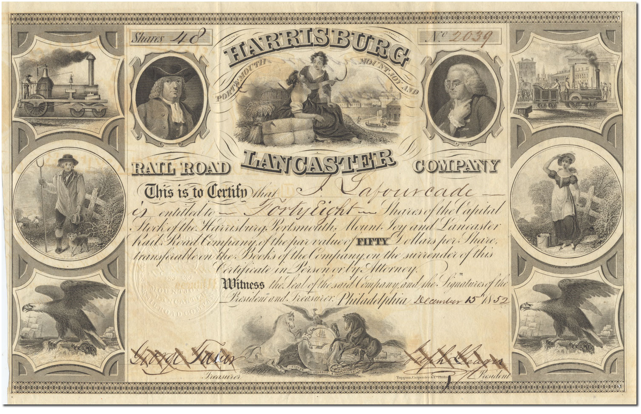
Ghosts of Wall Street (formerly known as Stocklobster)
If you are looking for a truly unique gift idea for clients or loved ones, look no further than Ghosts of Wall Street - an online antique store featuring historic stock and bond certificates. These beautiful pieces - many of which contain stunning artwork - offer a glimpse back to a time when paper documents were issued to investors. The store offers thousands of historical financial documents covering a variety collectible categories including mining, airlines, railroads, automotive, financial scandals and autographs. Their inventory includes pieces from famous firms like Merrill Lynch, Lionel, Sears, and IBM. It's the perfect place to look for that "conversation piece" gift for a long time client, associate or relative.
Currently all orders over $30 ship FREE to U.S. addresses, and Daily Equity Report readers will also receive 30% off any order by using coupon code: SPECIALNDW30.
This offer expires at midnight on December 31, 2020.

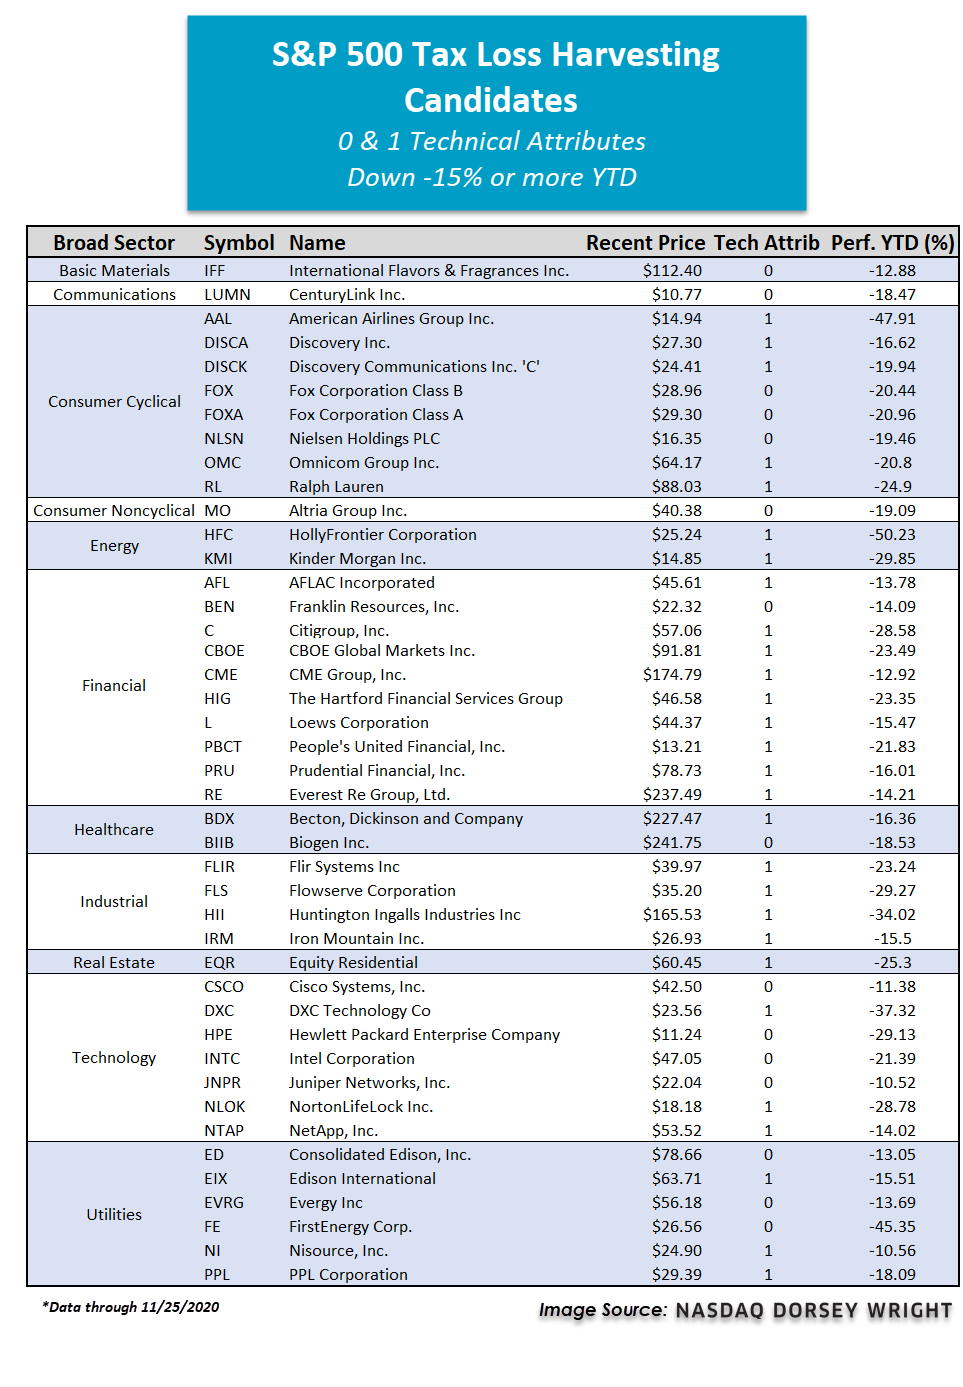
As the end of the calendar year approaches, so too do discussions regarding any unrealized gains or losses of substance sitting within taxable accounts. It is probably a safe assumption that your clients prefer to pay less in taxes whenever possible, and there are a few simple strategies that can be applied within the portfolio to help in that endeavor. "Tax Loss Harvesting" is among them, and while it is not exactly an advanced accounting strategy, it is an effective way to both offset gains and rid the portfolio of laggard positions before the calendar flips to 2021.
In some years, finding losses to harvest is easier than others. Given the elevated market volatility throughout much of the year, there is no shortage of stocks that are in negative territory on a year-to-date basis. We want to highlight stocks that are widely owned, so we’ve used the S&P 500 as a starting point. Because we only want to sell stocks that are technically weak, we filtered our screen to only include stocks that have a 0 or 1 technical attribute rating. From that group, we identified 43 individual names that are down -15% or more on a year-to-date basis (through 11/25).
Losses from these positions may be used to offset some of the gains already taken in the calendar year or can be "carried forward" in many cases. The harvesting of losses is a straight-forward approach, which can be combined with the practical portfolio review measure of weeding out technically weak holdings. Below the table, we've highlighted a few individual names that are ripe for potential loss harvesting.
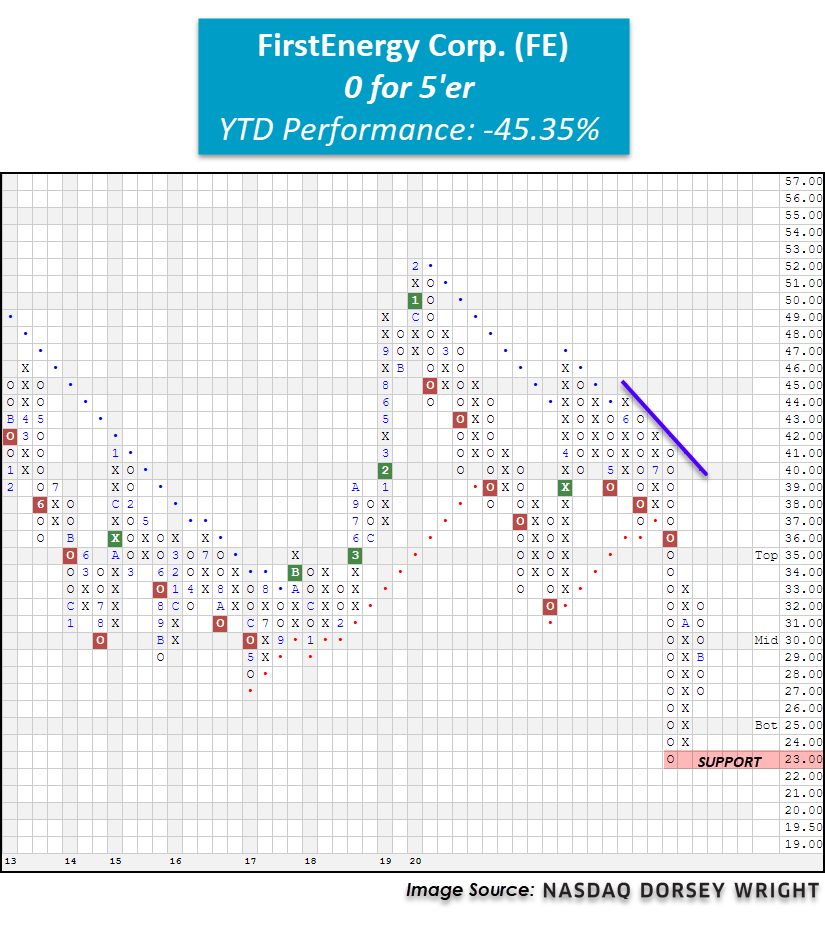
FE FirstEnergy Corp. ($26.62) - Utilities/Electricity
FirstEnergy Corp FE is one of the S&P 500 names we consider to be a strong candidate for potential tax-loss harvesting. FE started the year strong when it printed a multi-year high in February at $52 before moving to a sell signal at $45. FE gave a total of five consecutive sell signals throughout the next month before returning to a buy signal in March. This rally was short-lived, however, as in May, FE returned to a sell signal and has since given a total of three consecutive sell signals, confirming that supply is in control. Furthermore, FE moved into a negative trend in July when it fell to print a multi-year low at $23 before bouncing to $33 in October. With action this month, FE has returned to a column of Os at $27. With 0 positive attributes in its favor, selling FE can both improve the overall technical health of your portfolio and potentially help offset gains from other positions. Year-to-date, FE is down a whopping -45.35% while the S&P 500 Index SPX is up 12.35%.
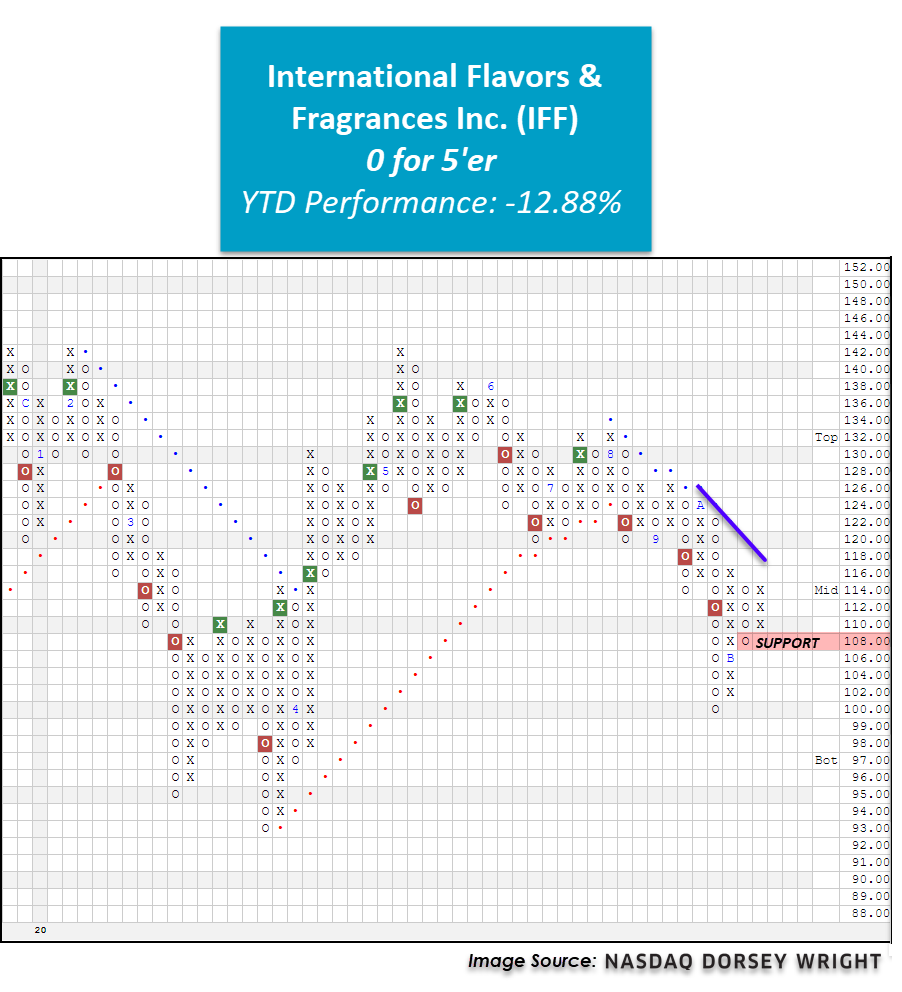
IFF International Flavors & Fragrances Inc. ($112.72) - Chemicals
IFF sold off in February and March along with the broader market before showing signs of life in late March through June. After some back and forth action in July and August, IFF moved to a sell signal at $122 and has since given a total of three consecutive sell signals. Currently, IFF is an unacceptable 0 for 5’er that ranks dead last in the chemicals sector stock matrix. Additionally, monthly momentum has been negative for two months, suggesting the potential for lower prices. Year-to-date, IFF is down -12.88%, making this stock an ideal candidate for potential tax-loss harvesting.
KMI Kinder Morgan Inc. ($14.76) - Oil Service
KMI is a weak 1 for 5’er that ranks 14th out of 16 names in the oil service sector RS matrix. KMI has maintained a long-term market RS sell signal since October 2013 and is currently trading in an overall negative trend. After moving as high as $22 in February, shares of KMI began to fall, and the stock returned to a sell signal at $18 in March before moving as low as $9.50, which marked a new all-time low on the chart. In April, KMI returned to a buy signal and showed follow through with a second consecutive buy signal; however, in September, the stock returned to a sell signal and moved back into a negative trend. With recent market action, KMI has reversed back up into Xs at $15; however, it remains well below the bearish resistance line. KMI’s year-to-date (through 11/25) return of -29.85% makes this stock a prime tax-loss candidate. Even when factoring in KMI’s yield of about 7%, the stock is down double digits with a loss of -24.80% on a total return basis this year, underperforming the S&P 500 Index Total Return TR.SPXX by over -39%.

The S&P 500 Weekly Distribution indicator ^WDSPX recently moved above 50. This indicator measures the average weekly distribution of all the stocks in the S&P 500. Moves above 50 are very rare. When we see internal strength like this it is often a sign that the market will continue rather than pull back from overbought conditions. We have seen this same thing from a number of other indicators over the last 4-6 weeks.
Below are the instances when the indicator rises to 50 or higher and instances when the indicator rises to 40 along with the forward S&P 500 total returns. It’s certainly not a given that the market has to move higher from here, but the historical data shows we may not see a significant pullback even with so many stocks in the S&P 500 overbought on their weekly distribution.


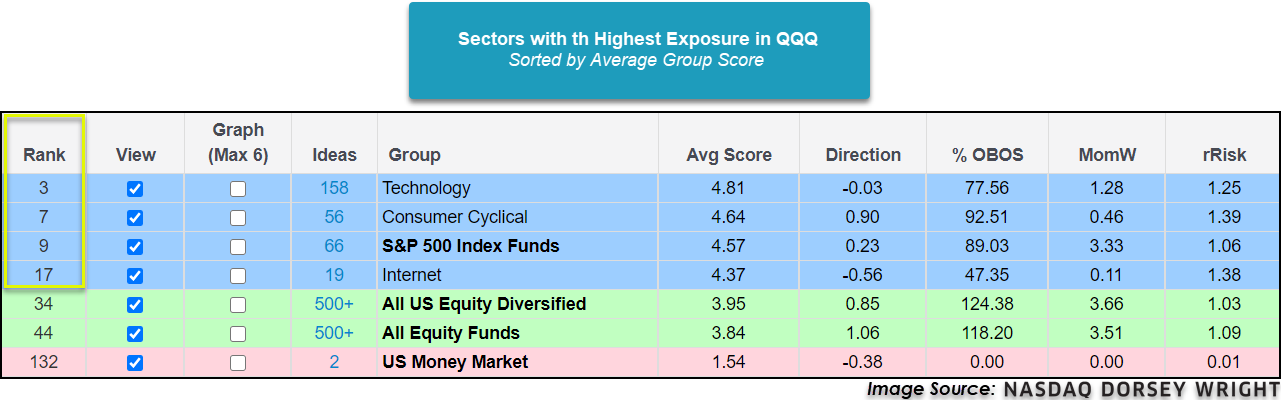
Over the past month, a new darling has entered the spotlight. Small caps and value-oriented names have seen quite the rally this November with the iShares Russell 2000 ETF IWM returning 19.92% (10/30 thru 11/25). This raises the question of what happened to the old star of the show, the Invesco QQQ Trust QQQ, which had been a steady leader among market benchmark funds for most of the year. While the sectors and names that are overweight within QQQ have cooled off over the past couple of months, they still are in technically strong standing. The three largest holdings of the Qs are Apple Inc. AAPL, Microsoft Corporation MSFT, and Amazon.com Inc. AMZN, which combine to make up roughly a third of the underlying exposure, all still possess technical attribute ratings of 3. Not only do they still have acceptable technical attributes, but they all are also trading in positive trends and on RS buy signals versus the market which shows long-term relative strength metrics are still intact despite some short-term weakness.
When we broaden out our view to underlying sector exposure, the Qs majority of exposure is to two sectors, technology and consumer cyclical. Technology makes up 58.67% of the exposure while consumer cyclical makes up 26.16%. Looking at the Asset Class Group Scores page Sectors view, the Technology and Consumer Cyclical groups are the best scoring groups with average group scores of 4.81 and 4.64, respectively. Both of these groups also rank in the top 10 out of all 135 groups we track on the Asset Class Group Scores page, another sign of the strength of the two sectors. The subsector Internet also has a strong average group score of 4.37. Although the Technology and Internet groups have average group scores above 4.00, they do have negative score directions which convey some short-term weakness that follows the same narrative as the larger holdings in QQQ.
Looking at the trend chart of the Qs we can see it will complete a bullish triangle pattern due to today’s price action and now sits at $300, which is resistance dating back to September. A break of this resistance level with a move to $305 would also mark a new all-time high for the fund. With its fund score of 4.55, QQQ is besting the average score for All US and US Large Cap Growth. QQQ has held positive monthly momentum for the last seven months and recently flipped back to positive weekly momentum which indicates the potential for higher prices. With a weekly overbought/oversold reading of 39%, QQQ is at a much more actionable place in its trading band than many other areas of the domestic equity market. From its current standing, the Qs offer support at the $265-$270 level. As we’ve seen other areas of the market perform strongly over the past couple of months, the old guard is holding up well from a long-term perspective and is still an area that deserves exposure. The consolidation for the QQQ’s largest holdings looks to be a welcomed sign as long as the long-term relative strength signals remain intact and could provide a base for these names moving forward. As always, be sure to keep tabs on the Asset Class Group Scores page to stay on top of market trends and changes.

Average Level
50.20
| AGG | iShares US Core Bond ETF |
| USO | United States Oil Fund |
| DIA | SPDR Dow Jones Industrial Average ETF |
| DVY | iShares Dow Jones Select Dividend Index ETF |
| DX/Y | NYCE U.S.Dollar Index Spot |
| EFA | iShares MSCI EAFE ETF |
| FXE | Invesco CurrencyShares Euro Trust |
| GLD | SPDR Gold Trust |
| GSG | iShares S&P GSCI Commodity-Indexed Trust |
| HYG | iShares iBoxx $ High Yield Corporate Bond ETF |
| ICF | iShares Cohen & Steers Realty ETF |
| IEF | iShares Barclays 7-10 Yr. Tres. Bond ETF |
| LQD | iShares iBoxx $ Investment Grade Corp. Bond ETF |
| IJH | iShares S&P 400 MidCap Index Fund |
| ONEQ | Fidelity Nasdaq Composite Index Track |
| QQQ | Invesco QQQ Trust |
| RSP | Invesco S&P 500 Equal Weight ETF |
| IWM | iShares Russell 2000 Index ETF |
| SHY | iShares Barclays 1-3 Year Tres. Bond ETF |
| IJR | iShares S&P 600 SmallCap Index Fund |
| SPY | SPDR S&P 500 Index ETF Trust |
| TLT | iShares Barclays 20+ Year Treasury Bond ETF |
| GCC | WisdomTree Continuous Commodity Index Fund |
| VOOG | Vanguard S&P 500 Growth ETF |
| VOOV | Vanguard S&P 500 Value ETF |
| EEM | iShares MSCI Emerging Markets ETF |
| XLG | Invesco S&P 500 Top 50 ETF |

| Symbol | Company | Sector | Current Price | Action Price | Target | Stop | Notes |
|---|---|---|---|---|---|---|---|
| LL | Lumber Liquidators Holdings Inc | Building | $30.39 | mid to upper 20s | 47 | 21 | 5 for 5'er, pos trend, 7 consec buy signals, pullback from multi-year high |
| BLMN | Bloomin' Brands Inc | Restaurants | $18.14 | 15 - 17 | 21 | 13.50 | 4 for 5'er, favored REST sector, triple top breakout, pullback to middle of trading band, pot. cov. write |
| ACN | Accenture PLC | Business Products | $249.33 | 230s - 240s | 216 | 208 | 5 for 5'er, top 1/2 of BUSI sector matrix, LT pos RS, spread triple top, 1.5% yield Earnings 12/17 |
| SAIL | SailPoint Technologies Holdings, Inc. | Software | $43.23 | mid 40s | $66 | $35 | 5 for 5'er, pullback from ATH, consec buy signals, pos trend |
| LPX | Louisiana-Pacific Corporation | Forest Prods/Paper | $34.96 | low 30s | 45.50 | 27 | 4 for 5'er, top third of FORE sector matrix, bullish triangle, pos wkly mom flip, 1.8% yield |
| TGTX | TG Therapeutics, Inc. | Biomedics/Genetics | $29.49 | upper 20s to mid 30s | 45.50 | 25 | 5 for 5'er, bullish triangle pattern, consec buy signals, testing multi-year high, pos trend |
| MXL | MaxLinear, Inc. | Semiconductors | $30.45 | 28 - 31 | 41 | 24 | 4 for 5'er, top third of SEMI sector matrix, spread six top breakout, R-R>2.0 |
| AOS | A.O. Smith Corporation | Building | $56.37 | mid to upper 50s | 72 | 47 | 4 for 5'er, four consec buy signals, mutli-year high, market RS buy signal since 9/2008, 1.86% yield |
| GOOS | Canada Goose Holdings Inc. | Textiles/Apparel | $35.60 | mid-to-upper 30s | 39.50 | 30 | 5 for 5'er, top 25% of favored TEXT sector matrix, triple top breakout, pot. cov. write |
| ALLY | Ally Financial Inc. | Finance | $30.70 | $29 - $32 | 33 | 25 | 5 for 5'er, top 10% of FINA sector matrix, mutliple consec buy signals, 2.45% yield, pot. cov. write |
| Symbol | Company | Sector | Current Price | Action Price | Target | Stop | Notes |
|---|
| Symbol | Company | Sector | Current Price | Action Price | Target | Stop | Notes |
|---|---|---|---|---|---|---|---|
| SGMS | Scientific Games Corporation | Gaming | $38.83 | low-to-mid 30s | 62 | 29 | See follow up comment below. |
| Comment |
|---|
| CREE Cree Research Inc R ($92.66) - Semiconductors - With no viable stops between $86 and $69 on any of CREE's charts, in order to protect profits, we will raise our stop to $86, the first potential sell signal on CREE's default chart. |
| AVGO Broadcom Ltd R ($398.56) - Semiconductors - We will now raise our stop to $340, the second potential sell signal on AVGO's default chart. |
| SGMS Scientific Games Corporation R ($40.24) - Gaming - SGMS has moved above the ideal action range. OK to hold here. Raise stop to $32, the first potential sell signal on SGMS's default chart. |
ALLY Ally Financial Inc. R ($30.39) - Finance - ALLY is a 5 for 5'er that ranks in the top decile of the finance sector matrix. On its default chart, ALLY has given four consecutive buy signals, most recently breaking a double top at $31. The stock also has good income potential as it carries a 2.45% yield and offers a potential covered write opportunity on the March '21 call options. Long exposure may be added in the $29-$32 range and we will set our initial stop at $25, the first potential sell signal on ALLY's default chart. We will use the top of the trading band, $33, as our near-term price target.
| 17 | 18 | 19 | 20 | ||||||||||||||||||||||||||||||||||||||||||||||||||
| 35.00 | X | • | 35.00 | ||||||||||||||||||||||||||||||||||||||||||||||||||
| 34.00 | X | X | O | • | 34.00 | ||||||||||||||||||||||||||||||||||||||||||||||||
| 33.00 | X | O | 9 | O | 2 | • | Top | 33.00 | |||||||||||||||||||||||||||||||||||||||||||||
| 32.00 | • | X | O | X | A | X | O | • | 32.00 | ||||||||||||||||||||||||||||||||||||||||||||
| 31.00 | X | • | 7 | 8 | X | O | X | O | • | X | 31.00 | ||||||||||||||||||||||||||||||||||||||||||
| 30.00 | 1 | O | • | X | O | 1 | O | • | X | X | 30.00 | ||||||||||||||||||||||||||||||||||||||||||
| 29.00 | X | O | 4 | • | X | O | • | X | O | B | 29.00 | ||||||||||||||||||||||||||||||||||||||||||
| 28.00 | C | 2 | X | O | • | 4 | O | • | X | O | X | 28.00 | |||||||||||||||||||||||||||||||||||||||||
| 27.00 | B | O | X | O | C | • | 2 | O | • | X | O | X | Mid | 27.00 | |||||||||||||||||||||||||||||||||||||||
| 26.00 | X | 3 | 5 | X | O | X | O | • | X | A | O | 26.00 | |||||||||||||||||||||||||||||||||||||||||
| 25.00 | A | A | X | O | X | • | O | • | X | O | X | 25.00 | |||||||||||||||||||||||||||||||||||||||||
| 24.00 | 9 | O | O | 1 | • | 3 | • | X | 9 | O | X | 24.00 | |||||||||||||||||||||||||||||||||||||||||
| 23.00 | X | 8 | O | X | • | O | • | X | O | X | 8 | O | 23.00 | ||||||||||||||||||||||||||||||||||||||||
| 22.00 | 2 | O | 7 | O | X | • | O | • | X | O | X | X | O | X | 22.00 | ||||||||||||||||||||||||||||||||||||||
| 21.00 | 1 | O | X | X | • | O | • | O | X | • | X | O | X | O | 7 | O | X | Bot | 21.00 | ||||||||||||||||||||||||||||||||||
| 20.00 | • | X | C | 3 | X | O | 6 | • | • | O | X | O | • | X | O | X | O | X | O | 20.00 | |||||||||||||||||||||||||||||||||
| 19.50 | • | X | O | X | O | X | O | X | • | O | X | O | X | • | X | O | X | O | X | • | 19.50 | ||||||||||||||||||||||||||||||||
| 19.00 | • | • | X | O | X | 4 | 5 | X | • | O | O | X | O | 6 | O | O | X | • | 19.00 | ||||||||||||||||||||||||||||||||||
| 18.50 | X | X | • | 6 | • | 8 | A | X | O | • | O | X | X | O | X | O | • | 18.50 | |||||||||||||||||||||||||||||||||||
| 18.00 | 3 | O | X | O | X | O | • | X | O | X | • | O | X | O | X | X | O | X | • | 18.00 | |||||||||||||||||||||||||||||||||
| 17.50 | X | O | X | O | X | O | • | X | B | X | • | O | X | O | X | X | O | X | O | • | 17.50 | ||||||||||||||||||||||||||||||||
| 17.00 | X | 4 | 5 | O | X | X | O | • | O | X | O | X | O | X | O | X | • | 17.00 | |||||||||||||||||||||||||||||||||||
| 16.50 | X | O | X | O | X | • | O | X | O | X | O | X | O | X | • | 16.50 | |||||||||||||||||||||||||||||||||||||
| 16.00 | O | X | O | X | • | O | X | O | X | O | X | 5 | X | • | 16.00 | ||||||||||||||||||||||||||||||||||||||
| 15.50 | O | X | 7 | • | O | X | O | X | O | X | X | O | X | • | 15.50 | ||||||||||||||||||||||||||||||||||||||
| 15.00 | O | • | • | O | X | O | X | O | X | O | X | O | X | • | 15.00 | ||||||||||||||||||||||||||||||||||||||
| 14.50 | • | O | X | O | X | O | X | O | X | O | X | • | 14.50 | ||||||||||||||||||||||||||||||||||||||||
| 14.00 | O | X | 4 | X | O | X | O | O | X | • | 14.00 | ||||||||||||||||||||||||||||||||||||||||||
| 13.50 | O | X | X | O | X | O | O | • | 13.50 | ||||||||||||||||||||||||||||||||||||||||||||
| 13.00 | O | X | O | X | O | X | • | 13.00 | |||||||||||||||||||||||||||||||||||||||||||||
| 12.50 | O | X | O | X | O | X | 12.50 | ||||||||||||||||||||||||||||||||||||||||||||||
| 12.00 | O | X | O | X | O | 12.00 | |||||||||||||||||||||||||||||||||||||||||||||||
| 11.50 | O | X | O | X | 11.50 | ||||||||||||||||||||||||||||||||||||||||||||||||
| 11.00 | O | X | O | 11.00 | |||||||||||||||||||||||||||||||||||||||||||||||||
| 10.50 | O | 10.50 | |||||||||||||||||||||||||||||||||||||||||||||||||||
| 17 | 18 | 19 | 20 |
| AMZN Amazon.com Inc. ($3,197.38) - Internet - AMZN broke a bullish triangle at 3200, marking the second consecutive buy signal on the chart. AMZN is a 3 for 5’er within the intenet sector that has maintained a positive trend since January 2015. From here, support sits at 3072, the bullish support line. |
| BRKS Brooks Automation Inc ($72.97) - Semiconductors - Shares of BRKS reversed up into a column of Xs Friday and completed a bullish triangle at $72, marking a third consecutive buy signal before reaching a new all-time high at $73 intraday. This 4 for 5'er moved to a positive trend in April and ranks 5th out of 60 names in the semiconductors RS matrix. The overall technical picture is strong here, however, those looking to add exposure would be best served to wait for a pullback or normalization of the trading band as the stock has entered overbought territory. Initial support can be found at $68 with further support found at $65. |
| CLCT Collectors Universe, Inc. ($72.51) - Retailing - CLCT broke a spread triple top at $74 on Friday before moving higher to $76, marking a new all-time high for the stock. CLCT is a perfect 5 for 5’er within the favored retailing sector that moved into a positive trend in April. From here, support sits at $69. |
| CVNA Carvana Company ($249.30) - Autos and Parts - CVNA is a 4 for 5’er within the favored autos and parts sector. On Friday, CVNA broke a double top at $248, marking the third consecutive buy signal on the chart as well as a new all-time high. Weekly momentum just flipped positive, adding to the positive technical picture. From here, support sits at $232. |
| KNSL Kinsale Capital Group Inc ($238.52) - Insurance - KNSL shares moved higher today to break a double top at $240 to mark its fourth consecutive buy signal and reach a new all-time high. This 4 for 5'er has been in a positive trend since April and on an RS buy signal versus the market since February. Recent price action has put KNSL into heavily overbought territory and those wishing to initiate a long position may be best served to wait for a pullback or normalization within the trading band. From here, support is offered at $224 with further support at $208. |
| MATX Matson Inc ($58.92) - Transports/Non Air - Shares of MATX pulled back on Friday, reversing down into a column of Os from its all-time chart high of $62. The 5 for 5'er ranks first out of 45 names in the transports/non air stock sector matrix and recently returned to an RS buy signal versus the market last month. The weight of the evidence is positive and MATX is actionable at current levels. Initial support is offered around $57. |
| MTSI MACOM Technology Solutions Holdings Inc. ($45.01) - Semiconductors - Shares of MTSI advanced Friday to break a spread triple top at $45, marking a new multi-year high. This 4 for 5'er moved to a positive trend in April and has been on an RS buy signal against the market since mid-2019. The overall technical picture is strong here, however, MTSI has become overbought so those looking to add exposure may be best served to wait for a pullback or normalization of the trading band. Initial support can be found at $41. |
| NOW Servicenow Inc ($526.62) - Software - NOW moved higher Friday to break a double top at $528. This 5 for 5'er moved to a positive trend in April and ranks in the top quartile of the software sector RS matrix. The stock has also been on an RS buy signal against the market since 2013. Exposure may be considered on this breakout, with initial support offered at $496. Further support can be found at $480. |
| SHAK Shake Shack Inc ($82.89) - Restaurants - SHAK returned to a buy signal on Friday with a double top breakout at $83. This stock is a healthy 4 for 5’er within the favored restaurants sector that has support offered at $76. |
| Name | Option Symbol | Action | Stop Loss |
|---|---|---|---|
| NIKE, Inc. - $134.25 | O: 21D130.00D16 | Buy the April 130.00 calls at 12.65 | 124.00 |
| Name | Option | Action |
|---|---|---|
| Morgan Stanley ( MS) | Jan. 45.00 Calls | Raise the option stop loss to 18.30 (CP: 20.30) |
| Builders FirstSource, Inc. ( BLDR) | Jan. 31.00 Calls | Raise the option stop loss to 5.10 (CP: 7.10) |
| T-Mobile US Inc. ( TMUS) | Jan. 115.00 Calls | Raise the option stop loss to 15.30 (CP: 17.30) |
| Viacom CBS Inc. ( VIAC) | Jan. 26.00 Calls | Raise the option stop loss to 7.00 (CP: 9.00) |
| Texas Instruments Incorporated ( TXN) | Mar. 145.00 Calls | Initiate an option stop loss of 16.40 (CP: 18.40) |
| IntercontinentalExchange Inc. ( ICE) | Mar. 100.00 Calls | Initiate an option stop loss of 5.90 (CP: 7.90) |
| Name | Option Symbol | Action | Stop Loss |
|---|---|---|---|
| Philip Morris International Inc. - $75.90 | O: 21O77.50D19 | Buy the March 77.50 puts at 5.80 | 80.00 |
| Name | Option | Action |
|---|---|---|
|
|
||
| Name | Option Sym. | Call to Sell | Call Price | Investment for 500 Shares | Annual Called Rtn. | Annual Static Rtn. | Downside Protection |
|---|---|---|---|---|---|---|---|
| LM Ericsson Telephone Company (Sweden) ADR $12.26 | O: 21D13.00D16 | Apr. 13.00 | 0.75 | $5,905.90 | 23.48% | 13.65% | 4.97% |
| Name | Action |
|---|---|
| Truist Financial Corp (TFC) - 48.51 | Sell the March 50.00 Calls. |
| QUALCOMM Incorporated (QCOM) - 144.08 | Sell the March 150.00 Calls. |
| The Chemours Company (CC) - 25.00 | Sell the April 24.00 Calls. |
| OneMain Holdings Inc. (OMF) - 41.24 | Sell the February 40.00 Calls. |
| Marathon Petroleum Corp. (MPC) - 41.48 | Sell the April 45.00 Calls. |
| JD.COM INC (JD) - 88.23 | Sell the March 90.00 Calls. |
| Name | Covered Write |
|---|---|
|
|
|
Daily Equity & Market Analysis
Loading, Please Wait...
