
Whatever happened to the Qs, anyway?
Over the past month, a new darling has entered the spotlight. Small caps and value-oriented names have seen quite the rally this November with the iShares Russell 2000 ETF IWM returning 19.92% (10/30 thru 11/25). This raises the question of what happened to the old star of the show, the Invesco QQQ Trust QQQ, which had been a steady leader among market benchmark funds for most of the year. While the sectors and names that are overweight within QQQ have cooled off over the past couple of months, they still are in technically strong standing. The three largest holdings of the Qs are Apple Inc. AAPL, Microsoft Corporation MSFT, and Amazon.com Inc. AMZN, which combine to make up roughly a third of the underlying exposure, all still possess technical attribute ratings of 3. Not only do they still have acceptable technical attributes, but they all are also trading in positive trends and on RS buy signals versus the market which shows long-term relative strength metrics are still intact despite some short-term weakness.
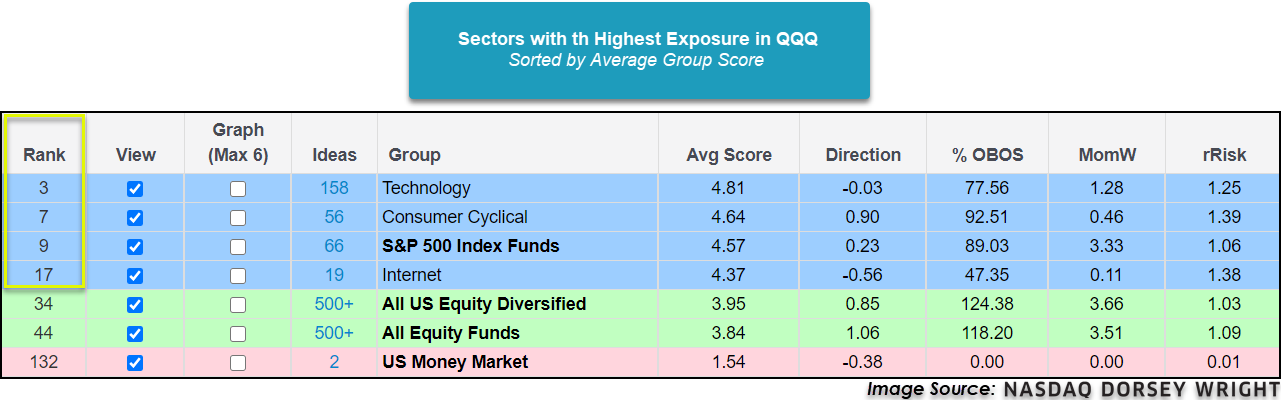
When we broaden out our view to underlying sector exposure, the Qs majority of exposure is to two sectors, technology and consumer cyclical. Technology makes up 58.67% of the exposure while consumer cyclical makes up 26.16%. Looking at the Asset Class Group Scores page Sectors view, the Technology and Consumer Cyclical groups are the best scoring groups with average group scores of 4.81 and 4.64, respectively. Both of these groups also rank in the top 10 out of all 135 groups we track on the Asset Class Group Scores page, another sign of the strength of the two sectors. The subsector Internet also has a strong average group score of 4.37. Although the Technology and Internet groups have average group scores above 4.00, they do have negative score directions which convey some short-term weakness that follows the same narrative as the larger holdings in QQQ.
Looking at the trend chart of the Qs we can see it will complete a bullish triangle pattern due to today’s price action and now sits at $300, which is resistance dating back to September. A break of this resistance level with a move to $305 would also mark a new all-time high for the fund. With its fund score of 4.55, QQQ is besting the average score for All US and US Large Cap Growth. QQQ has held positive monthly momentum for the last seven months and recently flipped back to positive weekly momentum which indicates the potential for higher prices. With a weekly overbought/oversold reading of 39%, QQQ is at a much more actionable place in its trading band than many other areas of the domestic equity market. From its current standing, the Qs offer support at the $265-$270 level. As we’ve seen other areas of the market perform strongly over the past couple of months, the old guard is holding up well from a long-term perspective and is still an area that deserves exposure. The consolidation for the QQQ’s largest holdings looks to be a welcomed sign as long as the long-term relative strength signals remain intact and could provide a base for these names moving forward. As always, be sure to keep tabs on the Asset Class Group Scores page to stay on top of market trends and changes.

