
Most Requested Symbols

We examine previous shifts from growth to value and which sectors had the strongest performance.
Today's featured stock is SailPoint Technologies Holdings, Inc. (SAIL)
AZPN, NCR, SQ, TTD, WTFC, BC, KNSL, FRGI, GCO, ORA, & ROKU.
Call: Dow, Inc. (DOW), Put: Johnson & Johnson (JNJ), Covered Write: Truist Financial (TFC)
On Monday evening, it was announced that Tesla Inc. TSLA is going to join the S&P 500 index, which is set to occur prior to the market open on December 21st. “(Tesla) will be one of the largest weight additions to the S&P 500 in the last decade, and consequently will generate one of the largest funding trades in S&P 500 history,” S&P Dow Jones Indices said. With its market value over $400 billion, Tesla will be among the most valuable companies added to the index, and it will account for about 1% of the SPX.
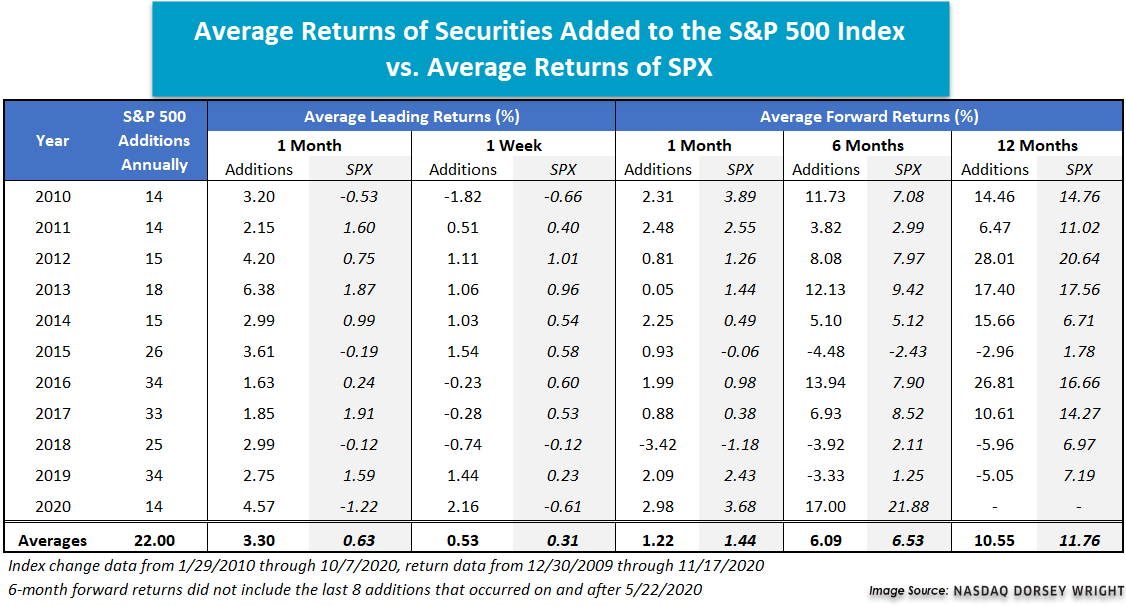
Today we wanted to examine how new additions to the S&P 500 index have historically performed leading up to and after joining the index. On average, the new constituents underperformed the index over the one-, six-, and 12-month periods after being added to the index. While this seems counterintuitive at first when we consider the timeline of the index changes it makes more sense. Even though TSLA won’t officially join the S&P 500 until next month, we already now know that the stock will be added to the index. This amount of lead leaves ample time for investors to front-run the index changes. This scenario appears consistent with the results when we look at the performance of new constituents in the period leading up to the official inclusion in the index.
In the one-month prior to joining the index, the upcoming additions had an average return of 3.3%, while the S&P 500’s average return was 0.63% over the same period. By one week out, however, the majority of any alpha-generation opportunity appears to be gone as the new constituents led the index by just 22 basis points (0.22%) on average.
So, while our results show that there does appear to be a performance advantage for stocks joining to the S&P 500, it appears to exist only prior to the official date of the addition, and for Tesla, any performance boost it will see as a result of its addition has likely already been realized.
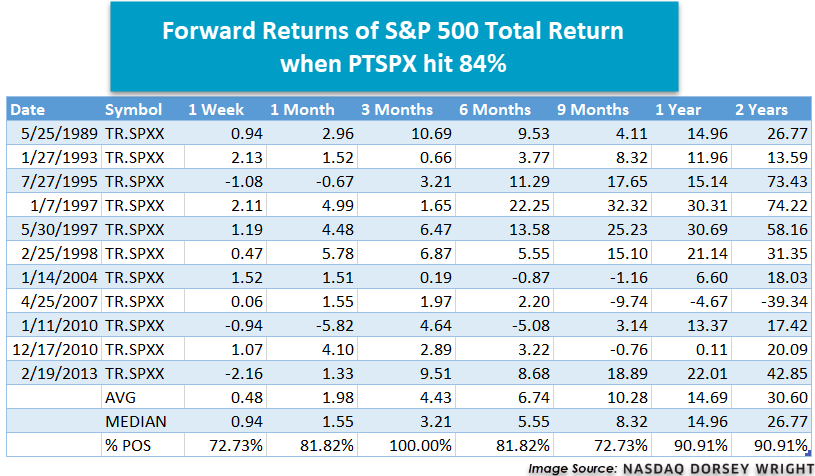
As domestic equity continues to march higher, we have seen this improvement reflected in many of our equity-based indicators. One of those is the ^PTSPX chart, which measures the percentage of stocks in the S&P 500 universe that are trading in a positive trend. Earlier this month, the indicator reversed into X’s, continued higher, and hit 84% last night (11/16), the highest level since 2014. Looking back at past occurrences, we found that there have been a handful of instances where ^PTSPX reached this level going back to 1987. Although forward returns are typically positive, what really caught our attention is the level of reliability we’re seeing when the PTSPX reaches this level. Looking out from one week to two years, at least 70% of the time the S&P 500 index has experienced a positive gain.
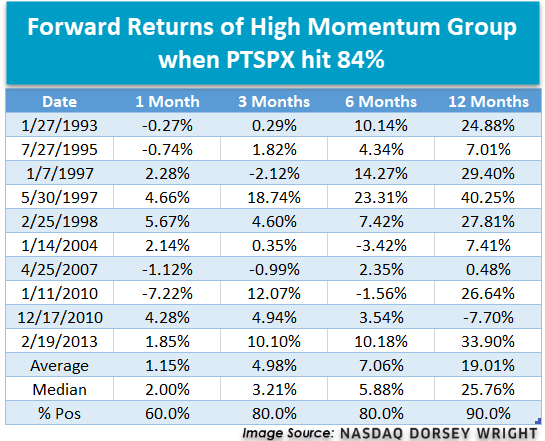
Based on the dates that we identified above, we further examined the relationship between this high ^PTSPX reading and momentum returns. The first group below is the momentum spread, which looks at how RS leaders perform compared to RS laggards. When looking out one month, the average return is more of a mixed bag; however, returns for three to 12 months out are more noticeable with the 12-month return averaging over 27%. One thing to note is that momentum runs on confidence and it performs the best when trends are most stable.

The next two groups we looked at based on the same dates above are high and low momentum names. As shown below, the high momentum group over time outperforms low momentum significantly. Not only are the returns greater, but the frequency of positive returns is more consistent. This illustrates that investing in high momentum names stacks the odds in your favor over the long run.


(Source: etf.com)
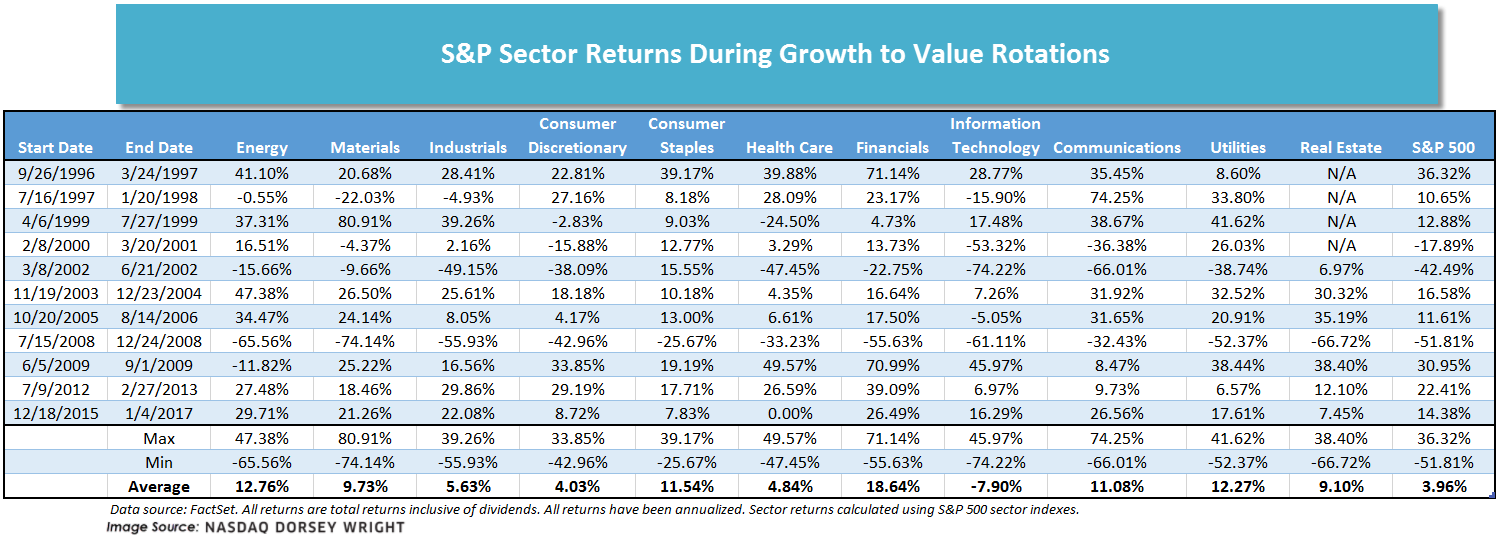
After it was reported last Monday (11/9) that preliminary data showed Pfizer’s COVID-19 vaccine to be 90% effective, the market experienced one of, if not the largest, one-day momentum-laggard rallies ever. The Dow DJIA gained 2.95% on the day as stocks that have been hard hit during the pandemic, like Disney DIS and Chevron CVX enjoyed strong rallies. Meanwhile, the Nasdaq Composite NASD was down -1.53% as investors reduced their holdings in areas that had been leading the market, like technology. Over the intervening week-and-a-half there has been a lot of talk about the “rotation” trade i.e. a shift from areas, sectors, and styles that have performed well into areas that have lagged and thus, theoretically, have more upside during recovery. One of the primary shifts mentioned as part of the rotation trade is from growth to value, as growth has outperformed value in 2020 and for most of the last several years.
Of course, within each equity style, there are a wide range of stocks spanning multiple sectors. Therefore, today we wanted to examine previous shifts from growth to value to see which sectors had the strongest performance. We began by looking at the spread between the rolling six-month returns of the Russell 1000 Value Index and the Russell 10000 Growth Index since 1995. Each time the spread peaked at 5% or more in favor of value, we looked back to a recent trough (i.e. when the spread was in favor of growth) and calculated the returns for the 11 macro sectors over that period. For example, we can see that around March 20, 2001, the spread peaked at a little over 39% in favor of value, so looking back we find it hit a trough (i.e. the relationship most favored growth) in February 2000, when the spread was just shy of -35%. We then calculated the sector returns for the interim period (2/8/2000 – 3/20/2001). The periods we examined are shaded in gray in the chart below; the line is red during periods when the spread is greater than zero (i.e. value outperformed) and blue during periods when the spread is less than zero. As the chart shows, the spread between growth and value has already narrowed significantly in recent months as it was almost -35% (in favor of growth) in September, but has risen above the -5% mark within the last week.
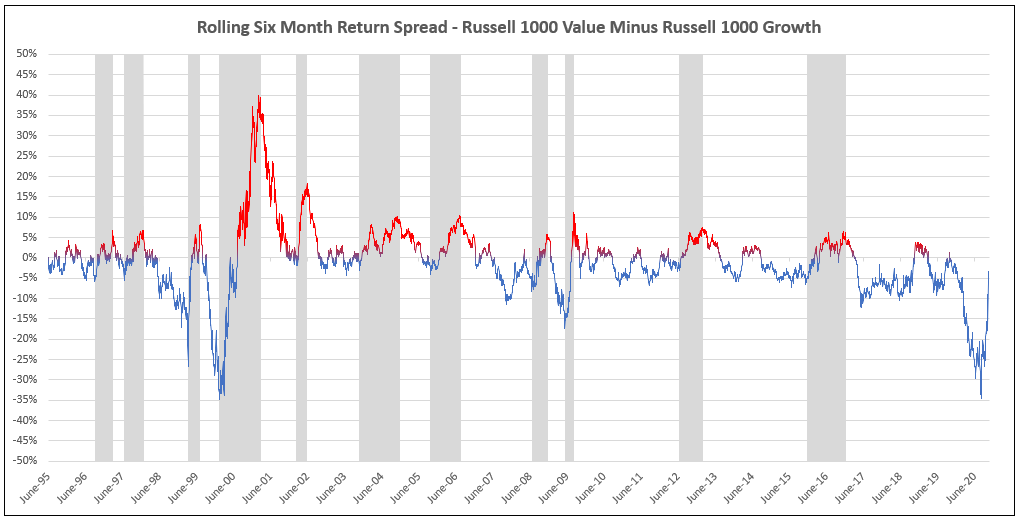
There was significant variance in the length of the periods in our study, ranging from just 88 days to more than 400 days, therefore all of the returns in the table below have been annualized in order to make them more comparable. The best performing sector, on average, during the periods we examined was financials with an average annualized return of 18.64% followed by energy, utilities, and consumer staples. On the other hand, the worst-performing sector on average was technology with an average annualized return of -7.9% and is the only sector with a negative average annualized return. Technology was also the only sector with an average return lower than the S&P 500. On the surface this may seem strange, however, our study examined only the total return of each sector during the time period in question, it did not take into account the relative weights of the sectors within the index nor how those weights may have changed over time, which could have a significant impact on the performance of the overall index. Other laggards include health care, consumer discretionary, and industrials. Technology had the worst single-period performance as it experienced a decline equal to -74.22% on an annualized basis from 3/8/02 through 6/21/02. Materials had the single best one-period performance as it gained the equivalent of 80.91% on an annualized basis from 4/6/1999 through 7/27/1999. However, it also has the second worst single period performance as it had an annualized decline of -74.14% from 7/15/08 through 12/24/08.

First Trust Sector Model Change
There are changes to the First Trust Sector ETF Model FTRUST as two ETFs are being added, both in the Financial space. The First Trust Nasdaq Bank ETF FTXO and the First Trust Nasdaq ABA Community Bank ETF QABA were both added to the model as both of these sectors reversed back into a column of X’s on their respective relative strength charts versus the S&P 500. In addition to seeing the relative strength charts reverse up, the fund score of both FTXO and QABA are above 3 suggesting the overall weight of the evidence is positive here. With the addition of FTXO and QABA to the First Trust Sector Model there are now 12 positions held with the model... (Read more)
SSTREET: Buy Regional Banks & Banks
As a refresher, the State Street Sector Model SSTREET monitors the relative strength relationships between each of the sector and industry ETFs in the model universe versus the S&P 500 Index SPX on a 6.5% scale. ETFs that are showing positive relative strength versus the SPX (measured by a column of Xs) are included in the model and are removed only when that relationship reverses into Os. Over the past week of trading, the respective RS charts comparing the SPDR S&P Regional Banking ETF KRE and the SPDR S&P Bank ETF KBE versus the S&P 500 Index reversed up into Xs, warranting their additions to the SSTREET model holdings. This model remains fully invested through sector-based ETFs within the broader State Street family of ETFs and is evaluated on a weekly basis. The number of holdings can vary based on sector leadership within changing markets, and with the addition of XRT, the model is equally weighted across 14 positions at 7.14% each. Year-to-date, the SSTREET model is up 15.31%, outperforming the S&P 500's return of 9.74% (through 11/10)... (Read more)
Invesco Commodity Model Change
There is a change to the Invesco Commodity Model POWRSHARES this week: sell the Invesco DB Gold Fund DGL and buy the Invesco DB Oil Fund DBO. DGL was removed because its rank in the model’s relative strength matrix fell below the threshold to remain a holding in the portfolio... (Read more)
Average Level
39.67
| AGG | iShares US Core Bond ETF |
| USO | United States Oil Fund |
| DIA | SPDR Dow Jones Industrial Average ETF |
| DVY | iShares Dow Jones Select Dividend Index ETF |
| DX/Y | NYCE U.S.Dollar Index Spot |
| EFA | iShares MSCI EAFE ETF |
| FXE | Invesco CurrencyShares Euro Trust |
| GLD | SPDR Gold Trust |
| GSG | iShares S&P GSCI Commodity-Indexed Trust |
| HYG | iShares iBoxx $ High Yield Corporate Bond ETF |
| ICF | iShares Cohen & Steers Realty ETF |
| IEF | iShares Barclays 7-10 Yr. Tres. Bond ETF |
| LQD | iShares iBoxx $ Investment Grade Corp. Bond ETF |
| IJH | iShares S&P 400 MidCap Index Fund |
| ONEQ | Fidelity Nasdaq Composite Index Track |
| QQQ | Invesco QQQ Trust |
| RSP | Invesco S&P 500 Equal Weight ETF |
| IWM | iShares Russell 2000 Index ETF |
| SHY | iShares Barclays 1-3 Year Tres. Bond ETF |
| IJR | iShares S&P 600 SmallCap Index Fund |
| SPY | SPDR S&P 500 Index ETF Trust |
| TLT | iShares Barclays 20+ Year Treasury Bond ETF |
| GCC | WisdomTree Continuous Commodity Index Fund |
| VOOG | Vanguard S&P 500 Growth ETF |
| VOOV | Vanguard S&P 500 Value ETF |
| EEM | iShares MSCI Emerging Markets ETF |
| XLG | Invesco S&P 500 Top 50 ETF |

| Symbol | Company | Sector | Current Price | Action Price | Target | Stop | Notes |
|---|---|---|---|---|---|---|---|
| RCII | Rent-A-Center, Inc. | Retailing | $34.71 | low to mid 30s | 65 | 24 | 4 for 5'er, 5 consec buy signals, LT peer RS buy, pos weekly & mon momentum, 3.59% yield |
| TTC | The Toro Company | Machinery and Tools | $88.68 | low to high 80s | 126 | 70 | 4 for 5'er, consec buy signals, LT market and peer RS buy signal, 1.22% yield Earnings 12/16 |
| FIVE | Five Below Inc | Household Goods | $151.38 | hi 130s - hi 140s | 149 | 120 | 5 for 5'er, top 25% of favored HOUS sector matrix, triple top breakout, potential covered write, Earn. 12/2 |
| BMCH | BMC Stock Holdings Inc. | Building | $46.93 | mid to upper 40s | 61 | 37 | 5 for 5'er, pos trend, pos mon mom, LT market RS buy, 7 consec buy signals, ATH, top of fav DWABUIL matrix |
| CMI | Cummins Inc. | Machinery and Tools | $231.86 | 216 - 236 | 304 | 188 | 5 for 5'er, pullback from ATH, consec buy signals, pos trend, top 1/3 of favored machinery & tools sector matrix. 2.36% yield |
| SGMS | Scientific Games Corporation | Gaming | $35.20 | low-to-mid 30s | 62 | 29 | 5 for 5'er, top third of GAME sector matrix, spread triple top, pullback from multi-year high, R-R>4.0 |
| LL | Lumber Liquidators Holdings Inc | Building | $26.52 | mid to upper 20s | 47 | 21 | 4 for 5'er, pos trend, 7 consec buy signals, pullback from multi-year high |
| BLMN | Bloomin' Brands Inc | Restaurants | $16.75 | 15 - 17 | 21 | 13.50 | 4 for 5'er, favored REST sector, triple top breakout, pullback to middle of trading band, pot. cov. write |
| ACN | Accenture PLC | Business Products | $244.95 | 230s - 240s | 216 | 208 | 5 for 5'er, top 1/2 of BUSI sector matrix, LT pos RS, spread triple top, 1.5% yield |
| SAIL | SailPoint Technologies Holdings, Inc. | Software | $42.56 | mid 40s | $66 | $35 | 5 for 5'er, pullback from ATH, consec buy signals, pos trend |
| Symbol | Company | Sector | Current Price | Action Price | Target | Stop | Notes |
|---|
| Symbol | Company | Sector | Current Price | Action Price | Target | Stop | Notes |
|---|---|---|---|---|---|---|---|
| AN | Autonation Inc. | Autos and Parts | $62.34 | hi 50s - low 60s | 100 | 50 | See follow comment below |
| Comment |
|---|
| AN Autonation Inc. R ($62.42) - Autos and Parts - Okay to add new exposure here. We will abide by our $50 stop. |
SAIL SailPoint Technologies Holdings, Inc. R ($43.13) - Software - SAIL is a perfect 5 for 5’er within the software sector that ranks in the top decile of the stock sector matrix, making it one of the stronger names in this space. SAIL is trading well above the bullish support line and has given a total of four consecutive buy signals since May. Earlier this month, SAIL printed a new all-time high at $49 before pulling back to support at $41. With recent market action, SAIL has reversed back into Xs to $44, putting it right in the middle of its 10-week trading band. New positions are welcome in the mid 40s. We will set our initial stop at $35. We will use a modified bullish price objective of $66 as our near-term price target.
| 17 | 18 | 19 | 20 | ||||||||||||||||||||||||||||||||||||||||||||||||||
| 49.00 | X | 49.00 | |||||||||||||||||||||||||||||||||||||||||||||||||||
| 48.00 | X | X | O | 48.00 | |||||||||||||||||||||||||||||||||||||||||||||||||
| 47.00 | X | O | X | O | 47.00 | ||||||||||||||||||||||||||||||||||||||||||||||||
| 46.00 | X | O | X | O | 46.00 | ||||||||||||||||||||||||||||||||||||||||||||||||
| 45.00 | X | O | X | O | 45.00 | ||||||||||||||||||||||||||||||||||||||||||||||||
| 44.00 | X | O | B | O | X | 44.00 | |||||||||||||||||||||||||||||||||||||||||||||||
| 43.00 | A | O | X | O | X | Mid | 43.00 | ||||||||||||||||||||||||||||||||||||||||||||||
| 42.00 | X | O | X | O | X | 42.00 | |||||||||||||||||||||||||||||||||||||||||||||||
| 41.00 | 9 | X | O | O | 41.00 | ||||||||||||||||||||||||||||||||||||||||||||||||
| 40.00 | X | O | X | 40.00 | |||||||||||||||||||||||||||||||||||||||||||||||||
| 39.00 | X | O | X | 39.00 | |||||||||||||||||||||||||||||||||||||||||||||||||
| 38.00 | X | O | X | 38.00 | |||||||||||||||||||||||||||||||||||||||||||||||||
| 37.00 | X | O | X | 37.00 | |||||||||||||||||||||||||||||||||||||||||||||||||
| 36.00 | X | O | 36.00 | ||||||||||||||||||||||||||||||||||||||||||||||||||
| 35.00 | • | X | 35.00 | ||||||||||||||||||||||||||||||||||||||||||||||||||
| 34.00 | X | • | X | 34.00 | |||||||||||||||||||||||||||||||||||||||||||||||||
| 33.00 | X | O | • | • | 8 | 33.00 | |||||||||||||||||||||||||||||||||||||||||||||||
| 32.00 | 9 | O | • | X | • | X | 32.00 | ||||||||||||||||||||||||||||||||||||||||||||||
| 31.00 | X | A | • | X | O | • | X | Bot | 31.00 | ||||||||||||||||||||||||||||||||||||||||||||
| 30.00 | X | O | • | X | O | X | • | X | 30.00 | ||||||||||||||||||||||||||||||||||||||||||||
| 29.00 | X | X | O | • | 2 | 3 | X | O | • | 7 | 29.00 | ||||||||||||||||||||||||||||||||||||||||||
| 28.00 | X | X | O | X | O | • | X | O | X | O | • | • | X | 28.00 | |||||||||||||||||||||||||||||||||||||||
| 27.00 | 6 | O | 7 | O | X | O | B | X | C | X | O | 4 | • | X | • | • | X | 27.00 | |||||||||||||||||||||||||||||||||||
| 26.00 | 5 | X | O | X | O | 8 | O | X | O | X | O | X | O | X | 5 | • | 1 | O | X | • | X | 26.00 | |||||||||||||||||||||||||||||||
| 25.00 | X | O | X | O | X | O | X | O | X | O | X | O | X | O | X | O | • | X | O | X | O | • | X | 25.00 | |||||||||||||||||||||||||||||
| 24.00 | X | O | X | O | O | X | O | O | O | X | O | 1 | O | • | X | 2 | X | O | • | 6 | 24.00 | ||||||||||||||||||||||||||||||||
| 23.00 | 3 | X | O | X | O | O | • | O | X | • | O | X | X | O | 3 | • | X | 23.00 | |||||||||||||||||||||||||||||||||||
| 22.00 | X | O | 4 | O | • | O | X | • | O | X | X | O | X | O | • | X | 22.00 | ||||||||||||||||||||||||||||||||||||
| 21.00 | X | O | X | • | O | • | O | 7 | O | X | O | X | O | X | • | X | 21.00 | ||||||||||||||||||||||||||||||||||||
| 20.00 | X | O | X | • | • | O | X | O | X | 9 | B | O | X | O | • | X | 20.00 | ||||||||||||||||||||||||||||||||||||
| 19.50 | X | O | • | O | X | X | 8 | X | O | X | O | X | O | • | X | 19.50 | |||||||||||||||||||||||||||||||||||||
| 19.00 | X | • | O | X | O | X | O | O | X | • | O | X | O | • | X | 19.00 | |||||||||||||||||||||||||||||||||||||
| 18.50 | X | • | O | X | O | X | O | X | • | O | O | X | X | 18.50 | |||||||||||||||||||||||||||||||||||||||
| 18.00 | X | • | O | O | X | A | • | O | X | O | X | 18.00 | |||||||||||||||||||||||||||||||||||||||||
| 17.50 | X | X | • | O | X | • | O | X | X | O | X | • | 17.50 | ||||||||||||||||||||||||||||||||||||||||
| 17.00 | X | O | X | • | 6 | O | X | O | X | 5 | • | 17.00 | |||||||||||||||||||||||||||||||||||||||||
| 16.50 | • | • | X | O | X | • | O | X | O | X | • | 16.50 | |||||||||||||||||||||||||||||||||||||||||
| 16.00 | X | • | C | • | X | O | X | • | O | X | X | O | X | • | 16.00 | ||||||||||||||||||||||||||||||||||||||
| 15.50 | X | O | X | O | 1 | 2 | X | • | O | X | O | X | O | X | • | 15.50 | |||||||||||||||||||||||||||||||||||||
| 15.00 | X | O | X | O | X | O | • | O | X | O | X | O | X | • | 15.00 | ||||||||||||||||||||||||||||||||||||||
| 14.50 | X | O | O | X | • | O | X | O | X | 4 | X | • | 14.50 | ||||||||||||||||||||||||||||||||||||||||
| 14.00 | X | O | • | O | X | O | O | X | • | 14.00 | |||||||||||||||||||||||||||||||||||||||||||
| 13.50 | B | • | O | X | O | • | 13.50 | ||||||||||||||||||||||||||||||||||||||||||||||
| 13.00 | X | • | O | X | • | • | 13.00 | ||||||||||||||||||||||||||||||||||||||||||||||
| 12.50 | X | • | O | X | • | 12.50 | |||||||||||||||||||||||||||||||||||||||||||||||
| 12.00 | X | • | O | • | 12.00 | ||||||||||||||||||||||||||||||||||||||||||||||||
| 17 | 18 | 19 | 20 |
| AZPN Aspen Technology Inc ($128.64) - Software - AZPN rose Tuesday to break a double top at $126 before continuing to $128 intraday, which broke through the bearish resistance line to put the stock back in a positive trend. Now a 4 for 5'er, AZPN ranks in the top half of the software sector RS matrix and has been on an RS buy signal against the market since mid-2011. The weight of the evidence is improving here. Exposure may be considered on this breakout, with initial support offered at $116. Further support can be found at $112 and $110. Initial overhead resistance may come at $136 from October. |
| BC Brunswick Corporation ($72.43) - Leisure - BC broke a double top at $72 before moving $73, marking the third consecutive buy signal on the chart. BC is a 4 for 5’er within the favored leisure sector that is now testing its all-time high printed back in July. From here, support sits at $64. |
| FRGI Fiesta Restaurant Group Inc ($11.25) - Restaurants - FRGI broke a double top $11.50, marking the second consecutive buy signal on the chart. FRGI is a 3 for 5’er within the restaurants sector that has experienced four months of positive monthly momentum. Resistance sits at $13 while support sits at $9. |
| GCO Genesco Inc. ($28.58) - Textiles/Apparel - GCO broke a double top at $28 on Tuesday. GCO is a 3 for 5’er within the favored textiles/apparel sector that is trading in a positive trend. Additionally, weekly momentum just flipped positive, suggesting the potential for higher prices. From here, support sits at $18. Earnings are expected on 12/4. |
| KNSL Kinsale Capital Group Inc ($231.77) - Insurance - KNSL shares moved higher today to break a double top at $224 and continued higher to $232 which is a new all-time high. This 4 for 5'er has been in a positive trend since April and on an RS buy signal since February. KNSL is actionable at current levels with a weekly overbought/oversold reading of 59%. From here, support is offered at $208. |
| NCR NCR Corporation ($25.12) - Computers - Shares of NCR moved higher Tuesday to break a double top at $25, marking a third consecutive buy signal. This 3 for 5'er moved to a positive trend in July and ranks in the top third of the computers sector RS matrix. Weekly momentum also just flipped positive, suggesting the potential for further upside from here. Those looking to add exposure may consider the stock here, with initial support offered at $19.50. The bullish support line is also currently found at $19. |
| ORA Ormat Technologies, Inc. ($82.26) - Utilities/Electricity - ORA broke a double top at $83 on Tuesday, marking the second consecutive buy signal on the chart. ORA is a strong 4 for 5’er within the utilities/electricity sector that has maintained a long-term market RS buy signal since March 2015. Monthly momentum just flipped positive, suggesting the potential for higher prices. From here, support sits at $77. |
| ROKU Roku, Inc. Class A ($237.08) - Media - ROKU completed a bullish triangle pattern at $240, marking the fifth consecutive buy signal on the chart. ROKU is a 4 for 5’er within the media sector that is trading well above the bullish support line. From here, ROKU faces resistance at $252 while initial support sits at $224. |
| SQ Square Inc ($188.37) - Software - Shares of SQ reversed up into a column of Xs Tuesday and completed a bullish triangle at $186, before continuing to $190 intraday. This 5 for 5'er ranks 9th out of 120 names in the software sector RS matrix and has been in a positive trend since April. The overall technical picture remains strong here. Exposure may be considered at current levels, with initial support offered at $174. Further support can be found at $168 and $152, with initial overhead resistance coming at $200 from earlier this month. |
| TTD The Trade Desk Inc ($781.24) - Internet - TTD advanced Tuesday to complete a bullish triangle pattern at $768 before rising to $784 intraday. This 5 for 5'er moved to a positive trend in April and ranks 3rd out of 54 names in the internet sector RS matrix. The stock has also been on an RS buy signal against the market since early-2017. The technical picture remains sound here, however, the recent price appreciation has left TTD in overbought territory so those looking to add exposure would be best served to wait for a pullback or normalization of the trading band. Initial support can be found at $720 with further support offered at $704. |
| WTFC Wintrust Financial Corporation ($55.91) - Banks - WTFC shares broke a double top at $56 to mark its fourth consecutive buy signal. This 4 for 5'er has been in a positive trend since October and on an RS buy signal versus the market since April. Those wishing to initiate a long position may be best served to wait for a pullback or price normalization as recent price action has put WTFC into heavily overbought territory. From here, support can be found at $51. |
| Name | Option Symbol | Action | Stop Loss |
|---|---|---|---|
| Dow, Inc. - $54.48 | DOW2119C50 | Buy the March 50.00 calls at 6.80 | 50.00 |
| Name | Option | Action |
|---|---|---|
| International Paper Company ( IP) | Jan. 45.00 Calls | Raise the option stop loss to 3.80 (CP: 5.80) |
| Freeport-McMoRan Inc. ( FCX) | Jan. 16.00 Calls | Raise the option stop loss to 3.20 (CP: 5.20) |
| T-Mobile US Inc. ( TMUS) | Jan. 115.00 Calls | Raise the option stop loss to 13.30 (CP: 15.30) |
| Viacom CBS Inc. ( VIAC) | Jan. 26.00 Calls | Raise the option stop loss to 4.35 (CP: 6.35) |
| United Parcel Service, Inc. ( UPS) | Apr. 160.00 Calls | Raise the option stop loss to 15.35 (CP: 17.35) |
| NIKE, Inc. ( NKE) | Mar. 125.00 Calls | Initiate an option stop loss of 11.25 (CP: 13.25) |
| Name | Option Symbol | Action | Stop Loss |
|---|---|---|---|
| Johnson & Johnson - $149.35 | JNJ2119O155 | Buy the March 155.00 puts at 12.55 | 158.00 |
| Name | Option | Action |
|---|---|---|
|
|
||
| Name | Option Sym. | Call to Sell | Call Price | Investment for 500 Shares | Annual Called Rtn. | Annual Static Rtn. | Downside Protection |
|---|---|---|---|---|---|---|---|
| Truist Financial Corp $48.57 | TFC2119C50 | Mar. 50.00 | 3.10 | $22,791.35 | 25.83% | 16.98% | 5.37% |
| Name | Action |
|---|---|
| The Chemours Company (CC) - 23.15 | Sell the January 23.00 Calls. |
| L Brands Inc. (LB) - 34.76 | Sell the January 35.00 Calls. |
| The Gap, Inc. (GPS) - 24.16 | Sell the January 23.00 Calls. |
| Bank of America (BAC) - 27.58 | Sell the February 28.00 Calls. |
| Synchrony Financial (SYF) - 31.11 | Sell the March 31.00 Calls. |
| Sysco Corporation (SYY) - 74.97 | Sell the February 75.00 Calls. |
| Name | Covered Write |
|---|---|
|
|
|
Daily Equity & Market Analysis
Loading, Please Wait...
