We take a look at the relationship between Small Cap Value and Long Duration Fixed Income.
Over the last few weeks, we’ve seen value and small caps finally beginning to show some signs of life with Small Cap Blend and Small Cap Value having the highest score directions when looking at the US Styles view on the Asset Class Group Scores page. While it’s too early to tell if there will be a rotation from growth into value, the broadening out of the market is a healthy sign. On the other hand, we have seen the US Fixed Income Long Duration group drop below the 3.00 threshold as we’ve seen interest rates trending upwards. Since Small Cap Value has a large amount of exposure to financials, it will be important to monitor groups that are sensitive to moves in interest rates like US Fixed Income Long Duration to get more confirmation of strength. When we look at the average group scores for Small Cap Value and US Fixed Income Long Duration, we can see they are fairly inversely correlated.
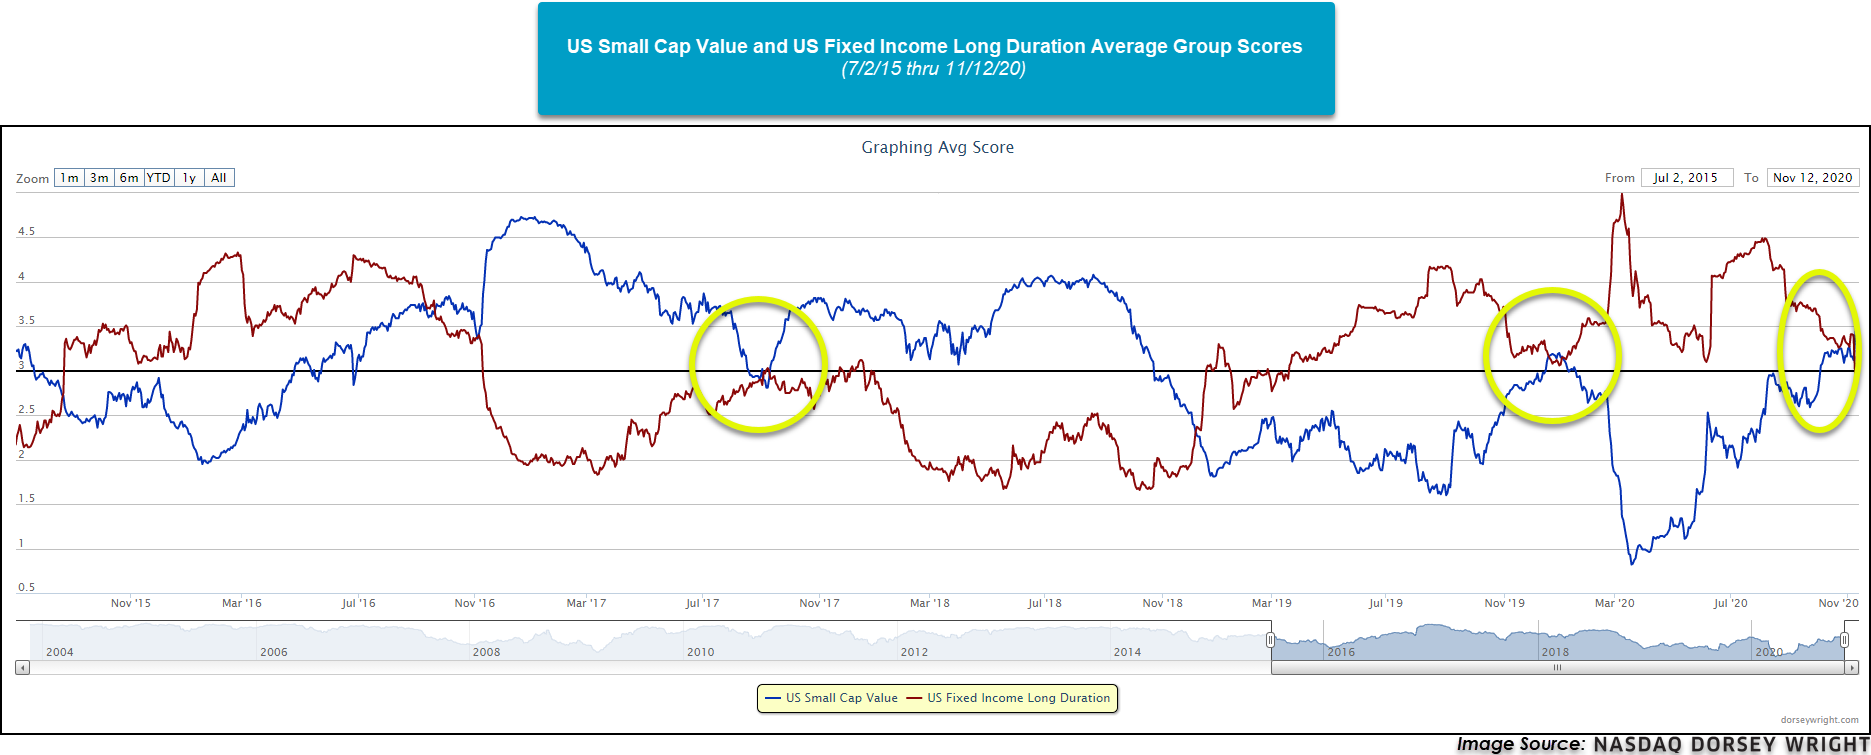
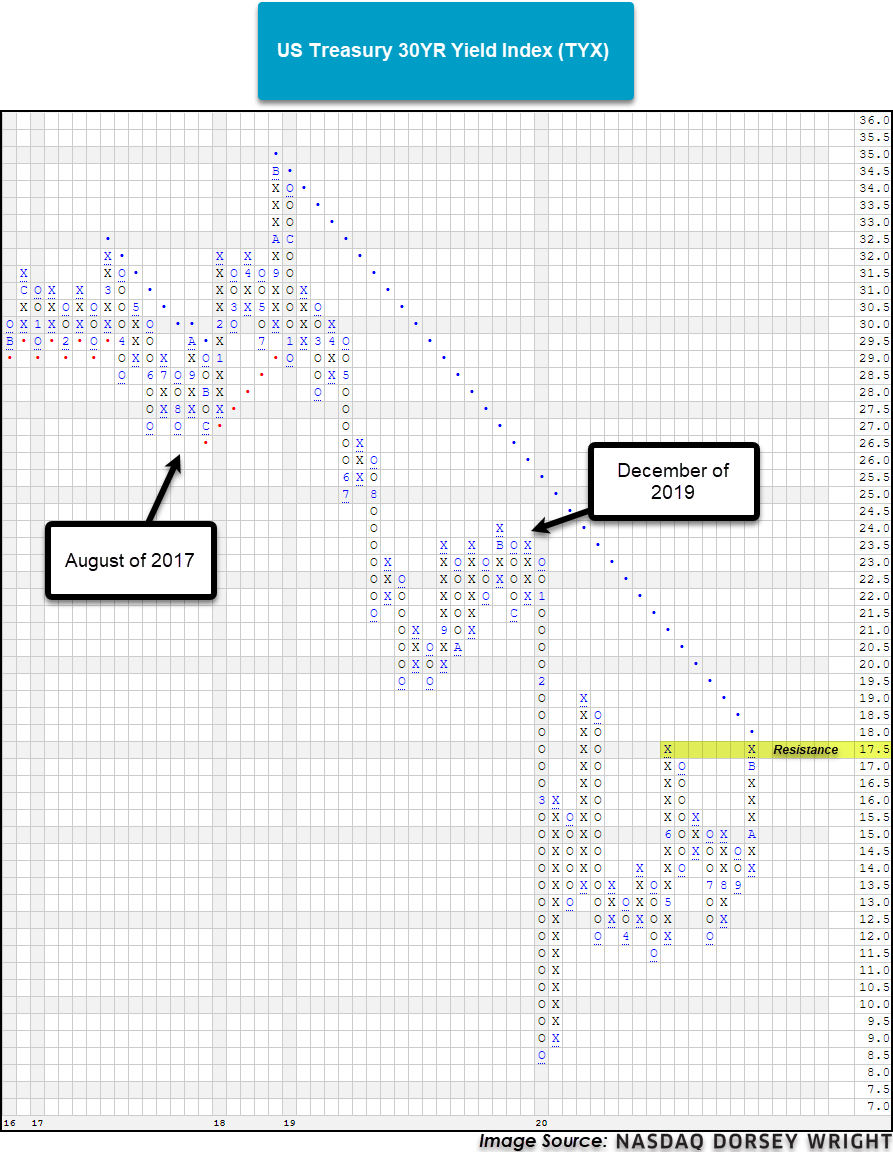
Looking at the last few years, the two groups have met around the 3.00 mark a few times, each occurring when the US Treasury 30YR Yield Index TYX was at some point of resistance or support. In August of 2017, rates were able to hold support and the US Fixed Income Long Duration group was unable to break above the 3.00 mark while the US Small Cap Value group was able to hold above. The next meeting around the 3.00 threshold was in December of 2019 and the 30YR Yield Index failed to break above 23.50 and the US Fixed Income Long Duration group was able to hold above the 3.00 mark while the US Small Cap Value group was unable to move above the threshold. Lastly, the most recent battle of the 3.00 mark between the two groups is happening right now and the 30YR Yield Index is at a point of resistance yet again at 17.50. If rates were able to break above this point, it would be reasonable to expect that US Small Cap Value would see a continuation to the upside as Financials, another group that has shown strong improvement over the last month, benefits from higher interest rates.
As we are heading towards the end of 2020, it will be important to monitor for any signs of rotation between asset classes. After a long period of leadership for Large Cap Growth, it’s too early to tell if we are in fact seeing a rotation into value. Moving forward, be sure to visit the Asset Class Group Scores Page so if/when we do see any leadership changes you can shift your allocations accordingly.
A message from Steve Raymond:
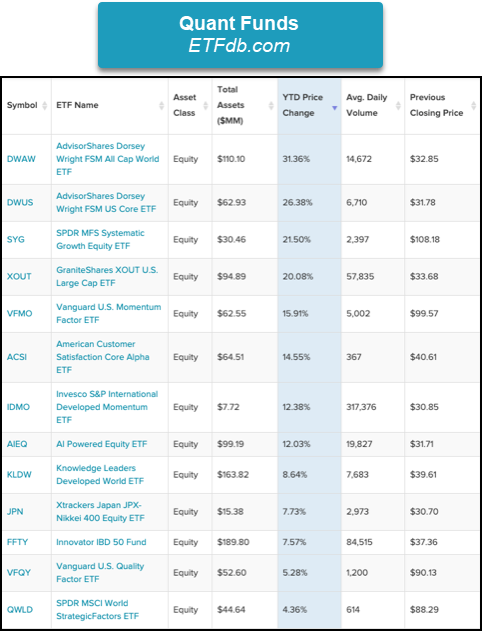
If you weren't already aware, keep in mind that FSM is available in ETF format and is climbing the various lists of attention. Like below for example, from the folks at ETFdb.com where we can see that both the FSM US Core (DWUS) as well as the FSM All Cap World (DWAW) continue to lead their Quant-based ETF List. This ETFdb.com list is populated with their Quant categorized funds that rely on algorithmic or systematically programmed investment strategies. With word of mouth spreading the FSM news, the net assets between these two funds is rapidly moving up towards 200 million. I appreciate this and more importantly, I appreciate your grassroots support for the FSM endeavor over the years. More good stuff is on the way, but don’t forget “these two” opportunities, as they are designed to be “used together” and represent a very important set of plugin solutions within the FSM ecosystem.
Best,
Steve