The breadth of increased equity participation to the upside over the past week has not been limited to domestic equity markets, as we have seen international equities move back into the top half of the DALI rankings.
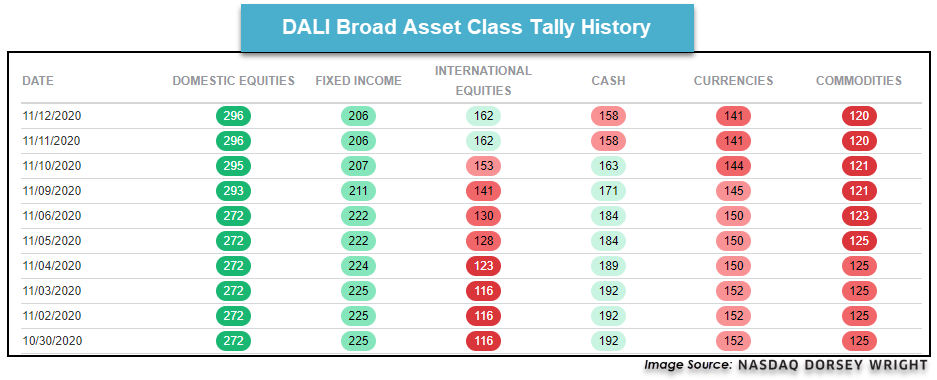
The breadth of increased equity participation to the upside over the past week has not been limited to domestic equity markets, as we have seen international equities demonstrate substantial improvements from a relative strength perspective. This is perhaps most noticeable in our Dynamic Asset Level Investing (DALI) tool, as international equities now sits in the top half of the asset class rankings at third out of the six broad areas examined. Prior to the COVID-induced global equity decline in the first quarter of this year, international equities had remained second in the DALI rankings since January 2017. The volatility that ensued in March of this year led the asset class to a tally count low of only 65 signals by the end of that month. During that decline, we saw international equities lose 127 buy signals in the five-day span ended on March 12, the most significant five-day signal decline for the asset class throughout the entire DALI history dating back to late-2005.
While there have certainly been pockets of strength within international equities over the past few months, the asset class began the month of November in the last position in DALI and remained at that spot through November 4 with a tally count of 123 buy signals. However, the last few days led international equities to gain 39 buy signals to arrive at a tally count of 162 on November 11, where the asset class remains through trading Thursday. This 39 signal increase is the largest five-day signal gain for international equities since the 2008-2009 market environment, which saw extreme signal movement due to the broader market volatility. Since that time, there have only been two other periods that saw international equities gain 30 or more buy signals in a five-day span, occurring in February 2012 and August 2016. It is important to keep in mind that an asset class ranking change is not technically cemented until we see a five signal dispersion between the areas in question, and cash still sits just 4 signals behind international equities. However, the current ranking of third for international equities does not have any allocation ramifications from a DALI Tactical Tilt strategy standpoint, which is the main place we see the five signal dispersion rule implemented. Keep this signal dispersion rule in mind if we continue to see international equities move higher in the DALI rankings, which may affect the Tactical Tilt strategies.
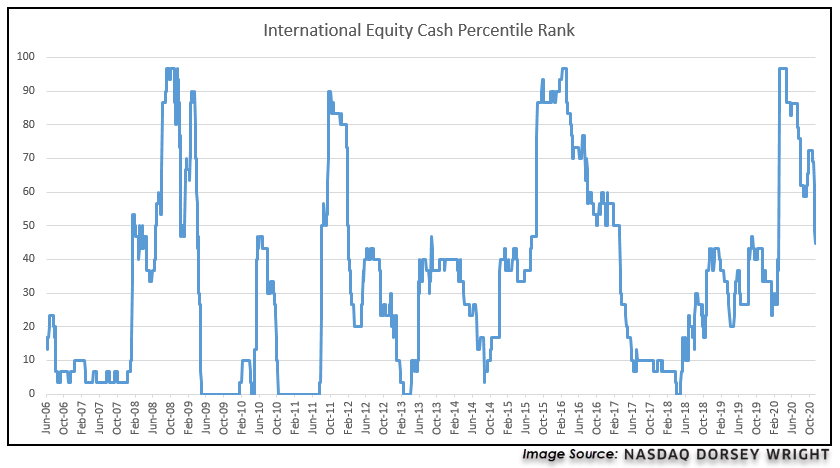
The relative strength improvement from international equities has also been demonstrated in the Cash Percentile Rank for the asset class over the past few days, as we have seen that percentile reading come down from north of 70% in late-October to a reading of 44.83% through trading Thursday. As a refresher, this reading depicts the percentage of names cash is ranked above in a broad international equities matrix, with lower readings indicating strength from the asset class against cash. This move transitions international equities from a weak, “red light” indication to an average “yellow light” indication as the percentile rank fell into the middle third. This swiftness with which we have seen this percentile rank decline is also notable, as the indicator has fallen by 24.14% over the past 10 trading days. There has not been this sharp of a decline in the cash percentile rank for international equities since February 2012, similar to the uptick in buy signals for the asset class in the DALI rankings. Additionally, a historical view of this percentile rank reveals that the 50% level has been a line of demarcation for this reading, as each of the three moves beneath this threshold since the beginning of 2009 has ultimately led to a reading of 20% or below within a few months.
In order to discern which areas within the improving international equities asset class are strongest, we can look toward the NDW country index matrix rankings that we introduced earlier this year. These rankings utilize the 43 individual NDW country indexes in a relative strength matrix ranking to establish buy, hold and sell designations for each country. Those representatives that are found in the top quartile, or eleven names, are areas that would be most favorable for new allocations according to relative strength. The countries in the second quartile are still suitable for investment but have not shown as much consistent strength, leading them to a “hold” classification. Countries found in the bottom half would not be ideal from a relative strength perspective and would receive the “sell” classification.
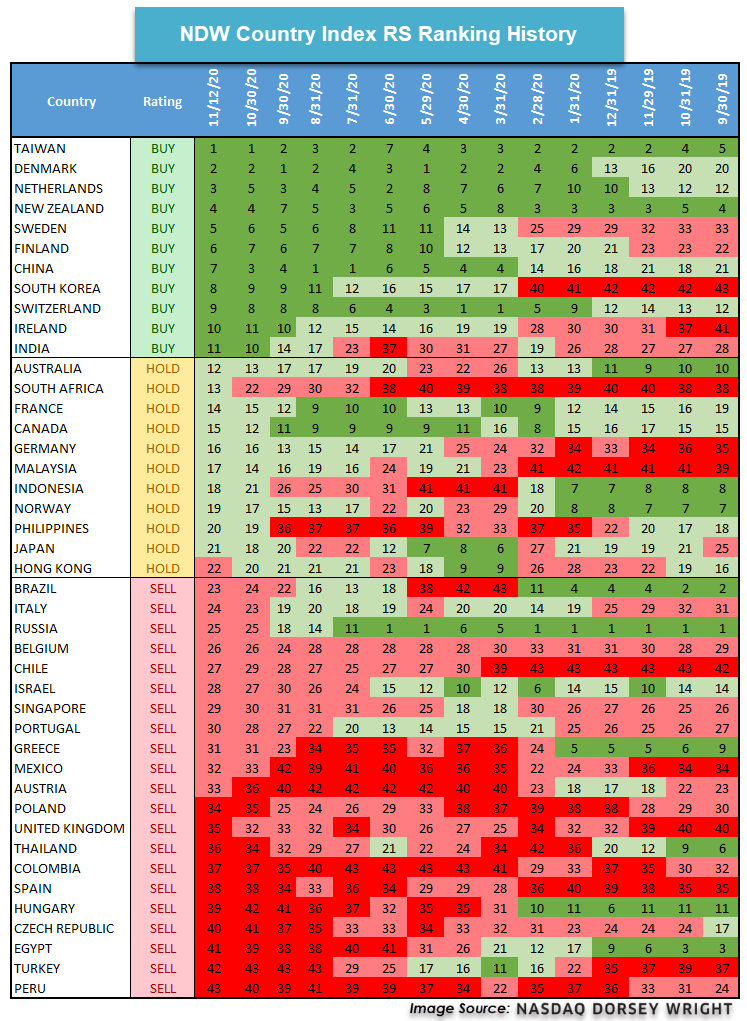
The top end of these rankings has shown little change over the past few months, with India being the only new addition in the fourth quarter. Europe has substantial representation at the top of the rankings, including Denmark, the Netherlands, Sweden, Finland, and Switzerland. These areas have maintained a “buy” designation since May of this year, however, we continue to see underweight positions in these countries throughout most broad developed market funds. As an example, we see that Switzerland, the Netherlands, Sweden, and Denmark combine for an allocation of just under 20% within the iShares MSCI EAFE ETF EFA, and Finland does not even receive enough allocation to be included as an individual representative. This highlights how using relative strength analysis to gain more focused exposure toward areas of strength in developed markets can allow for further separation from the bulk of international equity investors.
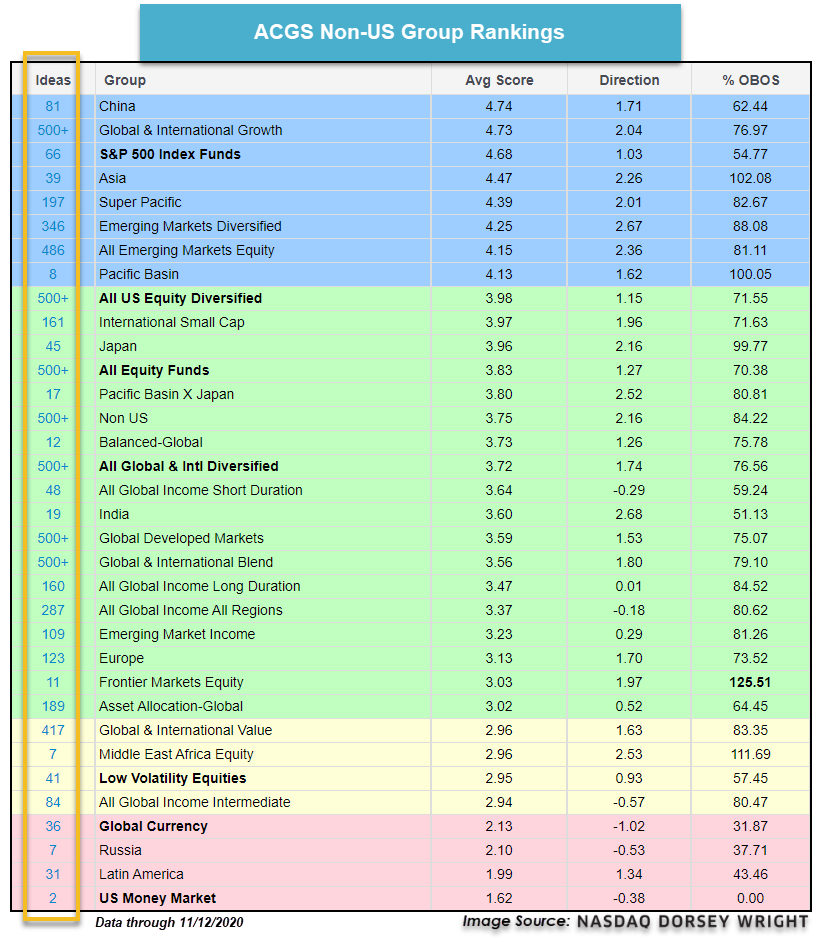
Interestingly enough, there are only three emerging market representatives found in the top quartile of names, specifically looking at Taiwan, China, and India. However, Taiwan and China have been among the most consistently strong countries since February of this year, and also show continued strength in other relative comparisons across the NDW system, such as the Asset Class Group Scores (ACGS) page, which incorporates both absolute and relative strength characteristics into the score rankings. China has been the highest-ranked international group in these rankings for most of the past several months, and still ranks ahead of the core domestic equity representative, the S&P 500 Index funds group, in average group score (as discussed in last Thursday’s Fund Score Overview). The strength of both China and Taiwan have led the iShares MSCI Emerging Markets ETF EEM to a year-to-date return of 6.22%, as those two countries alone combine for over 53% of the fund’s allocation. Comparatively, the underperformance of EFA on a year-to-date basis with a return of -1.61% can be at least partially explained by the underweighting of high relative strength countries within the broad-developed representative.
Those looking to capitalize on the recent improvement in international equities have a variety of idea generation options available on the NDW system. One, in particular, can be found on the ACGS page, which can be filtered through the non-US view selection. As previously mentioned, China and other Asian groups continue to maintain high positions in these rankings through their elevated scores. Europe as a whole is not scoring quite as high, but it is important to note that this Europe group includes favorable names as well as not so favorable areas, such as the United Kingdom. The “Ideas” link to the left of each group name can be used to dive deeper into each region, as the fund representatives will then be sorted by their fund scores to further differentiate between areas of strength and weakness.