
Most Requested Symbols

Today we explore two separate ways to find technically-sound dividend-paying stocks on the NDW Research Platform: the DWA Yield Portfolio and a custom stock screen with timely and actionable results.
Today's featured stock is Quest Diagnostics Incorporated (DGX)
ACN, APD, CGNX, CHE, ECL, LGIH, LOW, MA, NDSN & PYPL.
Call: Franco-Nevada Corp (FNV); Put: Western Union Company (WU); Covered Write: Rent-A-Center Inc (RAC).
Applying the Fund Score Method through FSM Models: Join us on Thursday, May 21st at 1pm ET for a live webinar on the application of fund scores in a systematic, rules-based model. This webinar will feature an overview of the various FSM strategies and potential implementation ideas. Click here to register!
Replay for Fund Scores and Asset Class Group Scores Webinar: We have a replay available for our latest webinar on Fund Scores and the Asset Class Group Scores page that took place on Thursday, May 14th. In this webinar, we explore the concepts and methodology used to calculate the Fund Score that is assigned to ETFs and Mutual Funds across the NDW Research Platform. Click here to view the replay!
Investors started their weeks on Monday morning (5/18) to the Dow Jones Industrial Average DJIA, S&P 500 SPX and Nasdaq Composite NASD each rallying in excess of 3%. The gap higher diluted the losses posted last week (ending 5/15) in which the major equity indices fell in the neighborhood of -2%, their worst week in almost two months (source: wsj.com). With today’s movement upward the 20-point chart for SPX (pictured below) returned to a buy signal with a triple top break at 2960, continuing its relatively steep ascent well-above the bullish support line. Additionally, the bullish percent indicator for the S&P 500 BPSPX will return to a column of Xs near the 50-yard line (based on intraday readings), meaning that approximately 50% of stocks in the S&P 500 will be trading on a Point and Figure buy signal on their trend chart. This increase in participation signaled by the reversal up into Xs is especially notable and welcomed given the fact that only 89 stocks in the S&P 500 have posted positive returns year-to-date (through 5/15) while 99 stocks in the index are down -40% or more.
To further pile on the generally bullish statistics we find the S&P 500 roughly 9% above its 50-day moving average, and perhaps to a surprise, this has historically been a positive event. If able to surpass the 10% threshold, the data point would align with lows hit in 2009, 1998, 1991, 1982, and 1975. Recognizing that elevated levels of volatility remain present, investors should remain cautious and highly conscious of their underlying holdings / risk tolerance. To receive intraday alerts on further action, consider using the blue “Set Alert” button located near the top of each chart page.


If you are an income investor, chances are that your income needs persist or may even increase during periods of market volatility and economic uncertainty. With bond yields near historic lows, as evidenced by the US Treasury 10YR Yield Index TNX trading at 0.675%, and cash-like vehicles such as the Vanguard Prime Money Market Fund VMMXX yielding a mere 2.12%, many simply cannot afford to park money in conservative asset classes. This creates a dilemma in the current environment as both cash and fixed income rank first and second, respectively, in the broad asset class relative strength rankings in DALI. However, even prior to the recent bout of market volatility, investors have had to venture into riskier asset classes such as domestic equities in order to maintain a required level of income as the long-term trend for rates has been negative. While the idea of taking on more risk in order to maintain your goals and lifestyle was an afterthought with domestic equities ranked atop of the broader asset class rankings in DALI, as it had been for the better part of the last decade, today’s third-place ranking requires an extra level of diligence for dividend stock pickers. Further, the current dominance of growth-style equities within the broader asset class necessitates additional consideration with an emphasis on only the soundest individual technical names from within blend or value-style categories. Today, we're going to highlight two ways to find high-RS dividend-paying stocks on the NDW Research Platform.
The first way to find high-RS dividend-paying stocks is by using the DWA Yield Portfolio SPX500YLD. The model employs a systematized approach toward picking dividend-focused and high-RS individual names, holding up to 5 stocks at once. The model draws from strong attribute and high-yielding members within the S&P 500 Index SPX, using a daily-evaluated RS Matrix to determine the top names from the overall universe. Currently, the model has 100% exposure to energy stocks for the first time ever since the model’s inception in October of 2009 and maintains a weighted average yield of 5.85%. Additionally, the model has outperformed SPX by over 900 basis points on a year-to-date basis.

The second way is by using specifically-curated criteria to find strong and actionable names. With the overall market backdrop in mind, we used the Stock Screener tool (found under Security Selection > Security Screener) to identify those S&P 500 stocks that have decent volume, have attributes of 3 or higher, maintain a buy signal, and a positive trend on their chart, and are within buyable ranges on their weekly distribution curves. Additionally, we sought out those stocks that are yielding 2% or higher, as our goal with this screen was to find stocks that are yielding higher than the S&P 500 Trust ETF SPY. The search criteria listed below resulted in 19 stocks.
Search Criteria:
Technically-Sound Dividend-Paying Stocks
| Symbol | Name | Price | Tech Attrib/Score | Broad Sector | Yield | Overbought/Oversold | ||
|---|---|---|---|---|---|---|---|---|
| ADI | Analog Devices, Inc. | 101.80 |
3 |
Technology | 2.44 |
|
||
| AJG | Arthur J. Gallagher & Co. | 87.23 |
4 |
Financial | 2.06 |
|
||
| AVGO | Broadcom Ltd | 260.41 |
3 |
Technology | 4.99 |
|
||
| CMCSA | Comcast Corporation | 35.92 |
4 |
Consumer Cyclical | 2.56 |
|
||
| DRE | Duke Realty Corporation | 30.83 |
5 |
Real Estate | 3.05 |
|
||
| HSY | The Hershey Company | 130.38 |
3 |
Consumer Noncyclical | 2.37 |
|
||
| INTC | Intel Corporation | 58.28 |
4 |
Technology | 2.27 |
|
||
| KLAC | KLA Corp | 167.43 |
5 |
Technology | 2.03 |
|
||
| KMB | Kimberly-Clark Corporation | 138.64 |
3 |
Consumer Noncyclical | 3.09 |
|
||
| LNT | Alliant Energy Corporation | 45.95 |
5 |
Utilities | 3.31 |
|
||
| MDLZ | Mondelez International Inc. | 49.96 |
4 |
Consumer Noncyclical | 2.28 |
|
||
| MXIM | Maxim Integrated Products Inc | 52.06 |
3 |
Technology | 3.69 |
|
||
| NLOK | NortonLifeLock Inc. | 20.03 |
3 |
Technology | 2.50 |
|
||
| NRG | NRG Energy, Inc. | 32.60 |
5 |
Utilities | 3.68 |
|
||
| PEP | PepsiCo, Inc. | 135.95 |
4 |
Consumer Noncyclical | 3.01 |
|
||
| PG | The Procter & Gamble Company | 114.61 |
3 |
Consumer Noncyclical | 2.76 |
|
||
| RSG | Republic Services, Inc. | 79.47 |
4 |
Industrial | 2.04 |
|
||
| UNP | Union Pacific Corporation | 151.24 |
5 |
Industrial | 2.56 |
|
||
| VZ | Verizon Communications Inc. | 54.71 |
3 |
Communications | 4.50 |
|
Duke Realty Corporation DRE
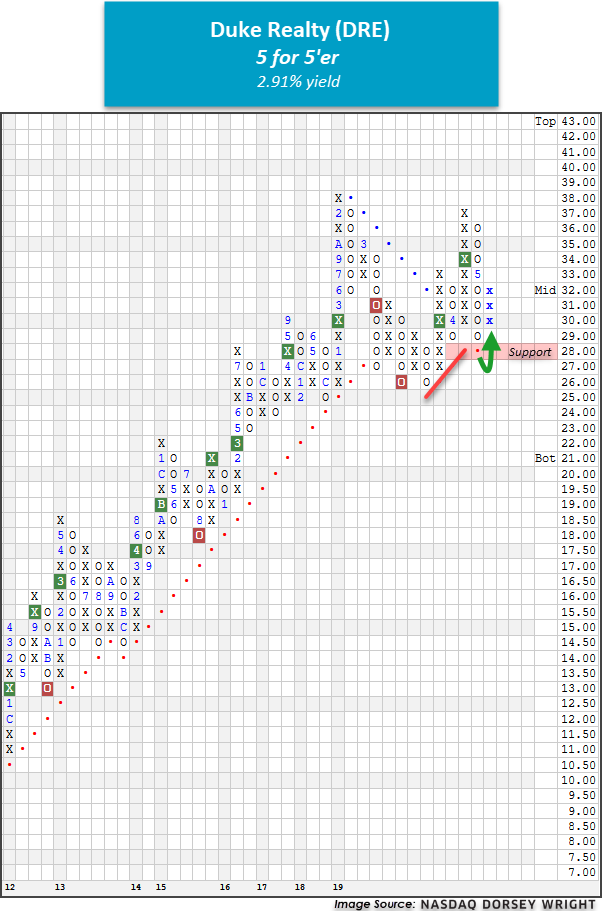
One strong dividend-payer is Duke Realty Corporation DRE. This 5 for 5’er returned to a positive trend in late March and ranks in the top third of the favored real estate sector RS matrix. Additionally, DRE has maintained a market RS buy signal since May of 2016, confirming long-term strength against the broader market. Currently, the stock trades on a second consecutive buy signal and has just reversed up into Xs following a test of its bullish support line. Demand is in control and long exposure may be added here with initial support offered at $29. DRE carries a dividend yield of 2.91% and displays a low relative risk (rRisk) reading of 0.94, which is notable considering the diversified S&P 500 Index SPX benchmark reading is 1.00.
PepsiCo, Inc. PEP
PEP is a solid 4 for 5’er that moved back into a positive trend in early April. This large-cap stock ranks in the top half of the favored food beverages/soap sector and maintains a long-term market RS buy signal. PEP has given two consecutive buy signals since March, confirming that demand is in control. At current levels, PEP sits just two boxes away from completing a third consecutive buy signal at $140. With a solid technical picture, a weekly distribution reading of just 22% overbought, and a yield of 3.02%, new positions are welcome here. Note that the stock’s all-time high from February of this year sits at $146 while initial support is offered at $130. Year-to-date, PEP is outpacing the S&P 500 by 10.83% (through 5/15).

Union Pacific Corporation UNP
UNP is a perfect 5 for 5’er within the transports/non air sector that has maintained a market RS buy signal since July 2002, confirming the stock’s superior strength versus the broader market. In addition, UNP has maintained a long-term peer RS buy signal since October 2008 and offers a yield of 2.43%. In late-April, UNP returned to an overall positive trend when it broke a spread triple top at $152 before rallying to $166. UNP experienced a brief pullback to $148, however, with today’s market action, the chart has returned to a column of Xs at $160. From current levels, UNP sits just four boxes away from marking a second consecutive buy signal at $168. Initial support is now offered at $148 with additional support at the $142 level.

Procter & Gamble PG
Procter & Gamble is another technically-sound income-producing name that made our shortlist. PG is a 3 for 5’er that has maintained its long-term positive trend since October of 2018 – no an easy feat given the recent and historic market selloff. Further, the stock returned to a market RS buy signal in March of 2020, providing a confirmation of its long-term outperformance against the S&P 500 Equal Weighted Index SPXEWI. Currently, PG ranks in the top half of the favored food beverages/soap sector RS matrix and is on a third consecutive buy signal. Okay to add long exposure here as the weight of the evidence is positive. Note that PG tests support at $112 and finds further support at $108. PG carries a yield 2.72% and displays a low rRisk reading of 0.95.

Average Level
9.44
| AGG | iShares US Core Bond ETF |
| USO | United States Oil Fund |
| DIA | SPDR Dow Jones Industrial Average ETF |
| DVY | iShares Dow Jones Select Dividend Index ETF |
| DX/Y | NYCE U.S.Dollar Index Spot |
| EFA | iShares MSCI EAFE ETF |
| FXE | Invesco CurrencyShares Euro Trust |
| GLD | SPDR Gold Trust |
| GSG | iShares S&P GSCI Commodity-Indexed Trust |
| HYG | iShares iBoxx $ High Yield Corporate Bond ETF |
| ICF | iShares Cohen & Steers Realty ETF |
| IEF | iShares Barclays 7-10 Yr. Tres. Bond ETF |
| LQD | iShares iBoxx $ Investment Grade Corp. Bond ETF |
| IJH | iShares S&P 400 MidCap Index Fund |
| ONEQ | Fidelity Nasdaq Composite Index Track |
| QQQ | Invesco QQQ Trust |
| RSP | Invesco S&P 500 Equal Weight ETF |
| IWM | iShares Russell 2000 Index ETF |
| SHY | iShares Barclays 1-3 Year Tres. Bond ETF |
| IJR | iShares S&P 600 SmallCap Index Fund |
| SPY | SPDR S&P 500 Index ETF Trust |
| TLT | iShares Barclays 20+ Year Treasury Bond ETF |
| GCC | WisdomTree Continuous Commodity Index Fund |
| VOOG | Vanguard S&P 500 Growth ETF |
| VOOV | Vanguard S&P 500 Value ETF |
| EEM | iShares MSCI Emerging Markets ETF |
| XLG | Invesco S&P 500 Top 50 ETF |

| Symbol | Company | Sector | Current Price | Action Price | Target | Stop | Notes |
|---|---|---|---|---|---|---|---|
| PCAR | PACCAR Inc. | Autos and Parts | $66.83 | high 60s - low 70s | 87 | 58 | 3 for 5'er, top 25% of AUTO sector matrix, triple top, one box from mkt RS buy signal, 1.8% yield, R-R>2.0 |
| HLI | Houlihan Lokey Inc | Banks | $62.03 | upper $50s - mid to upper 60s | $68 | $49 | 5 for 5'er, pullback from AT high, consec buy signals, top 25% of DWABANK, pos week mom, 2.09% yield |
| ADBE | Adobe Systems Incorporated | Software | $365.30 | hi 330s - low 360s | 404 | 288 | 4 for 5'er, top third of favored SOFT sector matrix, LT pos mkt RS, multi consec buys, pot. covered write Earnings 6/11 |
| ATSG | Air Transport Services Group Inc. | Aerospace Airline | $19.76 | low 20s | 33.50 | 17.50 | 4 for 5'er, top third of favored AERO sector matrix, spread quad top, pot. covered write, R-R>3.0 |
| CIEN | CIENA Corporation | Telephone | $49.65 | upper 40s to mid 50s | $58 | $37 | 5 for 5'er, pullback from 52 week high, pos trend, top 25% telephone sector matrix, consec buy signals Earnings 6/4 |
| ABBV | AbbVie Inc. | Drugs | $90.71 | 82 - 89 | 100 | 71 | 3 for 5'er, favored DRUG sector, triple top breakout, 5.6% yield |
| KKR | KKR & Co. L.P | Finance | $24.73 | mid-to-upper 20s | 44.50 | 21 | 4 for 5'er, top half of FINA sector matrix, triple top, 2.2% yield, cov. write opp., R-R>4.0 |
| FNV | Franco-Nevada Corp. | Precious Metals | $150.66 | 140s to mid 150s | 171 | 118 | 4 for 5'er, pullback from AT high, consec buy signals, pos mon mom |
| ICE | IntercontinentalExchange Inc. | Wall Street | $93.47 | 90s | 125 | 77 | 5 for 5'er, top 25% of WALL sector matrix, LT pos mkt RS, multi consec buy signals, 1.3% yield |
| DGX | Quest Diagnostics Incorporated | Healthcare | $111.08 | mid $110s to $130s | $132 | $92 | 4 for 5'er, pullback from AT high, consec buy signals, top 25% of favored healthcare sector, 2.02% yield |
| Symbol | Company | Sector | Current Price | Action Price | Target | Stop | Notes |
|---|
| Comment |
|---|
| PETS PetMed Express, Inc. R ($35.65) - Retailing - PETS hit our stop with a move to $31. We will exit on today's bounce. |
| TRNO Terreno Realty Corp R ($47.96) - Real Estate - TRNO hit our stop. We will exit on today's bounce. |
| BLL Ball Corporation R ($64.37) - Business Products - BLL hit our stop. We will close our position. |
| WING Wingstop Inc. R ($122.42) - Restaurants - Raise stop to $112, which would violate multiple levels of support on WING's default chart. |
| MDB MongoDB, Inc. Class A R ($192.81) - Software - Raise stop to $170, which would violate multiple levels of support on MDB's default chart. |
| CMG Chipotle Mexican Grill 'A' R ($999.99) - Restaurants - Raise stop to $880, the first sell signal on the chart. |
| SAIC Science Applications International Corp. R ($85.27) - Business Products - Raise stop to $71, which would violate multiple levels of support on SAIC's default chart. |
DGX Quest Diagnostics Incorporated R ($110.78) - Healthcare - DGX is a technically-sound 4 for 5’er that ranks in the top quartile of the favored healthcare sector RS matrix. This stock returned to a buy signal in April at $80 and has since given four consecutive buy signals with the most recent occurring with today’s intraday action at $114. Last month, DGX moved as high as $124, marking a new all-time high. Okay to initiate new long positions between mid $110s to $130s. We will set our initial stop loss at $92 and will use the stock’s bullish price objective of $132 as our near-term price target. Note DGX offers a yield of 2.02%.
| 19 | 20 | ||||||||||||||||||||||||||||||||||||||||||||||||||||
| 124.00 | X | 124.00 | |||||||||||||||||||||||||||||||||||||||||||||||||||
| 122.00 | X | O | 122.00 | ||||||||||||||||||||||||||||||||||||||||||||||||||
| 120.00 | • | X | O | 120.00 | |||||||||||||||||||||||||||||||||||||||||||||||||
| 118.00 | X | • | X | O | 118.00 | ||||||||||||||||||||||||||||||||||||||||||||||||
| 116.00 | • | X | O | • | X | O | 116.00 | ||||||||||||||||||||||||||||||||||||||||||||||
| 114.00 | 7 | • | • | X | O | • | X | O | x | 114.00 | |||||||||||||||||||||||||||||||||||||||||||
| 112.00 | X | O | 8 | • | X | X | O | • | X | O | X | X | 112.00 | ||||||||||||||||||||||||||||||||||||||||
| 110.00 | X | O | X | O | • | 1 | O | 3 | O | • | X | O | X | O | X | 110.00 | |||||||||||||||||||||||||||||||||||||
| 108.00 | O | X | O | • | X | O | X | O | • | X | 5 | X | O | X | 108.00 | ||||||||||||||||||||||||||||||||||||||
| 106.00 | O | A | • | X | B | 2 | X | O | • | X | O | O | 106.00 | ||||||||||||||||||||||||||||||||||||||||
| 104.00 | O | • | 7 | X | 9 | O | X | O | O | • | X | 104.00 | |||||||||||||||||||||||||||||||||||||||||
| 102.00 | O | • | X | O | X | O | X | O | X | O | X | • | X | 102.00 | |||||||||||||||||||||||||||||||||||||||
| 100.00 | O | • | X | O | X | O | X | A | O | X | O | • | X | 100.00 | |||||||||||||||||||||||||||||||||||||||
| 99.00 | O | • | X | X | O | X | 8 | X | O | X | O | • | X | 99.00 | |||||||||||||||||||||||||||||||||||||||
| 98.00 | O | X | • | X | O | 6 | O | O | X | O | X | O | • | X | Mid | 98.00 | |||||||||||||||||||||||||||||||||||||
| 97.00 | O | X | O | X | • | 5 | O | X | O | O | X | O | • | • | X | 97.00 | |||||||||||||||||||||||||||||||||||||
| 96.00 | O | B | O | X | O | • | X | O | X | O | X | O | X | • | X | 96.00 | |||||||||||||||||||||||||||||||||||||
| 95.00 | O | X | O | X | O | • | X | O | • | O | X | O | X | O | X | 95.00 | |||||||||||||||||||||||||||||||||||||
| 94.00 | O | X | O | X | O | • | X | • | O | X | O | X | O | X | 94.00 | ||||||||||||||||||||||||||||||||||||||
| 93.00 | O | X | O | • | O | • | X | • | O | X | O | X | X | O | 93.00 | ||||||||||||||||||||||||||||||||||||||
| 92.00 | O | X | • | O | • | • | X | • | O | X | O | X | O | X | 92.00 | ||||||||||||||||||||||||||||||||||||||
| 91.00 | O | • | O | X | 4 | • | X | • | O | X | O | X | X | O | X | 91.00 | |||||||||||||||||||||||||||||||||||||
| 90.00 | • | • | O | X | O | X | X | O | X | • | O | X | O | X | O | X | O | X | X | 90.00 | |||||||||||||||||||||||||||||||||
| 89.00 | • | O | C | O | X | X | O | X | X | O | X | • | O | O | X | O | X | O | X | O | X | 89.00 | |||||||||||||||||||||||||||||||
| 88.00 | • | O | X | O | X | O | 2 | O | X | O | X | O | X | • | O | X | O | X | O | X | O | X | 88.00 | ||||||||||||||||||||||||||||||
| 87.00 | O | X | O | X | O | X | O | X | O | X | O | X | • | O | X | O | X | O | X | O | 87.00 | ||||||||||||||||||||||||||||||||
| 86.00 | O | O | O | X | O | X | O | X | O | X | • | O | X | O | X | O | 86.00 | ||||||||||||||||||||||||||||||||||||
| 85.00 | O | X | O | 3 | X | O | • | O | X | O | X | 85.00 | |||||||||||||||||||||||||||||||||||||||||
| 84.00 | O | X | O | X | • | O | X | O | X | • | 84.00 | ||||||||||||||||||||||||||||||||||||||||||
| 83.00 | O | X | X | O | • | O | X | O | X | • | 83.00 | ||||||||||||||||||||||||||||||||||||||||||
| 82.00 | O | X | O | X | • | • | O | X | O | X | • | 82.00 | |||||||||||||||||||||||||||||||||||||||||
| 81.00 | O | X | O | X | • | O | X | X | O | X | • | 81.00 | |||||||||||||||||||||||||||||||||||||||||
| 80.00 | O | X | 1 | • | O | X | O | X | O | X | • | 80.00 | |||||||||||||||||||||||||||||||||||||||||
| 79.00 | O | • | • | O | X | O | X | 4 | X | X | • | 79.00 | |||||||||||||||||||||||||||||||||||||||||
| 78.00 | • | O | X | O | X | O | X | O | X | • | 78.00 | ||||||||||||||||||||||||||||||||||||||||||
| 77.00 | O | X | O | X | O | X | O | X | • | 77.00 | |||||||||||||||||||||||||||||||||||||||||||
| 76.00 | O | X | O | X | O | X | O | X | • | 76.00 | |||||||||||||||||||||||||||||||||||||||||||
| 75.00 | O | X | O | X | O | O | X | • | 75.00 | ||||||||||||||||||||||||||||||||||||||||||||
| 74.00 | O | O | O | • | 74.00 | ||||||||||||||||||||||||||||||||||||||||||||||||
| 19 | 20 |
| ACN Accenture PLC ($193.17) - Business Products - Accenture shares returned to a buy signal with a shakeout pattern completion at $190 before advancing further past resistance to $192. This strong 5 for 5'er returned to a positive trend in early April and has maintained a market RS buy signal since 2002, confirming long-term strength. Additionally, ACN ranks in the top third of the favored business products sector RS matrix. The weight of the evidence is positive and long exposure may be added here with initial support offered at $176. |
| APD Air Products & Chemicals, Inc. ($240.54) - Chemicals - Air Products & Chemicals shares reversed up today to break a double top at $236, marking a third consecutive buy signal before advancing further past resistance to $240. This strong 5 for 5'er returned to a positive trend in early April and has maintained a market RS buy signal since May of 2019, confirming long-term strength. Additionally, APD ranks 8th of 43 names included in the favored chemicals sector RS matrix. Demand is in control and long exposure may be added here on an individual basis or via the DWA Chemicals Sector Portfolio, of which APD is a holding. Note that support is offered at $220 and $208. APD carries a yield of 2.23%. |
| CGNX Cognex Corp ($59.85) - Computers - CGNX gave a third consecutive buy signal on Monday with a triple top break at $59 and later continued higher to move past further resistance, resulting in a new multi-year high at $60. The 4 for 5’er ranks in the top quartile of the favored computers stock sector matrix and recently returned to an RS buy signal versus the market on March 17th and positive trend on April 9th. Demand is in control. Those looking to initiate new long exposure may consider CGNX at current levels or on a pullback as the stock is approaching overbought levels here. Note that support is offered at $54. |
| CHE Chemed, Inc. ($462.13) - Household Goods - Shares of CHE continued higher on Monday to give a third consecutive buy signal, completing a bullish triangle pattern with a break at $464 and later moving higher to match further resistance at $472. The 4 for 5’er resides in the favored household goods sector and demonstrates positive long-term relative strength versus the market, remaining on an RS buy signal since March of 2015. Additionally, CHE recently returned to a positive trend on April 7th and is actionable from an Overbought/Oversold (OBOS) perspective. The weight of the evidence is positive and those looking to initiate new long exposure may consider CHE at current levels. Past $472 the next level of resistance resides at $512, its all-time high, while initial support is offered at $416. |
| ECL Ecolab Inc. ($203.97) - Chemicals - Shares of ECL continued higher on Monday to break a triple top at $200, resulting in a second consecutive buy signal. The 5 for 5’er ranks seventh out of 43 names in the favored chemicals stock sector matrix and demonstrates positive long-term relative strength versus the market, remaining on an RS buy signal since October of 2013. In addition, ECL reentered a positive trend on April 9th and remains actionable from an Overbought/Oversold (OBOS) perspective. Demand is in control. From here, support is offered at $188. |
| LGIH LGI Homes, Inc ($78.03) - Building - LGI Homes completed a double top at $74 today, marking a fourth consecutive buy signal before advancing further to $78. Today's ascent also signifies a positive trend reversal for the stock, promoting it to a 5 for 5'er following a recent move back to a market RS buy signal. Additioanlly, LGIH ranks 5th of 66 names included in the favored building sector RS matrix. Demand is in control and long exposure may be added here, noting that initial support is offered at $64. |
| LOW Lowe's Companies, Inc. ($116.73) - Building - Lowe's shares broke a double top at $116 during today's action, marking a second consecutive buy signal before advancing to $118. This 5 for 5'er returned to a positive trend in April and has maintained a market RS buy signal since November of 2012. Additionally, LOW ranks in the top quartile of the favored building sector RS matrix. Demand is in control here and long exposure can be added. Note that support is offered at $108 and LOW carries a yield of 1.89%. Earnings are expected on 5/20. |
| MA Mastercard Incorporated Class A ($289.90) - Finance - Mastercard shares broke a double top at $284 today, marking a second consecutive buy signal before advancing past further resistance to $292. This 5 for 5'er returned to a positive trend in late April and has maintained a market RS buy signal since August of 2011, confirming long-term strength against the broader market. Additionally, MA ranks in the top half of the favored finance sector RS matrix and is a holding in the DWA Finance Sector Portfolio. Demand is in control and long exposure may be added here. Note that support is offered at $264. |
| NDSN Nordson Corporation ($173.01) - Machinery and Tools - Nordson shares broke a double top at $170 today, returning to a buy signal before advancing further to $174. This strong 5 for 5'er returned to a positive trend in April and has maintained a market RS buy signal since November of 2016. Additionally, NDSN ranks 3rd of 63 names included in the machinery and tools sector RS matrix and is a holding in the DWA Machinery & Tools Sector Portfolio. The weight of the evidence is positive and long exposure may be added here. Note that support is offered at $154 and that resistance is found at the all-time high of $180. Earnings are expected on 5/20. |
| PYPL Paypal Holdings Inc ($146.24) - Business Products - PYPL moved higher Monday to reverse up into a column of Xs and break a double top at $148, marking a fourth consecutive buy signal and a new all-time high. This 4 for 5'er moved back to a positive trend at the beginning of April and ranks 3rd out of 98 names in the favored business products sector RS matrix. The overall weight of the evidence continues to be positive, however, PYPL is now heavily overbought at current levels so those looking to add exposure would be best served to wait for a pullback or normalization of the trading band. Initial support can be found at $140 with further support at $116 and $108. |

| Name | Option Symbol | Action | Stop Loss |
|---|---|---|---|
| Franco-Nevada Corp. - $147.24 | O: 20J145.00D16 | Buy the October 145.00 calls at 16.60 | 136.00 |
| Name | Option | Action |
|---|---|---|
| Agilent Technologies, Inc ( A) | Aug. 77.50 Calls | Initiate an option stop loss of 7.80 (CP: 9.80) |
| The Walt Disney Company ( DIS) | Sep. 105.00 Calls | Initiate an option stop loss of 15.20 (CP: 17.20) |
| DocuSign, Inc. ( DOCU) | Sep. 100.00 Calls | Stopped at 29.60 (CP: 28.60) |
| AbbVie Inc. ( ABBV) | Sep. 80.00 Calls | Initiate an option stop loss of 11.40 (CP: 13.40) |
| Best Buy Co., Inc. ( BBY) | Sep. 75.00 Calls | Initiate an option stop loss of 14.80 (CP: 16.80) |
| Name | Option Symbol | Action | Stop Loss |
|---|---|---|---|
| Western Union Company - $19.40 | O: 20T20.00D21 | Buy the August 20.00 puts at 2.05 | 21.00 |
| Name | Option | Action |
|---|---|---|
| Walgreens Boots Alliance Inc. (WBA) | Jul. 47.50 Puts | Stopped at 7.05 (CP: 6.55) |
| Walgreens Boots Alliance Inc. (WBA) | Oct. 45.00 Puts | Stopped at 6.05 (CP: 6.00) |
| Loews Corporation (L) | Sep. 40.00 Puts | Stopped at 9.40 (CP: 8.70) |
| FedEx Corporation (FDX) | Oct. 125.00 Puts | Stopped at 21.40 (CP: 15.80) |
| Helmerich & Payne, Inc. (HP) | Sep. 20.00 Puts | Stopped at 19.00 (CP: 19.25) |
| Name | Option Sym. | Call to Sell | Call Price | Investment for 500 Shares | Annual Called Rtn. | Annual Static Rtn. | Downside Protection |
|---|---|---|---|---|---|---|---|
| Rent-A-Center, Inc. $24.01 | O: 20I25.00D18 | Sep. 25.00 | 2.65 | $11,242.55 | 29.91% | 31.34% | 9.55% |
| Name | Action |
|---|---|
| Copart Incorporated (CPRT) - 79.54 | Sell the August 85.00 Calls. |
| Micron Technology, Inc. (MU) - 44.41 | Sell the October 50.00 Calls. |
| Apollo Global Management Inc. (APO) - 40.69 | Sell the September 45.00 Calls. |
| Chevron Corporation (CVX) - 89.16 | Sell the September 95.00 Calls. |
| Electronic Arts Inc. (EA) - 118.13 | Sell the September 120.00 Calls. |
| Newmont Corp (NEM) - 67.90 | Sell the September 70.00 Calls. |
| Name | Covered Write |
|---|---|
| Best Buy Co., Inc. ( BBY - 78.61 ) | September 77.50 covered write. |
| Intel Corporation ( INTC - 58.28 ) | August 60.00 covered write. |
Daily Equity & Market Analysis
Loading, Please Wait...
