
Today we explore two separate ways to find technically-sound dividend-paying stocks on the NDW Research Platform: the DWA Yield Portfolio and a custom stock screen with timely and actionable results.
If you are an income investor, chances are that your income needs persist or may even increase during periods of market volatility and economic uncertainty. With bond yields near historic lows, as evidenced by the US Treasury 10YR Yield Index trading at 0.675%, and cash-like vehicles such as the Vanguard Prime Money Market Fund yielding a mere 2.12%, many simply cannot afford to park money in conservative asset classes. This creates a dilemma in the current environment as both cash and fixed income rank first and second, respectively, in the broad asset class relative strength rankings in DALI. However, even prior to the recent bout of market volatility, investors have had to venture into riskier asset classes such as domestic equities in order to maintain a required level of income as the long-term trend for rates has been negative. While the idea of taking on more risk in order to maintain your goals and lifestyle was an afterthought with domestic equities ranked atop of the broader asset class rankings in DALI, as it had been for the better part of the last decade, today’s third-place ranking requires an extra level of diligence for dividend stock pickers. Further, the current dominance of growth-style equities within the broader asset class necessitates additional consideration with an emphasis on only the soundest individual technical names from within blend or value-style categories. Today, we're going to highlight two ways to find high-RS dividend-paying stocks on the NDW Research Platform.
The first way to find high-RS dividend-paying stocks is by using the DWA Yield Portfolio . The model employs a systematized approach toward picking dividend-focused and high-RS individual names, holding up to 5 stocks at once. The model draws from strong attribute and high-yielding members within the S&P 500 Index , using a daily-evaluated RS Matrix to determine the top names from the overall universe. Currently, the model has 100% exposure to energy stocks for the first time ever since the model’s inception in October of 2009 and maintains a weighted average yield of 5.85%. Additionally, the model has outperformed SPX by over 900 basis points on a year-to-date basis.

The second way is by using specifically-curated criteria to find strong and actionable names. With the overall market backdrop in mind, we used the Stock Screener tool (found under Security Selection > Security Screener) to identify those S&P 500 stocks that have decent volume, have attributes of 3 or higher, maintain a buy signal, and a positive trend on their chart, and are within buyable ranges on their weekly distribution curves. Additionally, we sought out those stocks that are yielding 2% or higher, as our goal with this screen was to find stocks that are yielding higher than the S&P 500 Trust ETF . The search criteria listed below resulted in 19 stocks.
Search Criteria:
- Universe: S&P 500
- Last Price: > $20
- Optionable
- Average 30-Day Volume: 500,000 Shares
- Technical Attribute: 3, 4 and 5
- P&F Signal: Buy
- P&F Trend: Positive
- Overbought/Oversold (%): -25% to 25%
- Yield: > 2%
Technically-Sound Dividend-Paying Stocks
| Symbol |
Name |
Price |
Tech Attrib/Score |
Broad Sector |
Yield |
Overbought/Oversold |
|
Analog Devices, Inc. |
101.80 |
3  |
Technology |
2.44 |
|
|
Arthur J. Gallagher & Co. |
87.23 |
4 |
Financial |
2.06 |
|
|
Broadcom Ltd |
260.41 |
3 |
Technology |
4.99 |
|
|
Comcast Corporation |
35.92 |
4  |
Consumer Cyclical |
2.56 |
|
|
Duke Realty Corporation |
30.83 |
5 |
Real Estate |
3.05 |
|
|
The Hershey Company |
130.38 |
3 |
Consumer Noncyclical |
2.37 |
|
|
Intel Corporation |
58.28 |
4 |
Technology |
2.27 |
|
|
KLA Corp |
167.43 |
5 |
Technology |
2.03 |
|
|
Kimberly-Clark Corporation |
138.64 |
3 |
Consumer Noncyclical |
3.09 |
|
|
Alliant Energy Corporation |
45.95 |
5 |
Utilities |
3.31 |
|
|
Mondelez International Inc. |
49.96 |
4 |
Consumer Noncyclical |
2.28 |
|
|
Maxim Integrated Products Inc |
52.06 |
3 |
Technology |
3.69 |
|
|
NortonLifeLock Inc. |
20.03 |
3 |
Technology |
2.50 |
|
|
NRG Energy, Inc. |
32.60 |
5 |
Utilities |
3.68 |
|
|
PepsiCo, Inc. |
135.95 |
4 |
Consumer Noncyclical |
3.01 |
|
|
The Procter & Gamble Company |
114.61 |
3 |
Consumer Noncyclical |
2.76 |
|
|
Republic Services, Inc. |
79.47 |
4 |
Industrial |
2.04 |
|
|
Union Pacific Corporation |
151.24 |
5 |
Industrial |
2.56 |
|
|
Verizon Communications Inc. |
54.71 |
3 |
Communications |
4.50 |
|
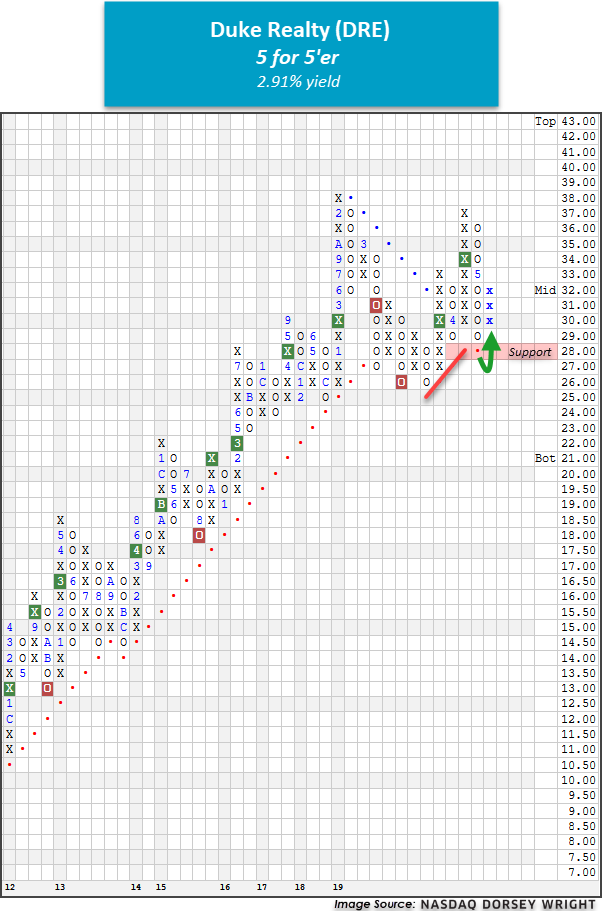
Duke Realty Corporation
One strong dividend-payer is Duke Realty Corporation . This 5 for 5’er returned to a positive trend in late March and ranks in the top third of the favored real estate sector RS matrix. Additionally, DRE has maintained a market RS buy signal since May of 2016, confirming long-term strength against the broader market. Currently, the stock trades on a second consecutive buy signal and has just reversed up into Xs following a test of its bullish support line. Demand is in control and long exposure may be added here with initial support offered at $29. DRE carries a dividend yield of 2.91% and displays a low relative risk (rRisk) reading of 0.94, which is notable considering the diversified S&P 500 Index benchmark reading is 1.00.
PepsiCo, Inc.
PEP is a solid 4 for 5’er that moved back into a positive trend in early April. This large-cap stock ranks in the top half of the favored food beverages/soap sector and maintains a long-term market RS buy signal. PEP has given two consecutive buy signals since March, confirming that demand is in control. At current levels, PEP sits just two boxes away from completing a third consecutive buy signal at $140. With a solid technical picture, a weekly distribution reading of just 22% overbought, and a yield of 3.02%, new positions are welcome here. Note that the stock’s all-time high from February of this year sits at $146 while initial support is offered at $130. Year-to-date, PEP is outpacing the S&P 500 by 10.83% (through 5/15).

Union Pacific Corporation
UNP is a perfect 5 for 5’er within the transports/non air sector that has maintained a market RS buy signal since July 2002, confirming the stock’s superior strength versus the broader market. In addition, UNP has maintained a long-term peer RS buy signal since October 2008 and offers a yield of 2.43%. In late-April, UNP returned to an overall positive trend when it broke a spread triple top at $152 before rallying to $166. UNP experienced a brief pullback to $148, however, with today’s market action, the chart has returned to a column of Xs at $160. From current levels, UNP sits just four boxes away from marking a second consecutive buy signal at $168. Initial support is now offered at $148 with additional support at the $142 level.

Procter & Gamble
Procter & Gamble is another technically-sound income-producing name that made our shortlist. PG is a 3 for 5’er that has maintained its long-term positive trend since October of 2018 – no an easy feat given the recent and historic market selloff. Further, the stock returned to a market RS buy signal in March of 2020, providing a confirmation of its long-term outperformance against the S&P 500 Equal Weighted Index . Currently, PG ranks in the top half of the favored food beverages/soap sector RS matrix and is on a third consecutive buy signal. Okay to add long exposure here as the weight of the evidence is positive. Note that PG tests support at $112 and finds further support at $108. PG carries a yield 2.72% and displays a low rRisk reading of 0.95.

