
Most Requested Symbols

Breaking down the strong performance the month of December has historically brought to broad domestic equity indexes.
With the chart of the iShares MSCI Emerging Markets ETF (EEM) continuing to show improvement, we highlight how to use the new Custom Models tool to separate the China allocation within your emerging markets portfolio by combining the KraneShares Dynamic China Rotation Model (KRANEDYNAMIC.TR) and the KraneShares MSCI Emerging Markets ex-China Index ETF (KEMX.TR).
Today's featured stock is LendingClub (LC).
AEO, CP, EVR, INTU, MIDD, MNST, OKE, SBNY, TEAM & WELL.
Calls: Arthur J. Gallagher & Co. (AJG); Put: Merit Medical Systems Inc (MMSI); Covered Write: Applied Materials Inc (AMAT).

Upcoming NDW Best Practices Workshop - Thursday, March 19th from 8:30 am - 2 pm @ State Street's Headquarters in Boston - The Best Practices Workshop is designed specifically for financial professionals looking to incorporate the Point & Figure and Relative Strength methodologies into their investment practice. This half-day course will not only give you the chance to engage with experts from Nasdaq Dorsey Wright (NDW) on topics related to technical analysis and Relative Strength investing, but will also expose you to new ideas, frameworks, and tools using the NDW Research Platform that are designed to help you manage your business more effectively. The Workshop is also a great way to network with other practioners using the research methodology. Investments & Wealth Institute® has accepted the Nasdaq Dorsey Wright Research Platform Best Practices Workshop for 3 hours of CE credit towards the CIMA , CPWA CIMC , and RMA certifications.
Attendees will learn:
Sign up before February 15th to receive our early-bird price of $199!
Please email dwa@dorseywright.com or call 804-320-8511 with any questions regarding this event.

Each week the analysts at DWA review and comment on all major asset classes in the global markets. Shown below is the summary or snapshot of the primary technical indicators we follow for multiple areas. Should there be changes mid-week we will certainly bring these to your attention via the report.
| Universe | BP Col & Level (actual) | BP Rev Level | PT Col & Level (actual) | PT Rev Level | HiLo Col & Level (actual) | HiLo Rev Level | 10 Week Col & Level (actual) | 10 Week Rev Level | 30 Week Col & Level (actual) | 30 Week Rev Level |
|---|---|---|---|---|---|---|---|---|---|---|
| ALL |
|
44% |
|
38% |
|
62% |
|
54% |
|
48% |
| NYSE |
|
50% |
|
46% |
|
70% |
|
56% |
|
54% |
| OTC |
|
40% |
|
36% |
|
60% |
|
54% |
|
46% |
| World |
|
40% |
|
36% |
|
|
|
54% |
|
40% |
With the first week of December behind us, we are now in the final stretch of 2019 with just thirteen trading days left in the year. Those of you who have been regular readers of this Report know that there are several market tendencies or historical biases that we highlight throughout the year. In many cases these are observations that have been documented over time within one of our favorite trading resources, the Stock Trader's Almanac; and include items such as market seasonality, the "January Barometer," and performance patterns surrounding presidential elections. Additionally, they have compiled ample data to support the sentiment that September and October are among the worst-performing months of the year, while the month of December offers some of the best return numbers. In fact, December has historically been the single best performing month for the Russell 2000 RUT (based on data back to 1979 through April 2019). Furthermore, it is the second-best performing month for major market indices such as the S&P 500 Index SPX, the Nasdaq Composite Index NASD (using data from 1971 - April 2019), and the Russell 1000 RUI (using data from 1979 - April 2019).
Beyond the strong average performance, there are a few other notable return patterns that have historically held true during the month of December. For instance, it is often believed that much of the returns for the month come in the latter half of the month. The Stock Trader's Almanac mentions strong end of month performance as part of its "Santa Claus Rally" study, stating, "Santa Claus tends to come to Wall Street nearly every year, bringing a short, sweet, and respectable rally within the last five days of the year and the first two in January." We will discuss the Santa Claus Rally in more detail later in the month, but today we wanted to address the historical performance dispersion between the first and second half of December. We have gathered return data for the SPX and the DJIA for three different segments: the first half of the month, the second half of the month, and the month as a whole. The results are in the table below, and confirm that the entirety of the average net gains for both the SPX and DJIA come in the second half of the month. Taking this one step further, the underlying data shows that the SPX has a positive return in the first half of the month about 59% of the time, versus a 75% success ratio of positive returns in the second half of the month. The DJIA results are similar with only 57% of the years tested yielding gains in the first half of December, while the second half of the month saw gains approximately 70% of the time on average. The results are even more notable if we focus on only small-cap equities, as the S&P 600 Small Cap Index SML has only demonstrated positive returns over the first half of December in 37% of years, while the second half of the month has led to gains 83% of the time.

*This example is presented for illustrative purposes only and does not represent a past recommendation. The performance above is based on pure price returns, not inclusive of dividends or all transaction costs. Investors cannot invest directly in an index. Indexes have no fees. Past performance is not indicative of future results. Potential for profits is accompanied by the possibility of loss.
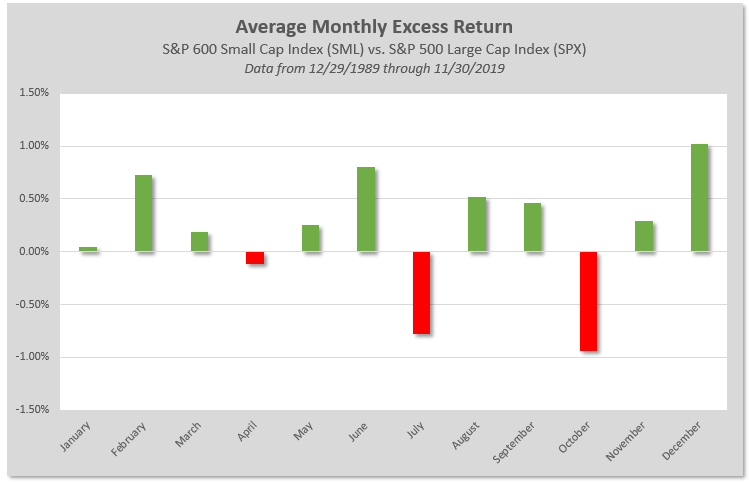
This leads to another December theme that has presented itself more often than not over the years; the outperformance of Small Cap stocks relative to Large Cap names. The Stock Trader's Almanac theorizes that this is attributed to the "January Effect" that over the years has moved earlier and earlier within the calendar year. The overall concept is that many beaten-down small stocks being dumped for tax-loss purposes begin to rebound in December and this effect continues to spill over into January as investors are willing to accept more risk in the portfolio. The chart below looks at the average excess return of the S&P 600 Small-Cap Index SML over the SPX for each month of the year. Notice that December has, in fact, on average, provided the greatest margin of outperformance by Small Caps going back over the last 30 years.
When we think about these December biases in context with the current market, December 2019 very well could be setting itself up nicely to follow in the footsteps of the Decembers before it. With respect to the Small Cap story, we have seen notable improvement both on an absolute and relative basis across that segment of the market. As we highlighted in the Daily Equity Report on Monday, small-cap groups have risen to the top of the score direction rank of US styles on the Asset Class Group Scores page, and we saw the Bullish Percent for All Small Caps ^BPSCAP continue higher in recent weeks, indicating further participation within the space. We will continue to monitor the markets for any material changes between supply and demand, but a strong finish to the year with the near-term improvement of small-caps is something our indicators currently support.

| Symbol | Name | Price | Yield | PnF Trend | RS Signal | RS Col. | Fund Score | 200 Day MA | Weekly Mom |
|---|---|---|---|---|---|---|---|---|---|
| DIA | SPDR Dow Jones Industrial Average ETF Trust | 279.46 | 2.04 | Positive | X | 3.92 | 265.53 | -1W | |
| EEM | iShares MSCI Emerging Markets ETF | 43.05 | 2.08 | Positive | Sell | O | 2.92 | 42.12 | -3W |
| EFA | iShares MSCI EAFE ETF | 68.36 | 2.95 | Positive | Sell | O | 3.26 | 65.43 | -3W |
| FRN | Invesco Frontier Markets ETF | 14.49 | 1.64 | Positive | Sell | O | 3.81 | 13.99 | +11W |
| IJH | iShares S&P MidCap 400 Index Fund | 201.43 | 1.44 | Positive | Buy | X | 4.09 | 192.68 | -1W |
| IJR | iShares S&P SmallCap 600 Index Fund | 82.37 | 1.36 | Positive | Buy | X | 4.00 | 78.09 | -1W |
| QQQ | Invesco QQQ Trust | 203.90 | 0.76 | Positive | Buy | X | 5.76 | 188.28 | -1W |
| RSP | Invesco S&P 500 Equal Weight ETF | 112.84 | 1.79 | Positive | Buy | X | 4.95 | 107.11 | -1W |
| SPY | SPDR S&P 500 ETF Trust | 313.53 | 1.75 | Positive | O | 3.51 | 293.58 | -1W | |
| XLG | Invesco S&P 500 Top 50 ETF | 226.70 | 1.68 | Positive | O | 4.58 | 211.10 | -1W |
It was a positive week in terms of performance over the course of the last week (12/3-12/10), with all 10 of the major market ETFs posting gains in excess of 1%. The biggest upside mover was the iShares S&P SmallCap 600 Index Fund IJR, up 2.23% on the week. With no other significant changes or developments to discuss within the major market realm, this week we wanted to expand on IJR’s positive price action as it strengthens the overall technical case for the small-cap segment of the market. Although small caps continue to lag the large- and mid-cap spaces for the year, we find that this area of the market is still up about 18.83% (through 12/10). A significant portion of that return has come just within the last three months and the technical picture still points to higher price potential from here. On the fund’s default chart, IJR most recently completed a spread quintuple top at $82 in early November. Notice on the more sensitive 0.5-point per box chart, IJR has successfully completed a series of higher tops and sits just one box away from completing a fifth consecutive buy signal, which would come with a move to $83. In addition to the fund’s positive price action, monthly momentum has been positive for three months which suggests the potential for higher prices. At this time, IJR has a positive direction of 1.54 and is scoring right at the buyable 4.00-level. Near term, support is available in the mid $70s while the long-term bullish support line sits at $70. For additional insight into the small-cap space, be sure to read Monday’s feature titled, “Small-Cap Unwrapped.”

SECTOR BULLISH PERCENT CHANGES
| Reversed to X | Reversed to O |
|---|---|
| 1 (BPWAST | 54), |
0 |
| To Xs | To Os |
|---|
Average Level
51.16
| Sector |
|---|
| Oil (22%) - Bull Correction |
| Oil Service (20%) - Bear Confirmed |
| Sector |
|---|
| Biomedics/Genetics (42%) - Bull Confirmed |
| Computers (50%) - Bull Confirmed |
| Drugs (44%) - Bull Confirmed |
| Finance (46%) - Bear Correction |
| Healthcare (50%) - Bull Confirmed |
| Internet (44%) - Bull Confirmed |
| Leisure (48%) - Bull Confirmed |
| Media (44%) - Bull Confirmed |
| Metals Non Ferrous (40%) - Bull Confirmed |
| Precious Metals (42%) - Bull Confirmed |
| Restaurants (44%) - Bear Correction |
| Telephone (38%) - Bull Alert |
| Sector |
|---|
| Utilities / Electric (66%) - Bear Alert |
| Semiconductors (60%) - Bear Alert |
| Transports / Non Air (52%) - Bull Correction |
SECTOR INDICATOR CHART CHANGES
PT is the percentage of stocks within a sector that are trading above their bullish support lines. RSX is the percentage of stocks within a sector whose relative strength charts are in a column of Xs. RSP is the percentage of stocks within a sector whose relative strength charts are on a buy signal. The strongest sectors, i.e. market leaders, will have most of these indicators positive and moving higher in a column of Xs.
|
There were only rising sector PT charts this week, with 5 rising and none moving lower. The following sector charts rose: Biomedics/Genetics [^PTBIOM], Forest Prods/Paper [^PTFORE], Healthcare [^PTHEAL], Leisure [^PTLEIS]-Rev. , Transports/Non Air [^PTTRAN]. There were 1 that reversed to X. |
|
| ^PT Charts Reversing Up - | ^PT Charts Reversing Down - |
|
|
| ^PT Charts Moving Higher - | ^PT Charts Moving Lower - |
|
|
|
|
There were mostly RSX charts rising this week, with 7 rising and 3 moving lower. The following sector charts rose: Aerospace Airline [^RSXAERO], Biomedics/Genetics [^RSXBIOM], Drugs [^RSXDRUG], Oil Service [^RSXOILS], Precious Metals [^RSXPREC], Protection Safety Equipment [^RSXPROT]-Rev. , Steel/Iron [^RSXSTEE]. The following sector charts fell: Gas Utilities [^RSXGUTI], Household Goods [^RSXHOUS], Metals Non Ferrous [^RSXMETA]-Rev. . There were no sector RSX charts that moved to a buy or sell signal this week. |
|
| ^RSX Charts Reversing Up - | ^RSX Charts Reversing Down - |
|
|
| ^RSX Charts Moving Higher - | ^RSX Charts Moving Lower - |
|
There were mostly RSP charts rising this week, with 2 rising and 1 moving lower. The following sector charts rose: Biomedics/Genetics [^RSPBIOM], Retailing [^RSPRETA]-Rev. . The following sector chart fell: Wall Street [^RSPWALL]-Rev. . There were 1 that reversed to X and 1 that reversed to O. |
|
| ^RSP Charts Reversing Up - | ^RSP Charts Reversing Down - |
|
|
| ^RSP Charts Moving Higher - | ^RSP Charts Moving Lower - |
|
|
FAVORED SECTOR STATUS CHANGES
A sector is considered to be Favored if it has 3 or 4 of the sector indicators (Relative Strength, RSX, RSP, & PT) positive, Average if it has 2 of the 4 indicators positive, & Unfavored if it has 0 or 1 of the indicators positive. The table below contains those sectors that have experienced a Favored Sector Status change over the past week. It is best to focus on sectors that are about 50% or lower on their Bullish Percent charts & are in Xs. Note: If a sector moves from Favored to Average, it doesn't necessarily mean that the sector in question has to be sold - it just means you need to evaluate your individual positions with exposure to that sector.
| Changes since 12/04/2019 | Full Report |
|
|
|
|
|||||
|
|
|
|
|
|
|||
|
|
|
|
|
|
|||
|
|
|
|
|
|
|||

The emerging markets space has certainly had its ups and downs throughout 2019, as can be seen through the point and figure chart of the iShares MSCI Emerging Markets ETF EEM. This fund showed significant gains during the first several months of the year, giving three consecutive buy signals before experiencing increased volatility over the summer that ultimately led to two consecutive sell signals by the end of August. However, the past few months have seen more positive movement, as EEM rose to give a buy signal in October that also moved the fund back to a positive trend, and most recently reversed back up into a column of X's in trading Wednesday to set up its first series of higher bottoms since April.

While the technical picture for EEM has improved, the fund is still hovering right around the sought-after 3 score-line (2.92 fund score as of 12/10), and the emerging markets representative continues to trail its developed counterpart, the iShares MSCI EAFE ETF EFA, on a year-to-date performance basis, with a 10.21% gain relative to a 16.29% gain, respectively. Given the volatile nature of emerging markets already, many of you may be seeking a way to improve the returns of your exposure to this area while simultaneously reducing the overall fluctuation in your portfolio. Fortunately, you now have the ability to test your own combinations of international securities or models using the new Custom Modeler tool on the Nasdaq Dorsey Wright research platform. For those that have not seen the tool yet, please reference the replay of our webinar-style walkthrough, which was available in yesterday’s Daily Equity & Market Analysis report.
For our example today, we will take a look at separating the China allocation within your emerging markets portfolio by combining the KraneShares Dynamic China Rotation Model KRANEDYNAMIC.TR and the KraneShares MSCI Emerging Markets ex-China Index ETF KEMX.TR. In order to get a guideline for our static allocation to each area, we will use the MSCI Emerging Markets Index target allocation as demonstrated through the largest emerging markets fund, the iShares MSCI Emerging Markets ETF EEM. As we have referenced in prior NDW research articles, the 4th quarter of 2019 marked the start third and final integration of China A Shares into MSCI emerging market indices, which will lead to a target allocation of over 40% exposure to China once these are fully implemented. So for today’s model, we will assign a 40% static allocation to KRANEDYNAMIC.TR, and a 60% allocation to KEMX.TR. We will also allow a 5% allocation drift, and rebalance semi-annually. Our benchmark will be the total return ticker for the iShares MSCI Emerging Markets ETF EEM.TR.

Once the required information is inputted, you can view the model preview by clicking on the “Preview” button in the upper right-hand corner of the page. This brings you to a Model information page that includes return and risk comparison metrics relative to the selected benchmark. Here we see that our combined portfolio offers better risk-adjusted returns, through the Sharpe Ratio of 0.56 compared to 0.32, as well as a more bearable max 6-month drawdown and lower relative-risk (rRisk) numbers. This demonstrates some of the benefits of applying a tactical approach to your China allocation, which could further serve as a proven value add to your clients and separate yourself from the continuously-tightening pack of financial advising.

Saving this model will allow you to come in and view the portfolio as you would any other model on our platform, including the current holding information as well as any of the other new risk metrics associated with the portfolio. One important point to note, however, is that this new custom model will not alert you to changes within the KraneShares Dynamic China Rotation Model; that would only be available by setting alerts on the underlying portfolio itself. If you have any further questions on the new custom models tool and how it can be utilized, please reach out to us at dwa@dorseywright.com or by phone at (804) 320-8511.
In a move that was widely expected, the Fed announced Wednesday afternoon that it would leave the federal funds rate unchanged. The five-year FVX and 10-year TNX US Treasury Yield Indexes remained unchanged on their default charts, while the US Treasury 30-year Yield Index TYX reversed into Os at 2.225%.
As we mentioned last week, there are currently only two fixed income groups that have positive score directions – the inverse fixed income group and the convertible bonds group. With that in mind, today we wanted to take a look at convertible bonds, which, because they make up a very small portion of the fixed income market are often overlooked. However, the unique features of convertibles can make them an attractive inclusion in your fixed income allocation.

Convertible bonds are hybrid securities with features of both debt and equity. Convertible bonds have an embedded option which the bondholder the right, but not the obligation, to exchange the bond for a pre-determined number of shares of the issuer’s common stock. A convertible bond investor can profit from exercising the conversion option if the market price of the issuer’s stock is higher than the conversion price. The conversion price is the price at which the bond can be converted to common stock (e.g. a $1,000 par value bond redeemable for 50 shares of stock would have a conversion price of $20). In a situation where the underlying equity value of a convertible bond is higher than its conversion price the bond will generally trade much like equity, i.e., the price of the convertible bond rises and falls with the stock price.

Due to the hybrid nature of convertible bonds, they have both advantages and disadvantages for fixed income investors. First, because of their equity-like characteristics, convertible bonds are typically less affected by interest rate fluctuations than other segments of the fixed income market like Treasuries and investment grade corporate bonds. Which means they can provide diversification within a fixed income allocation. However, this is a double-edged sword, because convertible bonds also show a higher correlation to equity markets than other types of bonds, which means they may provide less diversification from an overall portfolio perspective, and just as equities are generally more volatile than bonds, convertible bonds are typically more volatile than other areas of the fixed income market.
While convertible bonds have higher volatility and generally higher possible returns than non-convertibles, the value of the straight (option-free) bond acts as a floor to the value of the convertible bond, thereby making it less risky than a straight equity investment. However, because the option to convert is an option to the bondholder, a convertible will have a lower yield than an otherwise equivalent straight bond. Several methods for valuing convertibles exist. The most common and straightforward is the value of a straight bond plus the value of a call option on the issuer’s equity.
If you are interested in adding convertible bonds to your fixed income portfolio, you may wish to consider the following ETFs: SPDR Bloomberg Barclays Convertible Bond ETF CWB, iShares Convertible Bond ETF ICVT, and the First Trust SSI Strategic Convertible Securities ETF FCVT.
Remember, these are technical comments only. Just as you must be aware of fundamental data for the stocks we recommend based on technical criteria in the report, so too must you be aware of important data regarding delivery, market moving government releases, and other factors that may influence commodity pricing. We try to limit our technical comments to the most actively traded contracts in advance of delivery, but some contracts trade actively right up to delivery while others taper off well in advance. Be sure you check your dates before trading these contracts. For questions regarding this section or additional coverage of commodities email james.west@dorseywright.com.
Data represented in the table below is through 12/10/2019:
Broad Market Commodities Report
| Symbol | Name | Price | PnF Trend | RS Signal | RS Col. | 200 Day MA | Weekly Mom |
|---|---|---|---|---|---|---|---|
| CL/ | Crude Oil Continuous | 59.31 | Negative | Buy | O | 57.56 | +7W |
| DBLCIX | Deutsche Bank Liquid Commodities Index | 323.73 | Negative | Sell | O | 321.82 | -3W |
| DWACOMMOD | DWA Continuous Commodity Index | 489.58 | Positive | Sell | X | 466.45 | -3W |
| GC/ | Gold Continuous | 1469.00 | Positive | Buy | X | 1408.68 | -14W |
| HG/ | Copper Continuous | 2.76 | Negative | Buy | O | 2.71 | +2W |
| ZG/ | Corn (Electronic Day Session) Continuous | 363.25 | Negative | Buy | O | 384.62 | -5W |
The decade known as the 2010s is almost behind us as we are about to close the books on 2019 within the next few weeks. In looking back at the "twenty-tens," it's fair to say that it was a ten-year period dominated by strength in equities and general weakness in alternatives. In other words, it was a lost decade for most alternatives, particularly commodities. Over the past ten years (at least through 12/10/19), commodities, as represented by the Continuous Commodity Index UV/Y, have fallen -16.21%. Meanwhile, Crude Oil Continuous CL/ has fallen -25.88%! To put this in perspective, the S&P 500 SPX has gained 181.23%. During this time, the US Dollar DX/Y gained 25.28%, contributing to the tough environment for commodities in general. However, it wasn't always like this for commodities. The 2010s were a 180-degree turn for the commodities asset class compared to its run in the 2000s, during which time commodities were the number one ranked asset in the DALI asset class ranking 33% of the time. So far in the 2010s, commodities has only been in first place 3% of the time while domestic equities has led 89% of the time (through 9/30/19). In addition, one can see in the graphic below, the weakness in commodities has been present throughout much of the decade as the commodities fund group has been scoring below 3 for most of the time since 2011. This isn't to say that the next decade, or the 2020s, will see a resurgence in commodities, but rather, if we do see commodities start to lead, it would be prudent to adapt and go with the trends, as they can be quite persistent.

Average Level
27.86
| AGG | iShares US Core Bond ETF |
| USO | United States Oil Fund |
| DIA | SPDR Dow Jones Industrial Average ETF |
| DVY | iShares Dow Jones Select Dividend Index ETF |
| DX/Y | NYCE U.S.Dollar Index Spot |
| EFA | iShares MSCI EAFE ETF |
| FXE | Invesco CurrencyShares Euro Trust |
| GLD | SPDR Gold Trust |
| GSG | iShares S&P GSCI Commodity-Indexed Trust |
| HYG | iShares iBoxx $ High Yield Corporate Bond ETF |
| ICF | iShares Cohen & Steers Realty ETF |
| IEF | iShares Barclays 7-10 Yr. Tres. Bond ETF |
| LQD | iShares iBoxx $ Investment Grade Corp. Bond ETF |
| IJH | iShares S&P 400 MidCap Index Fund |
| ONEQ | Fidelity Nasdaq Composite Index Track |
| QQQ | Invesco QQQ Trust |
| RSP | Invesco S&P 500 Equal Weight ETF |
| IWM | iShares Russell 2000 Index ETF |
| SHY | iShares Barclays 1-3 Year Tres. Bond ETF |
| IJR | iShares S&P 600 SmallCap Index Fund |
| SPY | SPDR S&P 500 Index ETF Trust |
| TLT | iShares Barclays 20+ Year Treasury Bond ETF |
| GCC | WisdomTree Continuous Commodity Index Fund |
| VOOG | Vanguard S&P 500 Growth ETF |
| VOOV | Vanguard S&P 500 Value ETF |
| EEM | iShares MSCI Emerging Markets ETF |
| XLG | Invesco S&P 500 Top 50 ETF |
Relative strength is a measure of how a stock is performing when compared to something else, in this case the S&P 500 Equal Weighted Index (SPXEWI). Each day the stock's closing price is divided by that of the SPXEWI, the resulting numbers decimal is moved two places and then plotted on a Point & Figure chart. Whenever the relative strength chart shows a double top buy signal (e.g. RS Buy or Positive Relative Strength), it suggests the stock is likely to outperform the market for the foreseeable future. Conversely, whenever the relative strength chart gives a double bottom sell signal (e.g. RS Sell or Negative Relative Strength) it suggests the stock will under-perform the market. Relative strength signals tend to last roughly 18 to 24 months on average. Consequently, changes from buy signals to sell signals (and vice versa) are important to be aware of as they are longer-term implications of a stock's likely performance versus the indices. Using the Point & Figure chart along with the relative strength chart will allow you to better ascertain risk-reward and other trade management tools, but we always want to over-weight our portfolios toward those stocks that are on RS buy signals, giving us the best chance of outperforming the broader market.
In the Optionable Universe, this week we saw 19 relative strength buy signals compared to 13 last week. On the sell side, there were 8 relative strength sell signals compared to 5 last week.
| Symbol | Company | Sector | Price | RS vs Market Signal | RS vs Market Column | RS vs Peer Signal | RS vs Peer Column | Tech Attrib |
|---|---|---|---|---|---|---|---|---|
| BELFB | Bel Fuse Inc - CL B | Industrial Goods & Svcs | 18.890 | Buy | X | Buy | X | 5 |
| FIZZ | National Beverage Corporation | Food and Beverage | 55.795 | Buy | X | Sell | X | 4 |
| CLW | Clearwater Paper Corp. | Basic Resources | 21.820 | Buy | X | Sell | X | 4 |
| FQVLF | First Quantum Minerals Ltd. | Basic Resources | 10.037 | Buy | X | Sell | X | 4 |
| EXPR | Express, Inc. | Retail | 6.150 | Buy | X | Buy | X | 4 |
| LYTS | Lsi Industries Inc | Industrial Goods & Svcs | 5.950 | Buy | X | Buy | X | 4 |
| SKY | Skyline Champion Corp | Cyclical Goods and Services | 33.860 | Buy | X | Buy | X | 5 |
| SPPI | Spectrum Pharmaceuticals Inc. | Pharmaceuticals | 10.350 | Buy | X | Sell | X | 3 |
| STAA | Staar Surgical Company | Medical Products | 37.180 | Buy | X | Buy | X | 5 |
| SWKS | Skyworks Solutions, Inc. | Semiconductors | 104.390 | Buy | X | Sell | X | 3 |
| TLYS | Tilly's Inc | Retail | 12.600 | Buy | X | Sell | X | 3 |
| GTT | GTT Communications Inc. | Technology Services | 12.660 | Buy | X | Buy | X | 4 |
| LE | Lands' End, Inc | Retail | 16.010 | Buy | X | Buy | X | 5 |
| ITCI | Intra-Cellular Therapies Inc | Biotechnology | 12.250 | Buy | X | Sell | X | 4 |
| AUPH | Aurinia Pharmaceuticals Inc | Pharmaceuticals | 17.700 | Buy | X | Buy | X | 5 |
| JNCE | Jounce Therapeutics Inc | Biotechnology | 8.395 | Buy | X | Buy | X | 4 |
| RUBY | Rubius Therapeutics, Inc. | Pharmaceuticals | 12.020 | Buy | X | Sell | X | 3 |
| LTHM | Livent Corp. | Industrial Goods & Svcs | 8.410 | Buy | X | N/A | X | 3 |
| EXPR.TR | Express, Inc. TR | Retail | 6.150 | Buy | X | Buy | X | 4 |
| Symbol | Company | Sector | Price | RS vs Market Signal | RS vs Market Column | RS vs Peer Signal | RS vs Peer Column | Tech Attrib |
|---|---|---|---|---|---|---|---|---|
| CIEN | CIENA Corporation | Communications Technology | 34.690 | Sell | O | Buy | O | 1 |
| CONN | Conn's, Inc. | Retail | 13.650 | Sell | O | Sell | O | 0 |
| FRAN | Francesca's Holdings Corp. | Retail | 12.440 | Sell | O | Sell | O | 0 |
| CEQP | Crestwood Equity L.P. | Gas Utilities | 31.160 | Sell | O | Buy | O | 3 |
| TXT | Textron Inc. | Industrial Goods & Svcs | 44.140 | Sell | O | Sell | O | 0 |
| ULBI | Ultralife Batteries Inc | Noncyclical Goods and Svcs | 7.640 | Sell | O | Sell | O | 0 |
| GRA.TR | W.R. Grace & Co TR | Chemicals | 66.142 | Sell | O | Sell | O | 2 |
| TXT.TR | Textron Inc. TR | Industrial Goods & Svcs | 44.157 | Sell | O | Sell | O | 0 |
| Symbol | Company | Sector | Current Price | Action Price | Target | Stop | Notes |
|---|---|---|---|---|---|---|---|
| DHI | D.R. Horton, Inc. | Building | $55.13 | lower-to-upper $50s | $79 | $43 | 5 for 5'er, pos trend, all-time high, consec buy signals, LT market RS buy signal |
| BMI | Badger Meter Inc. | Electronics | $61.73 | 59 - 63 | 82 | 50 | 4 for 5'er. top half of favored ELEC sector matrix, spread triple top to ATH |
| NI | Nisource, Inc. | Utilities/Electricity | $27.00 | 26 - 29 | 43.25 | 22 | 4 for 5'er, favored EUTI sector, LT pos trend, LT pos mkt RS, 3.0% yield, R-R>3.0 |
| LOW | Lowe's Companies, Inc. | Building | $116.48 | $110s - $120 | $159 | $94 | 4 for 5'er, all-time high, LT market RS buy signal, consec buy signals, 1.89% yield |
| TDG | TransDigm Group, Inc. | Aerospace Airline | $569.25 | 530s - 560s | 728 | 448 | 5 for 5'er, #6 of 46 names in AERO matrix, spread triple top, pullback from ATH, LT pos mkt RS |
| BOOT | Boot Barn Holdings Inc | Retailing | $41.61 | hi 30s - low 40s | 48 | 34 | 5 for 5'er, top 10% of RETA sector matrix, spread triple top, pullback from ATH, pot. cov write, pos mnthly mom flip |
| CPRT | Copart Incorporated | Autos and Parts | $88.38 | upper $80s to mid/lower $90s | $148 | $72 | 5 for 5'er, LT pos trend, LT market RS buy signal, pull back from ATH |
| KSU | Kansas City Southern | Transports/Non Air | $151.16 | uppers 140s - mid 150s | 172 | 124 | 5 for 5'er, #5 of 45 in TRAN sector matrix, multiple buy signals, pullback from ATH, 1% yield |
| ITW | Illinois Tool Works Inc. | Machinery and Tools | $174.45 | low $170s to low $180s | $222 | $136 | 4 for 5'er, fav DWAMACH, LT market RS, pullback from matching ATH, 2.45% yield |
| AMAT | Applied Materials, Inc. | Semiconductors | $56.62 | hi 50s to low 60s | 66 | 47 | 4 for 5'er, top 25% of favored SEMI sector matrix, multi consec buy signals, pullback from ATH, 1.5% yield |
| Symbol | Company | Sector | Current Price | Action Price | Target | Stop | Notes |
|---|---|---|---|---|---|---|---|
| EYE | National Vision Holdings, Inc. | Retailing | $30.10 | (30 - 26) | 21 | 33 | 2 for 5'er, spread quad bottom, rally from all-time low, LT neg. trend |
| LC | Lendingclub Corp | Finance | $12.91 | (13.50 - 12) | 9 | 15.50 | 1 for 5'er, bottom 20% of FINA sector matrix, triple bottom, neg. wkly mom flip |
| Symbol | Company | Sector | Current Price | Action Price | Target | Stop | Notes |
|---|---|---|---|---|---|---|---|
| WORK | Slack Technologies, Inc. Class A | Internet | $22.25 | (21 - 19) | 17 | 24 | OK to add or maintain short exposure here. Abide by $24 stop. |
| Comment | |||||||
|---|---|---|---|---|---|---|---|
|
|
|||||||
LC Lendingclub Corp R ($12.87) - Finance - LC is a 1 for 5'er that ranks in the bottom quintile of the finance sector matrix. The stock has been in almost perpetual decline over the last few years and reached a new all-time low after breaking a triple bottom in October. A recent flip to negative weekly momentum is sign of further potential deterioration. Short exposure may be added in the $12 - $13.50 range and we will set our initial buy stop at $15.50, a potential triple top breakout, which would also return LC to a positive overall trend. We will use the bearish price objective of $9 as our target price.
| 17 | 18 | 19 | |||||||||||||||||||||||||||||||||||||||||||||||||||
| 33.00 | X | • | • | 33.00 | |||||||||||||||||||||||||||||||||||||||||||||||||
| 32.00 | 2 | O | • | X | X | • | 32.00 | ||||||||||||||||||||||||||||||||||||||||||||||
| 31.00 | O | X | O | • | X | O | X | O | • | 31.00 | |||||||||||||||||||||||||||||||||||||||||||
| 30.00 | O | X | O | X | X | O | X | O | • | 30.00 | |||||||||||||||||||||||||||||||||||||||||||
| 29.00 | O | X | 1 | O | 4 | O | X | O | A | • | 29.00 | ||||||||||||||||||||||||||||||||||||||||||
| 28.00 | O | X | O | X | O | X | O | X | O | • | 28.00 | ||||||||||||||||||||||||||||||||||||||||||
| 27.00 | C | X | O | X | O | X | 5 | X | • | B | • | 27.00 | |||||||||||||||||||||||||||||||||||||||||
| 26.00 | O | O | 3 | X | 7 | X | • | O | • | 26.00 | |||||||||||||||||||||||||||||||||||||||||||
| 25.00 | O | 8 | • | O | • | 25.00 | |||||||||||||||||||||||||||||||||||||||||||||||
| 24.00 | • | O | • | 24.00 | |||||||||||||||||||||||||||||||||||||||||||||||||
| 23.00 | O | • | 23.00 | ||||||||||||||||||||||||||||||||||||||||||||||||||
| 22.00 | O | X | • | X | 22.00 | ||||||||||||||||||||||||||||||||||||||||||||||||
| 21.00 | O | X | O | X | • | X | O | • | 21.00 | ||||||||||||||||||||||||||||||||||||||||||||
| 20.00 | C | X | O | X | O | X | X | • | X | 7 | O | A | • | 20.00 | |||||||||||||||||||||||||||||||||||||||
| 19.50 | O | X | O | X | O | X | O | X | X | O | • | X | O | X | 8 | X | X | O | • | • | 19.50 | ||||||||||||||||||||||||||||||||
| 19.00 | O | X | O | 1 | X | O | X | O | X | O | • | X | O | X | O | X | O | X | O | • | X | • | • | 19.00 | |||||||||||||||||||||||||||||
| 18.50 | O | X | O | X | O | X | O | X | O | X | O | O | X | O | X | O | X | O | • | X | • | 18.50 | |||||||||||||||||||||||||||||||
| 18.00 | O | X | 2 | O | O | X | O | X | 6 | O | X | O | X | O | X | X | O | X | • | X | O | • | 18.00 | ||||||||||||||||||||||||||||||
| 17.50 | O | X | O | X | O | X | O | X | O | 9 | X | O | X | O | X | O | X | O | 5 | O | • | 17.50 | |||||||||||||||||||||||||||||||
| 17.00 | O | X | O | 3 | 4 | X | O | X | O | X | O | X | O | X | O | X | O | X | O | • | 17.00 | ||||||||||||||||||||||||||||||||
| 16.50 | O | O | X | O | X | O | O | • | O | • | O | B | O | 2 | O | X | O | X | • | 16.50 | |||||||||||||||||||||||||||||||||
| 16.00 | O | X | O | X | • | • | • | O | X | C | X | O | 4 | O | X | X | O | • | Top | 16.00 | |||||||||||||||||||||||||||||||||
| 15.50 | O | O | X | • | O | X | O | X | O | X | O | X | O | X | O | X | • | • | • | 15.50 | |||||||||||||||||||||||||||||||||
| 15.00 | O | X | X | • | O | • | O | X | O | X | O | X | O | X | O | X | O | X | • | X | • | 15.00 | |||||||||||||||||||||||||||||||
| 14.50 | O | X | O | X | • | • | O | X | 3 | 6 | X | 7 | • | O | X | O | 9 | O | X | O | 14.50 | ||||||||||||||||||||||||||||||||
| 14.00 | O | X | O | X | • | O | 1 | O | • | • | 8 | X | O | X | O | X | O | 14.00 | |||||||||||||||||||||||||||||||||||
| 13.50 | O | O | X | • | O | X | • | • | O | X | O | X | O | B | O | 13.50 | |||||||||||||||||||||||||||||||||||||
| 13.00 | 5 | • | O | X | • | O | O | O | X | O | Mid | 13.00 | |||||||||||||||||||||||||||||||||||||||||
| 12.50 | • | O | • | A | X | 12.50 | |||||||||||||||||||||||||||||||||||||||||||||||
| 12.00 | • | O | X | 12.00 | |||||||||||||||||||||||||||||||||||||||||||||||||
| 11.50 | O | X | 11.50 | ||||||||||||||||||||||||||||||||||||||||||||||||||
| 11.00 | O | 11.00 | |||||||||||||||||||||||||||||||||||||||||||||||||||
| 17 | 18 | 19 |
| AEO American Eagle Outfitters, Inc. ($14.09) - Retailing - American Eagle shares broke a double bottom in response to earnings today, returning the stock to a sell signal. Today's break also marks a negative trend reversal for the stock, demoting it to a 1 for 5'er. AEO also ranks 73rd of 83 names included in the retailing sector RS matrix. Supply is in control and long exposure should be avoided. Short sellers should note that AEO tests support at $14 and carries a yield of 3.91%. |
| CP Canadian Pacific Railway Limited ($246.92) - Transports/Non Air - Canadian Pacific Railway shares broke a spread triple top with today's advance to $248, marking a second consecutive buy signal and a new all-time high. CP is a strong 4 for 5'er trading well above its bullish support line that was established in February of 2019. Additionally, the stock has been on a market RS buy signal since 2012 and ranks 14th of 45 names included in the favored transports/non air sector RS matrix. Demand is in control and long exposure may be added here or on a pullback, as CP is approaching overbought levels. Initial support is offered at $232. |
| EVR Evercore Inc. ($73.91) - Finance - Evercore shares returned to a sell signal with today's double bottom break at $74. EVR is a weak 2 for 5'er that moved to a negative trend in October of 2019 and ranks 74th of 79 names included in the finance sector RS matrix. The weight of the evidence is negative and long exposure should be avoided. Short sellers should note that EVR carries a yield of 3.14%. |
| INTU Intuit Inc. ($249.71) - Software - Intuit shares broke a double bottom at $248 during today's session, marking a third consecutive sell signal. Although the weight of the overall evidence is positive for this 5 for 5'er, multiple consecutive sell signals suggest that supply is in control in the near-term. No new positions at this time. For those following the stock, we maintain our stop at $236, a potential spread quadruple bottom break on INTU's default chart. |
| MIDD The Middleby Corporation ($108.62) - Household Goods - The Middleby Corporation shares continued lower today, breaking a double bottom at $108 to return to a sell signal. This 0 for 5'er moved to a negative trend in August and has been on a market RS sell signal since May of 2018. Additionally, the stock ranks 27th of 35 names included in the household goods sector RS matrix. Supply is in control. Avoid long exposure. |
| MNST Monster Beverage Corp. ($62.15) - Food Beverages/Soap - Monster Beverage continued higher today, completing a spread triple top break at $62 to mark a second consecutive buy signal. This 4 for 5'er continues to display absolute strength and relative strength in the near-term. Okay to add long exposure here or on a pullback to initial support at $58. |
| OKE ONEOK, Inc. ($72.42) - Gas Utilities - ONEOK broke a double top at $73 during today's action, marking a second consecutive buy signal. This strong 5 for 5'er ranks first of 23 names included in the gas utilities sector RS matrix. Additionally, the stock has traded in a positive trend since January of 2019 and has been on a market RS buy signal since March of 2016. Demand is in control and long exposure may be added here. Note that OKE finds initial support at $69 and subsequent support at $68. The stock also carries a yield of 5.06%. |
| SBNY Signature Bank (the Bank) ($130.84) - Banks - Signature Bank shares reversed up today to break a spread quadruple top at $130 and mark a third consecutive buy signal. SBNY is a 4 for 5'er that returned to a positive trend in October. Okay to add here on the breakout as demand is in control. Note that Initial support is offered at $122 and that SBNY carries a yield of 1.71%. |
| TEAM Atlassian Corp. PLC ($116.85) - Software - Atlassian Corp shares reversed down today to break a double bottom at $116 before continuing lower to $114. Today's break returns the stock to a sell signal and marks a negative trend reversal, demoting TEAM to a 2 for 5'er. Additionally, the stock ranks 91st of 116 names included in the software sector RS matrix. The technical picture is negative. Avoid long exposure. |
| WELL Welltower Inc. ($81.43) - Real Estate - Welltower shares broke a double bottom at $82 during today's action to mark a second consecutive sell signal before continuing further past support to $81. Although WELL maintains a 4 for 5 TA rating and has traded in a positive trend since August of 2018, recent consecutive sell signals and a flip to negative monthly momentum suggest that supply is in control in the near-term. No new positions at this time. For those maintaining long exposure, WELL tests support at $81 and finds the bullish support line at $77. |
| Name | Option Symbol | Action | Stop Loss |
|---|---|---|---|
| Arthur J. Gallagher & Co. - $94.44 | O: 20D90.00D17 | Buy the April 90.00 calls at 6.90 | 85.00 |
| Name | Option | Action |
|---|---|---|
| Agilent Technologies, Inc ( A) | Feb. 70.00 Calls | Raise the option stop loss to 1.55 (CP: 13.55) |
| Name | Option Symbol | Action | Stop Loss |
|---|---|---|---|
| Merit Medical Systems Inc - $30.01 | O: 20P35.00D17 | Buy the April 35.00 puts at 6.80 | 33.00 |
| Name | Option | Action |
|---|---|---|
| Omnicom Group Inc. (OMC) | Apr. 80.00 Puts | Stopped at 81.00 (CP: 80.75) |
| Name | Option Sym. | Call to Sell | Call Price | Investment for 500 Shares | Annual Called Rtn. | Annual Static Rtn. | Downside Protection |
|---|---|---|---|---|---|---|---|
| Applied Materials, Inc. $56.62 | O: 20D60.00D17 | Apr. 60.00 | 4.20 | $27,635.20 | 21.37% | 18.42% | 6.07% |
| Name | Action |
|---|---|
| Boot Barn Holdings Inc (BOOT) - 41.61 | Sell the February 40.00 Calls. |
| Boot Barn Holdings Inc (BOOT) - 41.61 | Sell the February 40.00 Calls. |
| United Rentals, Inc. (URI) - 153.78 | Sell the March 160.00 Calls. |
| KB Home (KBH) - 34.98 | Sell the April 36.00 Calls. |
| Chegg Inc (CHGG) - 37.94 | Sell the April 40.00 Calls. |
| Micron Technology, Inc. (MU) - 47.46 | Sell the April 50.00 Calls. |
| XPO Logistics Inc (XPO) - 81.00 | Sell the May 90.00 Calls. |
| Vertex Pharmaceuticals Incorporated (VRTX) - 220.27 | Sell the April 230.00 Calls. |
| Lattice Semiconductor Corp (LSCC) - 18.83 | Sell the March 20.00 Calls. |
| Take-Two Interactive Software, Inc. (TTWO) - 122.29 | Sell the March 125.00 Calls. |
| Advanced Micro Devices, Inc. (AMD) - 39.44 | Sell the April 40.00 Calls. |
| JD.COM INC (JD) - 33.26 | Sell the March 35.00 Calls. |
| Crocs, Inc. (CROX) - 35.60 | Sell the March 37.00 Calls. |
| Name | Covered Write |
|---|---|
| Centene Corporation ( CNC - 59.62 ) | March 62.50 covered write. |
| Manhattan Associates, Inc. ( MANH - 79.19 ) | April 85.00 covered write. |
| Best Buy Co., Inc. ( BBY - 82.88 ) | March 85.00 covered write. |
Daily Equity & Market Analysis
Loading, Please Wait...
