
Small and micro-cap size and style categories make up 4 of the top 5 most-improved asset class groups. Small cap stocks are also moving back to buy signals. We explore these developments in today's feature.
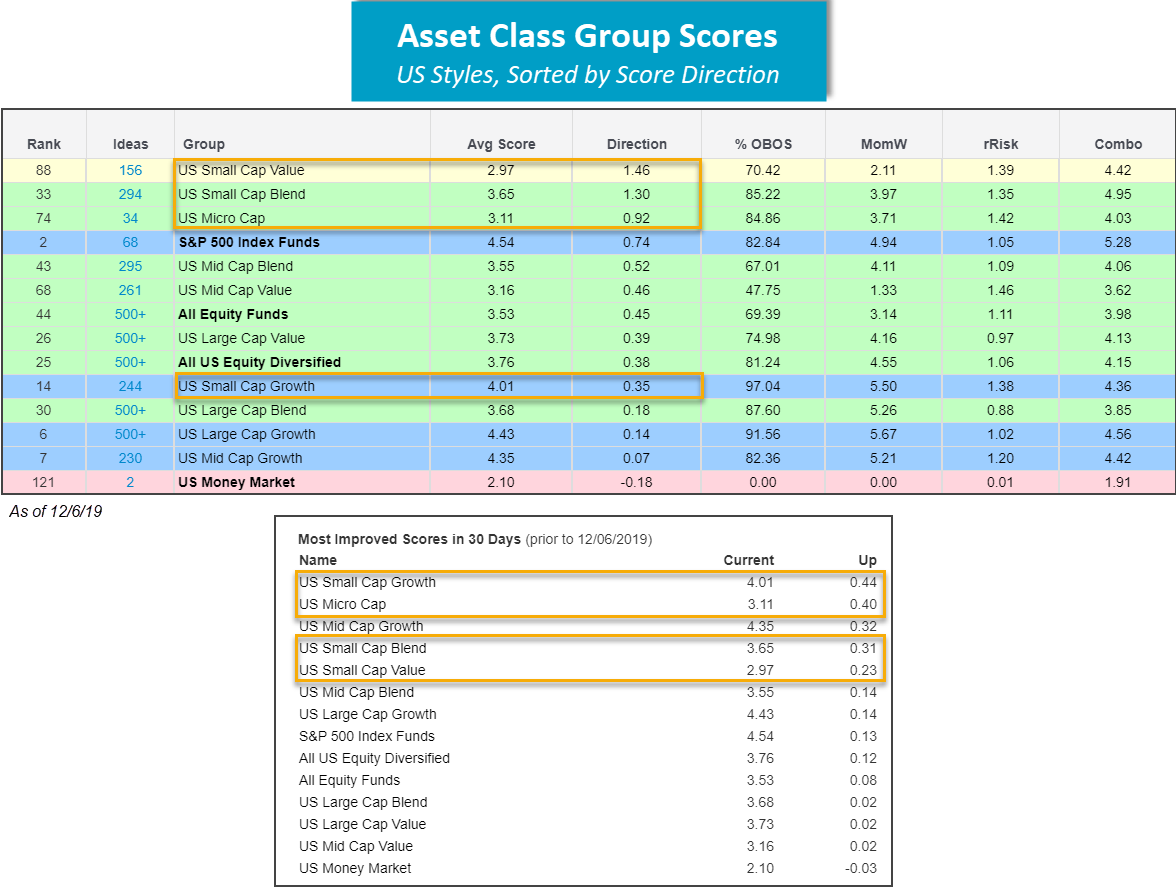
Improvements in relative strength among small-cap domestic equity mutual funds and ETFs is on full display on the Asset Class Group Scores (ACGS) tool. As a refresher, ACGS ranks asset class groups by their constituents’ average fund scores, with a reading of 0 being the worst possible score and a reading of 6 the best possible score. To specifically view US size and style categories, select “US Styles” under filters and then click “Set View”. While large-cap equities score better overall than their small-cap counterparts, notable small-cap style categories of value and blend post the best score improvement readings of all size and style categories over the past six-month period, as indicated by the “Direction” column. By using the “Group Score Report” tool found in the upper lefthand-hand corner of the tool, we can refine score direction to a 30-day lookback. On a near-term basis, small and micro-cap size and style categories make up 4 of the top 5 most-improved asset class groups, attesting to the aforementioned intermediate-term (default) view. In reaction to strong yet relatively sharp score improvement for small-cap variants, each asset class displays a heavily overbought % OBOS reading above 70%, which suggests that a pullback may present a better opportunity for long exposure at this time.
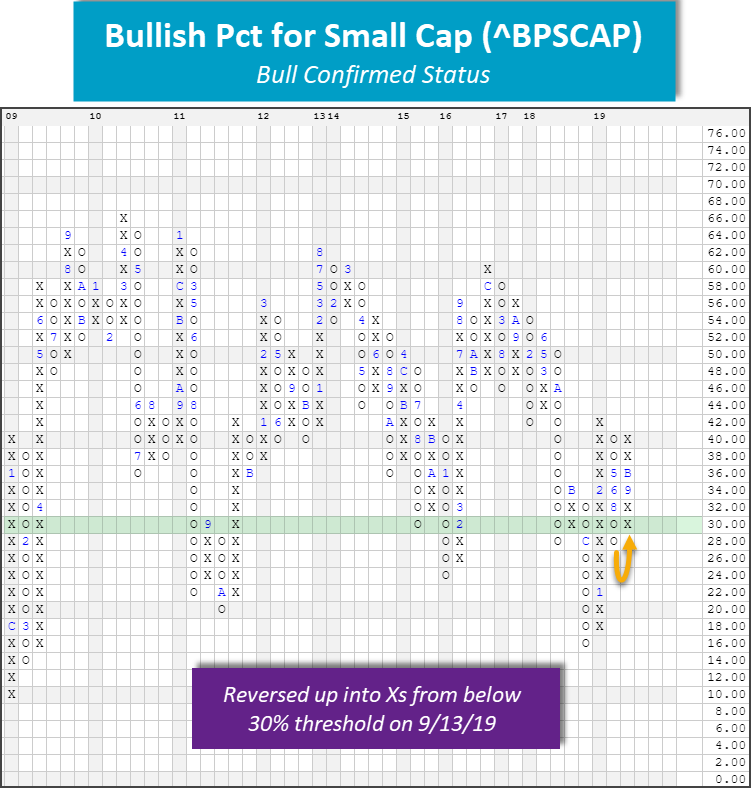
The Bullish Percents indicators or BPs for short, gauge bullish participation among a constituency of individual securities by assessing the percentage of positions on Point & Figure buy signals relative to the aggregate total. BP indicators offer a picture of intermediate-term market strength, with participation readings ranging from 0% to 100% of constituents on PnF buy signals. Additionally, column reversals down from above 70% or up from below 30% may be interpreted as a necessity for offense or defense. In September, we witnessed such an event among small-cap domestic equity stocks from the Bullish Percent for Small Cap ^BPSCAP with a reversal up into Xs from below the 30% threshold to 34%. Coupled with a bull confirmed status resulting from higher tops and higher bottoms on the indicator, this development heralded and continues to affirm a highly-bullish event for small-cap stocks. Since the reversal, BPSCAP has continued higher to its current reading of 40%, displaying a mid-field position that offers an attractive point of entry for long exposure in this area.
Small Cap Shopping List of Ideas:
To build a shopping list of strong small cap stocks, we can utilize the Security Screener tool (Security Selection -> Security Screener), using the search criteria below. For this particular screen, we focused on strength and actionability by zeroing in on high attribute rated small cap stocks with plenty of trading volume. We then screened for actionable opportunities as well as provided stocks from a diverse array of sectors (There were many sectors represented in the list, ranging from perennial leaders, like technology to up and comers, like healthcare). The table below contains the shopping list. Clicking the symbol will provide access to the stock's PnF chart. If you have a question, feel free to give us a call at (804) 320-8511.
Search Criteria:
- Market Cap & Style: Small Cap
- 30 Day Average Volume: >500,000
- Price Range: >$20.00
- Tech Attribute: 3,4,5
Observations:
- 69.23% of the stocks in the list have positive weekly momentum
- 100% are trading in a positive trend and 92.31% are in X's against the market (Market RS in X's)
- Average Technical attribute rating is 4.31
- Average weekly OBOS level is 45.08%
Small Cap Shopping List:
| Symbol | Name | Price | Tech Attrib/Score | DWA Sector | Yield |
|---|---|---|---|---|---|
| AIMT | Aimmune Therapeutics Inc | 29.65 | 4 |
Drugs | 0.00 |
| BOOT | Boot Barn Holdings Inc | 42.04 | 5 |
Retailing | 0.00 |
| CATM | Cardtronics PLC | 41.07 | 5 |
Finance | 0.00 |
| CCXI | ChemoCentryx Inc. | 31.28 | 5 |
Biomedics/Genetics | 0.00 |
| ELY | Callaway Golf Company | 21.02 | 5 |
Leisure | 0.19 |
| FSLY | Fastly, Inc. Class A | 21.18 | 4 |
Computers | 0.00 |
| INST | Instructure Inc | 49.12 | 5 |
Software | 0.00 |
| MTSI | MACOM Technology Solutions Holdings Inc. | 25.04 | 4 |
Semiconductors | 0.00 |
| RCII | Rent-A-Center, Inc. | 26.74 | 3 |
Retailing | 3.74 |
| RDFN | Redfin Corporation | 21.22 | 3 |
Real Estate | 0.00 |
| SYNA | Synaptics Incorporated | 58.27 | 4 |
Computers | 0.00 |
| TNK | Teekay Tankers, Ltd. | 20.24 | 5 |
Transports/Non Air | 0.59 |
| WGO | Winnebago Industries, Inc. | 48.39 | 4 |
Leisure | 0.91 |
Spotlight Idea: Boot Barn Holdings Inc. (BOOT)
BOOT Boot Barn Holdings Inc ($41.77) - Retailing - Shares of BOOT continue to advance and it's now sitting two boxes away from surpassing the previous all-time high made on November 18th. The perfect 5 for 5’er ranks ninth out of 83 names in the retailing stock sector matrix and currently trades on four consecutive buy signals. Furthermore, the stock demonstrates long –term relative strength versus the market as well as its peer group, remaining on an RS buy signal since November of 2017 and August of 2016, respectively. Additionally, monthly momentum recently flipped to positive, indicating the potential for further upside from here. Overall the technical picture is positive and BOOT is actionable at current levels. Overhead resistance resides at $44 on the default chart and initial support is offered at $38 and $35. Note a move to $33 would violate the bullish support line.

