
Breaking down the strong performance the month of December has historically brought to broad domestic equity indexes.
With the first week of December behind us, we are now in the final stretch of 2019 with just thirteen trading days left in the year. Those of you who have been regular readers of this Report know that there are several market tendencies or historical biases that we highlight throughout the year. In many cases these are observations that have been documented over time within one of our favorite trading resources, the Stock Trader's Almanac; and include items such as market seasonality, the "January Barometer," and performance patterns surrounding presidential elections. Additionally, they have compiled ample data to support the sentiment that September and October are among the worst-performing months of the year, while the month of December offers some of the best return numbers. In fact, December has historically been the single best performing month for the Russell 2000 RUT (based on data back to 1979 through April 2019). Furthermore, it is the second-best performing month for major market indices such as the S&P 500 Index SPX, the Nasdaq Composite Index NASD (using data from 1971 - April 2019), and the Russell 1000 RUI (using data from 1979 - April 2019).
Beyond the strong average performance, there are a few other notable return patterns that have historically held true during the month of December. For instance, it is often believed that much of the returns for the month come in the latter half of the month. The Stock Trader's Almanac mentions strong end of month performance as part of its "Santa Claus Rally" study, stating, "Santa Claus tends to come to Wall Street nearly every year, bringing a short, sweet, and respectable rally within the last five days of the year and the first two in January." We will discuss the Santa Claus Rally in more detail later in the month, but today we wanted to address the historical performance dispersion between the first and second half of December. We have gathered return data for the SPX and the DJIA for three different segments: the first half of the month, the second half of the month, and the month as a whole. The results are in the table below, and confirm that the entirety of the average net gains for both the SPX and DJIA come in the second half of the month. Taking this one step further, the underlying data shows that the SPX has a positive return in the first half of the month about 59% of the time, versus a 75% success ratio of positive returns in the second half of the month. The DJIA results are similar with only 57% of the years tested yielding gains in the first half of December, while the second half of the month saw gains approximately 70% of the time on average. The results are even more notable if we focus on only small-cap equities, as the S&P 600 Small Cap Index SML has only demonstrated positive returns over the first half of December in 37% of years, while the second half of the month has led to gains 83% of the time.

*This example is presented for illustrative purposes only and does not represent a past recommendation. The performance above is based on pure price returns, not inclusive of dividends or all transaction costs. Investors cannot invest directly in an index. Indexes have no fees. Past performance is not indicative of future results. Potential for profits is accompanied by the possibility of loss.
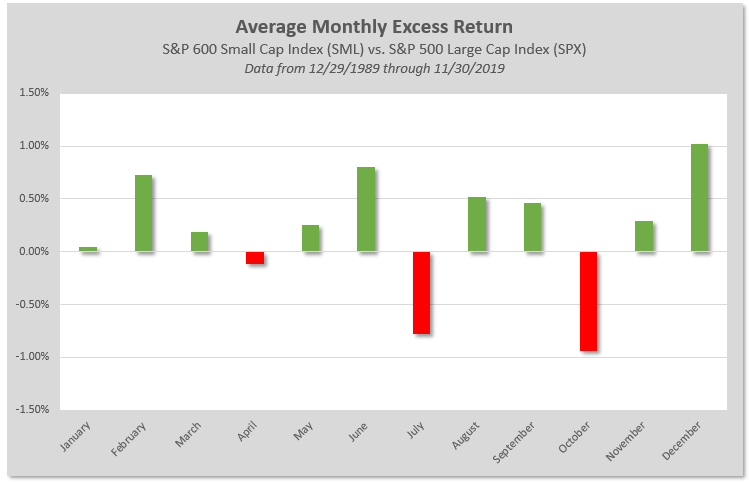
This leads to another December theme that has presented itself more often than not over the years; the outperformance of Small Cap stocks relative to Large Cap names. The Stock Trader's Almanac theorizes that this is attributed to the "January Effect" that over the years has moved earlier and earlier within the calendar year. The overall concept is that many beaten-down small stocks being dumped for tax-loss purposes begin to rebound in December and this effect continues to spill over into January as investors are willing to accept more risk in the portfolio. The chart below looks at the average excess return of the S&P 600 Small-Cap Index SML over the SPX for each month of the year. Notice that December has, in fact, on average, provided the greatest margin of outperformance by Small Caps going back over the last 30 years.
When we think about these December biases in context with the current market, December 2019 very well could be setting itself up nicely to follow in the footsteps of the Decembers before it. With respect to the Small Cap story, we have seen notable improvement both on an absolute and relative basis across that segment of the market. As we highlighted in the Daily Equity Report on Monday, small-cap groups have risen to the top of the score direction rank of US styles on the Asset Class Group Scores page, and we saw the Bullish Percent for All Small Caps ^BPSCAP continue higher in recent weeks, indicating further participation within the space. We will continue to monitor the markets for any material changes between supply and demand, but a strong finish to the year with the near-term improvement of small-caps is something our indicators currently support.
