
Over the past couple of weeks, Precious Metals, along with Oil (See: ETF Spotlight), have been bright spots in the broad commodity market. For example, over the past 30 Days, Gold Continuous [GC/] gained 2.79% while the S&P 500 [SPX] fell -1.66%.
Remember, these are technical comments only. Just as you must be aware of fundamental data for the stocks we recommend based on technical criteria in the report, so too must you be aware of important data regarding delivery, market moving government releases, and other factors that may influence commodity pricing. We try to limit our technical comments to the most actively traded contracts in advance of delivery, but some contracts trade actively right up to delivery while others taper off well in advance. Be sure you check your dates before trading these contracts. For questions regarding this section or additional coverage of commodities email ben.jones@dorseywright.com.
Data represented in the table below is through 04/18/2018:
Broad Market Commodities Report
Portfolio View - Commodity Indices
| Symbol | Name | Price | Trend | RS Signal | RS Col. | 200 Day MA | Weekly Mom |
| CL/ | Crude Oil Continuous | 66.47 | Positive | Buy | X | 55.90 | +2W |
| DBLCIX | Deutsche Bank Liquid Commodities Index | 358.21 | Negative | Sell | O | 331.44 | +5W |
| DWACOMMOD | DWA Continuous Commodity Index | 478.61 | Positive | Sell | O | 462.08 | +1W |
| GC/ | Gold Continuous | 1350.30 | Positive | Buy | X | 1299.69 | +3W |
| GN/Y | S&P GSCI Index Spot | 464.85 | Positive | Sell | O | 417.92 | +2W |
| HG/ | Copper Continuous | 3.08 | Positive | Buy | X | 3.04 | +1W |
| ZG/ | Corn (Electronic Day Session) Continuous | 380.25 | Positive | Sell | X | 358.77 | -2W |
| Links to Additional Summaries |
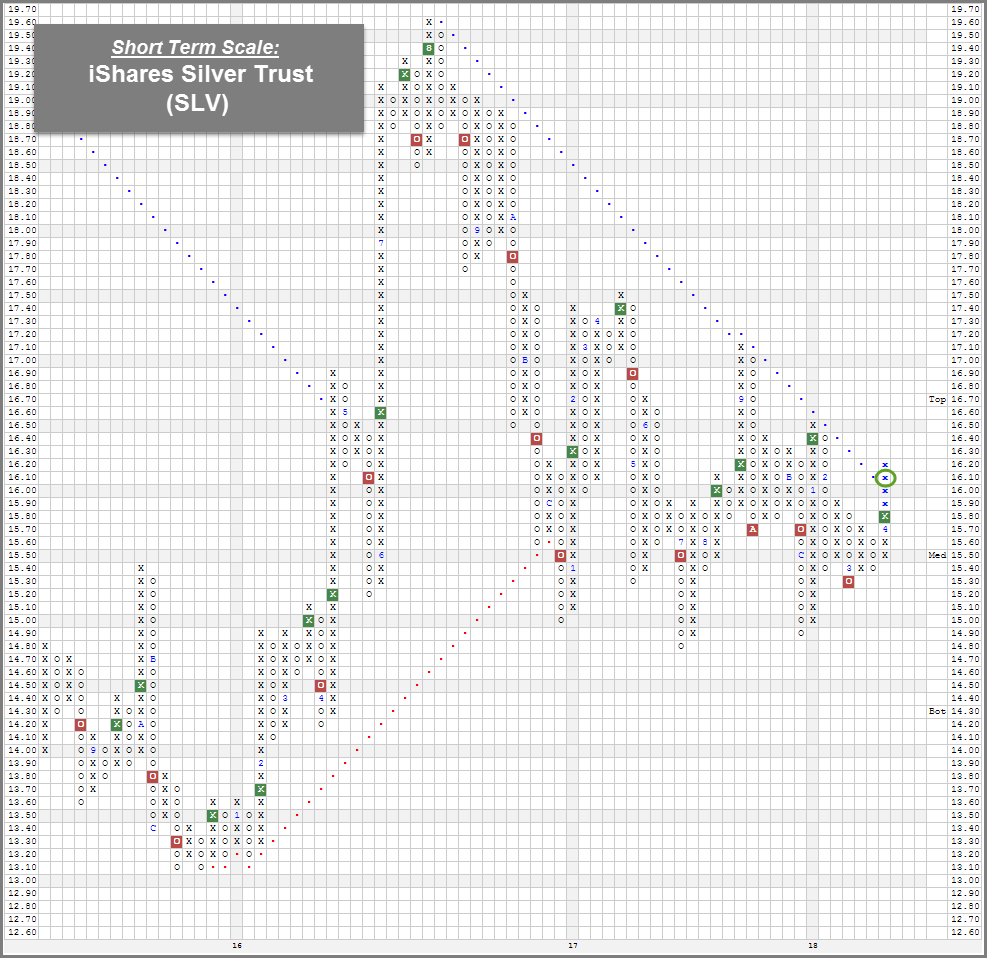
Over the past couple of weeks, Precious Metals, along with Oil (See: ETF Spotlight), have been bright spots in the broad commodity market. For example, over the past 30 Days, Gold Continuous GC/ gained 2.79% while the S&P 500 SPX fell -1.66%. Additionally, as you can see in the Portfolio View - Commodity Indices table above, Gold's GC/ weekly momentum has been positive for the last three weeks. GC/ has rallied along with the rest of the commodity space, as the S&P GSCI Index Spot GN/Y has also made a positive run, seeing that it's up 4.55% over the past 30 days. Like Gold, Silver SLV has improved as well. For example, the iShares Silver Trust SLV has rallied 2.66% over the past 30 days. It's still in the red for the year, but it's within a couple percent from flipping positive. The recent bounce in Silver prices has also been enough to push its short term chart into a positive trend. SLV managed to breakout the negative trendline at $16.10, flipping the trend back to positive for the first time since 2016. With Silver improving on a near term basis, traders can consider SLV on the breakout. Support can be found around its March low at $15.30.
(As of 4/18/18)
