Most Requested Symbols

We are excited to announce the launch of our newest ETF Model, the Oppenheimer US Revenue Model. The Oppenheimer Report will be updated on Thursday mornings, prior to market open, and will provide you with commentary on Oppenheimer exchange traded funds, as well as the current Oppenheimer US Revenue Model Portfolio. To access the report, simply put your mouse over the "Research" tab and click on "Oppenheimer ETF Report". Click here for the Oppenheimer US Revenue Model Portfolio factsheet.
The Oppenheimer US Revenue Model seeks to provide overweight exposure to the strongest fund within Oppenheimer's inventory of four revenue ETFs, which each provide broad exposure to one of the three size categories, as well as a dividend focused inventory, but do so with a weighting scheme based on top line revenue rather than market capitalization. For example, the Oppenheimer Large Cap Revenue ETF RWL provides broad exposure to the S&P 500 universe, but does so by providing greater exposure to lower valuation companies than does the cap-weighted benchmark.


At the end of January 2018, we witnessed the Commodities asset class overtake Fixed Income for the third place position in the DALI rankings. Those of you following Tactical Tilt may have witnessed this move, but it most likely did not alter your portfolio allocation as a result of the continued strength in US and International Equities. For others, it may have piqued your interest to begin seeking opportunities within the asset class. One of the reasons for the bump in the Tally Ranking for Commodities is the general improvement within the Energy sector. By looking at the historical tally, you can see Energy rose from 4th to 1st among the Commodity sub-asset ranks all within the 4th quarter of 2017. This is a trend that has continued throughout the course of 2018 thus far. Energy from a Commodity perspective is rising the ranks across the DWA platform. The fuel behind Energy’s gains has been the rise of Oil.
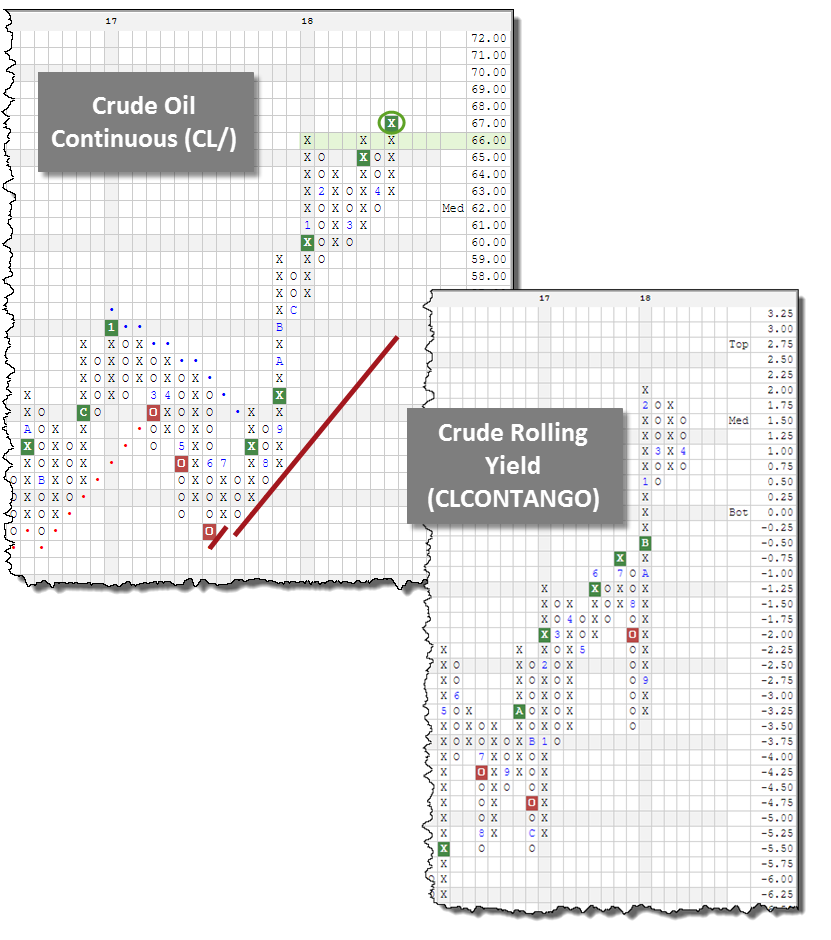
If we look to the Crude Oil Continuous CL/ chart for reference, we can see the chart has continued to improve throughout 2018 and currently trades at multi-year highs having broken a spread triple top at $67. We’ve also witnessed funds like the PowerShares DB Oil Fund DBO crack the top 10 in the premade Asset Class Matrix having overtaken a few US Equities like the Equal Weight S&P 500 RSP, Total Stock Market VTI, and S&P 500 Top 50 XLG. So not only are we seeing improvement from an absolute basis but a relative basis as well. Today we will explore ways to gain exposure to Commodity related Oil securities and dissect how their structure may impact your portfolios.
1) United States 12 Month Oil Fund USL

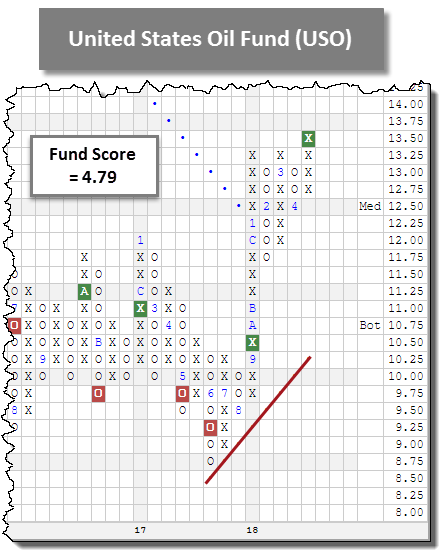
2) United States Oil Fund USO
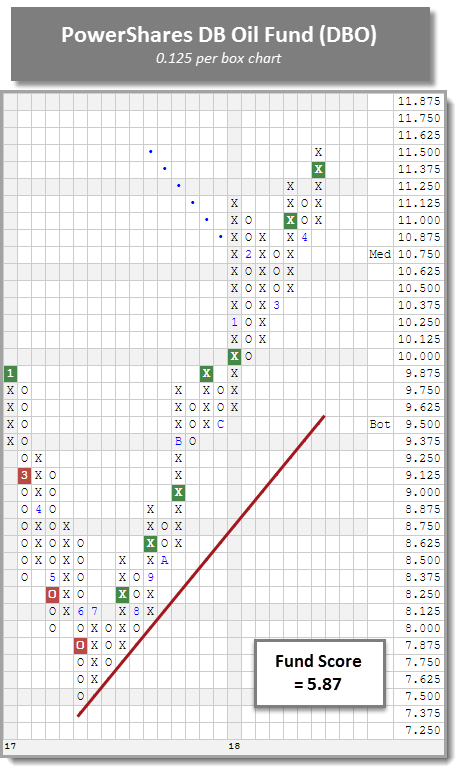
3) PowerShares DB Oil Fund DBO
PowerShares Optimum Yield Diversified Commodity Strategy No K-1 Portfolio PDBC
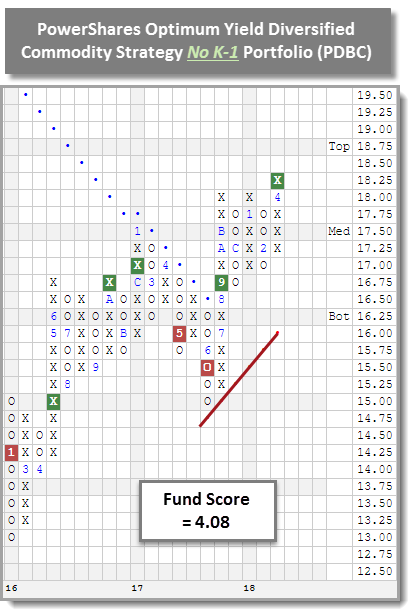
It's important to remember that the Crude Oil market find itself in a state of backwardated. This tells us people are willing to pay a lower price for Crude at some point in the future than they are today for various reasons depending on the circumstances. If the market moves into contango, some funds are structured in such a way that they have to roll the contracts to a future month at a higher price and thus will suffer compared to those that do not. This is not to say that the performance will be negative, just that it is unlikely to perform as well as a fund that is able to choose a specific month i.e. USL (rolls forward) compared to DBO (has freedom). Looking at the performance just so far this year, we can see DBO is up roughly 12.50% while USL is up about 10.50% leaving about a 200 basis point gap between the two. While the two have been able to outperform CL/ in the near term, over the long haul, the structure of these funds have not been able to keep up with the performance of Crude Oil Continuous given how this market has flipped back and forth between a contango and backwardation style environment. Those that wish to gain exposure to Oil via an ETF are best served to choose a fund like DBO at this point, but that could change in the future. What makes an option like PDBC attractive is that it offers a wider array of exposure to the Commodities asset class but is overweight Oil and does not come with a K-1. If you don’t wish to use these funds to gain access to unlevered futures contracts or open a futures account, you may be stuck having to buy an oil tanker and finding a nice hiding spot along the coast to make some money. If you have “an Oil Tanker Guy” – let us know!
(Editor's Note: We misstated that Oil was in contango, when in fact it still persists in a backwardated state.)

Every week, the analysts here at DWA organize and write approximately 11 feature stories focused on the inventories of individual ETF providers. These articles can be found within the weekly ETF reports we conduct for those ETF families with which we provide guided model-based solutions. The weekly reports can be accessed from the Research Menu, but as of this week we will also compile a handful of those stories, which we feel are particularly relevant, into a single report. We hope that this will serve as an "in case you missed it..." sort of section, where you can quickly access timely ETF features in a comprehensive fashion each week. We will include a link to the report along with a brief abstract summarizing our discussion within the respective features. This week's compilation is below.

Over the last 30 days, Frontier Markets has been one of the most improved groups in the Asset Class Group Scores system and has also crossed above the 4.0 score threshold for the first time since we've been tracking it. Frontier Markets are developing countries, which are more developed than so-called least developed countries (LDCs), yet are generally not large enough to be considered emerging markets. If you have clients for whom you would like to gain exposure to Frontier Markets, you may wish to consider the iShares... (Read more)
In last week’s report, we introduced the Oppenheimer US Revenue Model. This Model is designed to provide overweight exposure to the strongest fund within an inventory of four members of Oppenheimer’s Revenue line-up. With the most recent evaluation at the start of April, the Model is currently overweighted to the Oppenheimer Small Cap Revenue ETF RWJ, as it resides at the top of the Model’s Relative Strength Matrix. With that in mind, this week we would like to take a closer look at the RWJ. ... (Read More)
After a seemingly volatility-free year for equities in 2017, volatility has returned with a roar as the VIX now sits in the mid 20’s after averaging around 12 just last year. As a result, we have seen a majority of the major market ETFs, such as the SPDR S&P 500 ETF Trust SPY, undergo pullbacks to or close to their respective February correction lows. Today we wanted to remind users of the importance of identifying and monitoring support levels using Point & Figure charts. Identifying support levels is important because it provides guidance when assessing these funds moving forward... (Read More)
The Distribution Report below places Major Market ETFs and Indices into a bell curve style table based upon their current location on their 10-week trading band. The middle of the bell curve represents areas of the market that are "normally" distributed, with the far right being 100% overbought on a weekly distribution and the far left being 100% oversold on a weekly distribution. The weekly distribution ranges are calculated at the end of each week, while the placement within that range will fluctuate during the week. In addition to information regarding the statistical distribution of these market indexes, a symbol that is in UPPER CASE indicates that the RS chart is on a Buy Signal. If the symbol is dark Green then the stock is on a Point & Figure buy signal, and if the symbol is bright Red then it is on a Point & Figure sell signal.
The average Bullish Percent reading this week is 47.29% up 2.34% from the previous week
| <--100 | -100--80 | -80--60 | -60--40 | -40--20 | -20-0 | 0-20 | 20-40 | 40-60 | 60-80 | 80-100 | 100-> | |||
 |
||||||||||||||
| Symbol | Name | Symbol | Name |
| AGG | iShares US Core Bond ETF | NASD | Nasdaq Composite |
| CL/ | Crude Oil Continuous | NDX | NASDAQ-100 Index |
| DJIA | Dow Jones Industrial Average | RSP | Guggenheim S&P 500 Equal Weight ETF |
| DVY | iShares Dow Jones Select Dividend Index | RUT | Russell 2000 Index |
| DX/Y | NYCE U.S.Dollar Index Spot | SHY | iShares Barclays 1-3 Year Tres. Bond Fund |
| EFA | iSharesMSCI EAFE Index Fund | SML | S&P 600 Small Cap Index |
| FXE | CurrencyShares Euro Trust | SPX | S & P 500 Index |
| GC/ | Gold Continuous | TLT | iShares Barclays 20+ Year Treasury Bond Fund |
| GSG | iShares S&P GSCI Commodity-Indexed Trust | UV/Y | Continuous Commodity Index |
| HYG | iShares iBoxx $ High Yield Corporate Bond ETF | VOOG | Vanguard S&P 500 Growth ETF |
| ICF | iShares Cohen & Steers Realty Index | VOOV | Vanguard S&P 500 Value ETF |
| IEF | iShares Barclays 7-10 Yr. Tres. Bond Fund | VWO | Vanguard FTSE Emerging Markets ETF |
| LQD | iShares iBoxx $ Investment Grade Corp. | XLG | Guggenheim S&P 500 Top 50 ETF |
| MID | S&P 400 MidCap Index |

| Stock | Symbol | Sector | Current Price | Action Price | Target | Stop | Notes |
|---|---|---|---|---|---|---|---|
| The Progressive Corporation | PGR | Insurance | $60.93 | low 60's | 85 | 50 | 5 for 5'er, top 5% of INSU sector, consistent bullish pattern, new mkt RS buy signal, 1.85% yield Earn. 4/17 |
| Tapestry Inc. | TPR | Textiles/Apparel | $53.19 | low 50's | 75 | 44 | 4 for 5'er, top 1/2 of favored TEXT sector matrix, triple top breakout, new mkt RS buy signal, R-R > 2.0, 2.5% yield, Earn. 4/17/18 |
| Ralph Lauren | RL | Textiles/Apparel | $111.99 | 108 - 116 | 133 | 94 | 3 for 5'er, top half of favored TEXT sector matrix, bullish triangle, 1.8% yield. Earn. 5/16/18 |
| Lear Corporation | LEA | Autos and Parts | $196.07 | 196 | 208 | 170 | 5 for 5'er, top 20% of favored AUTO sector matrix, Fresh 7-top breakout, OK to add exposure here. Earn. 4/26/18 |
| Avis Budget Group, Inc. | CAR | Retailing | $49.60 | 48 - 52 | 68 | 41 | 5 for 5'er, top 25% of RETA sector matrix, spread triple top, recent mkt RS buy signal, good R-R Earn. 5/1/18 |
| GoDaddy Inc. | GDDY | Internet | $62.13 | low 60's | 70 | 50 | 5 for 5'er, top 25% of favored INET sector, consistently bullish pattern, new peer RS buy signal, Earn. 5/8/18 |
| Globus Medical, Inc. | GMED | Healthcare | $49.95 | 50 - 53 | 83 | 42 | 5 for 5'er, top 10% of favored HEAL sector matrix, recent RS buy signals, R-R>3 Earn. 5/1 |
| Hewlett Packard Enterprise Company | HPE | Computers | $17.56 | 17 - 19 | 20.50 | 14.50 | 5 for 5'er, top 20% of favored COMP sector matrix, bullish pattern, fresh peer RS reversal & buy signal, 2.2% yield |
| Southern Copper Corporation | SCCO | Metals Non Ferrous | $55.82 | 54 - 58 | 60 | 45 | 4 for 5'er, #1 in META sector matrix, orderly, bullish pattern, reversal to X's on peer RS chart, 1.4% yield, Earn. 5/1/18 |
| IAC/InterActiveCorp | IAC | Media | $158.63 | 163 - 170 | 206 | 148 | 5 for 5'er, #1 in Media sector matrix, bullish chart pattern, at action pt. of potential shakeout, Earn. 5/1/18 |
| Stock | Symbol | Sector | Current Price | Action Price | Target | Stop | Notes |
|---|---|---|---|---|---|---|---|
| Dave & Busters Entertainment | PLAY | Restaurants | $42.75 | low 40s | 29 | 48/51 | 0 for 5'er, 34 out of 35 in REST Matrix, new 52-week low, negative trend |
| Edgewell Personal Care Co | EPC | Household Goods | $47.83 | (49 - 46) | 33 | 56 | 0 for 5'er, ranks last in unfavored HOUS sector, bearish triangle, good R-R, Earn. 5/3 |
| Stock | Symbol | Sector | Current Price | Action Price | Target | Stop | Notes |
|---|---|---|---|---|---|---|---|
| Integra LifeSciences Holdings | IART | Healthcare | $55.89 | mid 50s | 68 | 48 | OK to hold or add exposure here. Abide by $48 stop. Earn. 4/25 |
| Comment |
|---|
| NFLX NetFlix Inc. R ($338.39) - Internet - NFLX printed eight X's on its way to reaching a new all-time high in Tuesday's trading. We will raise our stop-loss to $268, which would take out two levels of support on NFLX's default chart. |
| UNP Union Pacific Corporation R ($137.15) - Transports/Non Air - UNP has has established several new levels of support over the last two months, as a result we will raise our stop-loss to $120; a potential triple bottom break which would take out the stock's February low. |
| RP RealPage Inc. R ($54.80) - Software - RP completed a shakeout pattern when it broke a triple top at $55 in Tuesday's trading. OK to add exposure here. $45 will serve as our stop for new and existing exposure moving forward. |
| NLSN Nielsen Holdings PLC R ($34.15) - Media - NLSN was a short idea in December of last year. We will lower our buy-stop to $39, a move to this level would cause the first buy signal on NLSN's default chart since 2016. |
| CTXS Citrix Systems, Inc. R ($97.17) - Software - CTXS has recently found new levels of support on its default chart and we are now able to raise our stop-loss to $83, which would take out the stock's February low. |
| LPNT LifePoint Health Inc R ($48.95) - Healthcare - LPNT is a short idea from last month, although the stock did not quite hit our stop at $52, it has returned to a buy signal and broken through its bearish resistance line; which warrants consideration of trimming or closing out the position. We will continue to abide by a $52 buy-stop for open exposure. |
IAC IAC/InterActiveCorp R ($163.16) - Media - IAC is a 5 for 5'er that ranks #1 in the Media sector matrix. The stock has shown a consistently bullish pattern over the last two years, giving fifteen buy signals vs. three sell signals since May of 2016. IAC is currently in the action point of a potential shakeout pattern, having formed a double top, broken a double bottom, and then reversed into X's. Exposure may be added here or upon the triple top breakout at $168. We will set our initial stop loss at $148, as a move to this level would negate the potential shakeout pattern. From here, a breakout to $168 would give IAC an initial bullish price objective of $206, which we will use as our price target. Earnings expected 5/1/18.
| 16 | 17 | 18 | |||||||||||||||||||||||||||||||||||||||||||||||||||
| 166.00 | X | X | 166.00 | ||||||||||||||||||||||||||||||||||||||||||||||||||
| 164.00 | X | O | X | O | 164.00 | ||||||||||||||||||||||||||||||||||||||||||||||||
| 162.00 | X | O | X | O | x | 162.00 | |||||||||||||||||||||||||||||||||||||||||||||||
| 160.00 | X | O | O | x | 160.00 | ||||||||||||||||||||||||||||||||||||||||||||||||
| 158.00 | X | O | X | 158.00 | |||||||||||||||||||||||||||||||||||||||||||||||||
| 156.00 | X | O | X | 156.00 | |||||||||||||||||||||||||||||||||||||||||||||||||
| 154.00 | X | X | O | X | Med | 154.00 | |||||||||||||||||||||||||||||||||||||||||||||||
| 152.00 | X | O | X | 4 | X | 152.00 | |||||||||||||||||||||||||||||||||||||||||||||||
| 150.00 | X | X | O | X | O | 150.00 | |||||||||||||||||||||||||||||||||||||||||||||||
| 148.00 | X | O | X | 3 | X | 148.00 | |||||||||||||||||||||||||||||||||||||||||||||||
| 146.00 | X | X | O | X | O | 146.00 | |||||||||||||||||||||||||||||||||||||||||||||||
| 144.00 | X | O | X | O | X | 144.00 | |||||||||||||||||||||||||||||||||||||||||||||||
| 142.00 | X | O | X | O | X | 142.00 | |||||||||||||||||||||||||||||||||||||||||||||||
| 140.00 | X | 2 | X | O | X | 140.00 | |||||||||||||||||||||||||||||||||||||||||||||||
| 138.00 | X | O | X | O | X | 138.00 | |||||||||||||||||||||||||||||||||||||||||||||||
| 136.00 | X | X | X | O | O | X | 136.00 | ||||||||||||||||||||||||||||||||||||||||||||||
| 134.00 | X | O | X | O | X | O | X | 134.00 | |||||||||||||||||||||||||||||||||||||||||||||
| 132.00 | X | O | X | O | X | O | 132.00 | ||||||||||||||||||||||||||||||||||||||||||||||
| 130.00 | B | O | X | O | X | 130.00 | |||||||||||||||||||||||||||||||||||||||||||||||
| 128.00 | X | O | X | O | 1 | 128.00 | |||||||||||||||||||||||||||||||||||||||||||||||
| 126.00 | X | O | X | O | X | Bot | 126.00 | ||||||||||||||||||||||||||||||||||||||||||||||
| 124.00 | X | O | C | X | 124.00 | ||||||||||||||||||||||||||||||||||||||||||||||||
| 122.00 | X | O | X | 122.00 | |||||||||||||||||||||||||||||||||||||||||||||||||
| 120.00 | A | O | 120.00 | ||||||||||||||||||||||||||||||||||||||||||||||||||
| 118.00 | X | 118.00 | |||||||||||||||||||||||||||||||||||||||||||||||||||
| 116.00 | X | 116.00 | |||||||||||||||||||||||||||||||||||||||||||||||||||
| 114.00 | X | 9 | 114.00 | ||||||||||||||||||||||||||||||||||||||||||||||||||
| 112.00 | X | O | X | 112.00 | |||||||||||||||||||||||||||||||||||||||||||||||||
| 110.00 | 8 | O | X | 110.00 | |||||||||||||||||||||||||||||||||||||||||||||||||
| 108.00 | 7 | O | X | 108.00 | |||||||||||||||||||||||||||||||||||||||||||||||||
| 106.00 | X | X | O | X | 106.00 | ||||||||||||||||||||||||||||||||||||||||||||||||
| 104.00 | X | O | X | O | X | 104.00 | |||||||||||||||||||||||||||||||||||||||||||||||
| 102.00 | X | O | X | O | 102.00 | ||||||||||||||||||||||||||||||||||||||||||||||||
| 100.00 | X | X | 6 | X | 100.00 | ||||||||||||||||||||||||||||||||||||||||||||||||
| 99.00 | X | O | X | O | 99.00 | ||||||||||||||||||||||||||||||||||||||||||||||||
| 98.00 | X | O | X | 98.00 | |||||||||||||||||||||||||||||||||||||||||||||||||
| 97.00 | X | O | X | 97.00 | |||||||||||||||||||||||||||||||||||||||||||||||||
| 96.00 | X | O | X | 96.00 | |||||||||||||||||||||||||||||||||||||||||||||||||
| 95.00 | X | O | 95.00 | ||||||||||||||||||||||||||||||||||||||||||||||||||
| 94.00 | X | 94.00 | |||||||||||||||||||||||||||||||||||||||||||||||||||
| 93.00 | X | 93.00 | |||||||||||||||||||||||||||||||||||||||||||||||||||
| 92.00 | X | 92.00 | |||||||||||||||||||||||||||||||||||||||||||||||||||
| 91.00 | X | 91.00 | |||||||||||||||||||||||||||||||||||||||||||||||||||
| 90.00 | X | 90.00 | |||||||||||||||||||||||||||||||||||||||||||||||||||
| 89.00 | X | 89.00 | |||||||||||||||||||||||||||||||||||||||||||||||||||
| 88.00 | X | 88.00 | |||||||||||||||||||||||||||||||||||||||||||||||||||
| 87.00 | X | 87.00 | |||||||||||||||||||||||||||||||||||||||||||||||||||
| 86.00 | X | 86.00 | |||||||||||||||||||||||||||||||||||||||||||||||||||
| 85.00 | X | 85.00 | |||||||||||||||||||||||||||||||||||||||||||||||||||
| 84.00 | 5 | 84.00 | |||||||||||||||||||||||||||||||||||||||||||||||||||
| 83.00 | X | 83.00 | |||||||||||||||||||||||||||||||||||||||||||||||||||
| 82.00 | X | 82.00 | |||||||||||||||||||||||||||||||||||||||||||||||||||
| 81.00 | X | • | 81.00 | ||||||||||||||||||||||||||||||||||||||||||||||||||
| 80.00 | X | • | 80.00 | ||||||||||||||||||||||||||||||||||||||||||||||||||
| 79.00 | X | • | 79.00 | ||||||||||||||||||||||||||||||||||||||||||||||||||
| 78.00 | X | • | 78.00 | ||||||||||||||||||||||||||||||||||||||||||||||||||
| 77.00 | X | X | • | 77.00 | |||||||||||||||||||||||||||||||||||||||||||||||||
| 76.00 | X | O | X | • | 76.00 | ||||||||||||||||||||||||||||||||||||||||||||||||
| 75.00 | • | X | O | 4 | • | 75.00 | |||||||||||||||||||||||||||||||||||||||||||||||
| 74.00 | • | X | O | X | • | 74.00 | |||||||||||||||||||||||||||||||||||||||||||||||
| 73.00 | • | X | 3 | X | • | 73.00 | |||||||||||||||||||||||||||||||||||||||||||||||
| 72.00 | • | X | O | • | 72.00 | ||||||||||||||||||||||||||||||||||||||||||||||||
| 71.00 | • | X | X | • | 71.00 | ||||||||||||||||||||||||||||||||||||||||||||||||
| 70.00 | • | X | O | X | • | 70.00 | |||||||||||||||||||||||||||||||||||||||||||||||
| 69.00 | • | X | O | X | • | 69.00 | |||||||||||||||||||||||||||||||||||||||||||||||
| 68.00 | • | X | X | 1 | 2 | X | • | 68.00 | |||||||||||||||||||||||||||||||||||||||||||||
| 67.00 | X | • | X | X | O | X | O | X | O | • | 67.00 | ||||||||||||||||||||||||||||||||||||||||||
| 66.00 | X | O | • | X | O | X | O | X | O | X | • | 66.00 | |||||||||||||||||||||||||||||||||||||||||
| 65.00 | X | O | • | A | O | X | C | O | • | 65.00 | |||||||||||||||||||||||||||||||||||||||||||
| 64.00 | X | B | X | • | X | B | X | • | 64.00 | ||||||||||||||||||||||||||||||||||||||||||||
| 63.00 | X | O | X | O | X | • | X | O | X | • | 63.00 | ||||||||||||||||||||||||||||||||||||||||||
| 62.00 | O | X | O | X | O | • | • | • | X | O | X | • | 62.00 | ||||||||||||||||||||||||||||||||||||||||
| 61.00 | O | C | X | O | X | • | X | • | • | X | O | • | 61.00 | ||||||||||||||||||||||||||||||||||||||||
| 60.00 | O | X | O | X | O | 8 | O | 9 | • | X | • | 60.00 | |||||||||||||||||||||||||||||||||||||||||
| 59.00 | O | 1 | X | O | X | O | X | O | X | • | 59.00 | ||||||||||||||||||||||||||||||||||||||||||
| 58.00 | O | X | O | X | O | X | O | X | • | 58.00 | |||||||||||||||||||||||||||||||||||||||||||
| 57.00 | O | X | 7 | O | O | O | • | 57.00 | |||||||||||||||||||||||||||||||||||||||||||||
| 56.00 | O | X | X | O | X | • | 56.00 | ||||||||||||||||||||||||||||||||||||||||||||||
| 55.00 | O | X | O | X | O | X | • | 55.00 | |||||||||||||||||||||||||||||||||||||||||||||
| 54.00 | O | X | O | X | O | X | • | 54.00 | |||||||||||||||||||||||||||||||||||||||||||||
| 53.00 | O | X | X | 6 | O | • | 53.00 | ||||||||||||||||||||||||||||||||||||||||||||||
| 52.00 | O | X | O | X | • | 52.00 | |||||||||||||||||||||||||||||||||||||||||||||||
| 51.00 | O | X | O | X | • | 51.00 | |||||||||||||||||||||||||||||||||||||||||||||||
| 50.00 | O | X | O | X | • | 50.00 | |||||||||||||||||||||||||||||||||||||||||||||||
| 49.00 | O | 2 | 5 | • | 49.00 | ||||||||||||||||||||||||||||||||||||||||||||||||
| 48.00 | O | X | 4 | • | 48.00 | ||||||||||||||||||||||||||||||||||||||||||||||||
| 47.00 | O | X | O | X | • | 47.00 | |||||||||||||||||||||||||||||||||||||||||||||||
| 46.00 | O | 3 | O | X | • | 46.00 | |||||||||||||||||||||||||||||||||||||||||||||||
| 45.00 | O | X | O | • | 45.00 | ||||||||||||||||||||||||||||||||||||||||||||||||
| 44.00 | O | X | • | 44.00 | |||||||||||||||||||||||||||||||||||||||||||||||||
| 43.00 | O | X | • | 43.00 | |||||||||||||||||||||||||||||||||||||||||||||||||
| 42.00 | O | X | • | 42.00 | |||||||||||||||||||||||||||||||||||||||||||||||||
| 41.00 | O | X | • | 41.00 | |||||||||||||||||||||||||||||||||||||||||||||||||
| 40.00 | O | X | • | 40.00 | |||||||||||||||||||||||||||||||||||||||||||||||||
| 39.00 | O | • | 39.00 | ||||||||||||||||||||||||||||||||||||||||||||||||||
| 16 | 17 | 18 |
| Comments |
|---|
| AME Ametek Inc ($76.38) - Electronics - AME reversed up into X's with the most recent action, reaching the action point on the shakeout pattern. AME is a 5 for 5'er and ranked in the top quartile of the Electronics Sector Matrix. Investors can consider AME on the reversal up. The first sign of trouble would occur at $72, a double bottom break. Longer term support would be violated at $71, a spread triple bottom sell signal from here. |
| ANSS Ansys Inc ($163.95) - Software - ANSS broke a double top at $162 and continued higher intraday to $164. The stock comes with a technical attribute score of 4 and ranks in the top half of the Software sector matrix. New positions may be initiated on this breakout. Support is at $154 and $148 from here. Earnings are expected on 5/1. |
| BAH Booz Allen Hamilton Holding ($40.90) - Business Products - BAH broke a double top at $41, a new all-time high on the chart. This stock is a 3 for 5’er within the Business Products sector that has been trading in a positive trend since July 2012. Weekly momentum just flipped positive, adding to the positive technical picture. Okay to buy or hold here. Support lies $36. |
| CHE Chemed, Inc. ($288.75) - Household Goods - CHE broke a double top at $288, which marks a new chart high. The 5 for 5'er ranks in the top decile of the Household Goods sector matrix and comes with a bullish price objective of $368. New positions are welcome on this breakout or on a pullback to the lower $280s. Support is at $268. Earnings are expected to be announced on Thursday (4/19). |
| CVGW Calavo Growers, Inc. ($98.25) - Food Beverages/Soap - CVGW broke a triple top at $98, which completes the shakeout pattern. Those waiting for the completion may initiate positions now in the 5 for 5'er. Support is offered in the lower 90s and upper 80s from here. |
| EXR Extra Space Storage Inc. ($89.16) - Real Estate - EXR broke a spread sextuple top at $89, taking out resistance dating back to November 2017. The stock offers 4 positive technical attributes, ranks in the top quartile of the Real Estate sector matrix, and comes with a bullish price objective of $103. New positions may be initiated at current levels and those long may implement a trend violation as a stop. Note earnings are expected on 5/1. |
| FDEF First Defiance Financial Corp. ($59.98) - Savings & Loans - FDEF broke a double top at $60, which completes a bullish catapult formation following the octuple top last month at $57. The 5 for 5'er just flipped to positive monthly momentum too, which suggests the potential for continued price appreciation from here. New positions may be initiated here or on a pullback. Those long may use a trend violation as a stop. |
| RBC Regal Beloit Corporation ($74.45) - Machinery and Tools - RBC just completed a bullish triangle at $74. The breakout also took RBC through the negative trendline, shifting the trend to positive for the first time since August 2017. RBC is still only rated a 1 for 5'er so we wait for improvement on a relative strength basis before considering RBC. |
| VRTX Vertex Pharmaceuticals Incorporated ($164.99) - Biomedics/Genetics - With the most recent action the trend chart of VRTX has returned to a near term buy signal with the breakout at $164, which comes after finding support in the $154 area. VRTX continues to boast a strong 4 for 5 technical attribute suggesting that VRTX has a good trend and relative strength picture. |
| WTW Weight Watchers International, Inc. ($67.55) - Retailing - After correction off its highs of $77, the trend chart of WTW has returned to a near term buy signal at $66. The overall trend of WTW remains positive here and with 3 positive technical attributes the weight of the evidence is positive, as well. Okay to initiate new positions here with a trading stop at $57, which would violate the March correction lows. |
| Name | Option Symbol | Action | Stop Loss |
|---|---|---|---|
| Louisiana-Pacific Corporation - $31.06 | O:LPX 18H29.00D17 | Buy the August 29.00 calls at 3.50 | 27.00 |
| Name | Option | Action |
|---|---|---|
| ConocoPhillips ( COP) | Aug. 52.50 Calls | Raise the option stop loss to 12.35 (CP: 14.35) |
| E*trade Group, Inc. ( ETFC) | Jul. 50.00 Calls | Raise the option stop loss to 7.50 (CP: 9.50) |
| Total System Services Inc ( TSS) | Aug. 80.00 Calls | Initiate an option stop loss of 7.80 (CP: 9.80) |
| Cisco Systems, Inc. ( CSCO) | Sep. 39.00 Calls | Initiate an option stop loss of 4.60 (CP: 6.60) |
| IntercontinentalExchange Inc. ( ICE) | Sep. 67.50 Calls | Initiate an option stop loss of 6.00 (CP: 8.00) |
| Proofpoint Inc ( PFPT) | Aug. 115.00 Calls | Initiate an option stop loss of 15.20 (CP: 17.20) |
| Costco Wholesale Corporation ( COST) | Jun. 180.00 Calls | Raise the option stop loss to 16.10 (CP: 18.10) |
| Name | Option Symbol | Action | Stop Loss |
|---|---|---|---|
| Dave & Busters Entertainment - $42.79 | O:PLAY 18V45.00D19 | Buy the October 45.00 puts at 5.30 | 48.00 |
| Name | Option | Action |
|---|---|---|
| YY Inc (YY) | Aug. 105.00 Puts | Stopped at 16.70 (CP: 14.30) |
| Name | Option Sym. | Call to Sell | Call Price | Investment for 500 Shares | Annual Called Rtn. | Annual Static Rtn. | Downside Protection |
|---|---|---|---|---|---|---|---|
| Michael Kors Holdings Limited $65.50 | O:KORS 18H70.00D17 | Aug. 70.00 | 4.10 | $31,704.50 | 27.95% | 16.00% | 5.08% |
| Name | Action |
|---|---|
| First Solar, Inc. (FSLR) - 70.12 | Sell the September 75.00 Calls. |
| Planet Fitness Inc (PLNT) - 39.18 | Sell the August 40.00 Calls. |
| Urban Outfitters, Inc. (URBN) - 39.61 | Sell the September 39.00 Calls. |
| Avis Budget Group, Inc. (CAR) - 49.60 | Sell the August 52.50 Calls. |
| Aaron's, Inc. (AAN) - 47.28 | Sell the August 50.00 Calls. |
| Deckers Outdoor Corporation (DECK) - 94.95 | Sell the September 97.50 Calls. |
| First Solar, Inc. (FSLR) - 70.12 | Sell the September 75.50 Calls. |
| Michael Kors Holdings Limited (KORS) - 65.50 | Sell the August 67.50 Calls. |
| Name | Covered Write |
|---|---|
| Workday Inc. ( WDAY - 126.83 ) | September 135.00 covered write. |
Daily Equity & Market Analysis
Loading, Please Wait...
