The major market bullish percent indicators, such as the Bullish Percent for NYSE stocks [^BPYNSE] and the Bullish Percent for Optionable stocks [^BPOPTI] remain in Os; yet, earlier this week, we saw the market (as defined by the S&P 500 Index [SPX]) move once again into uncharted territory with a new high at 2405.
The major market bullish percent indicators, such as the Bullish Percent for NYSE stocks ^BPYNSE and the Bullish Percent for Optionable stocks ^BPOPTI remain in Os, since reversing down in late March. A column of Os on these indicators tell us we should be more defensive in our approach to portfolio management. Furthering the case for "defense," just a few weeks ago we moved into what is historically regarded as the "seasonally weak" 6-month stretch for the market. Yet, on Tuesday of this week, we saw the market (as defined by the S&P 500 Index SPX) move once again into uncharted territory with a new high at 2405. How can it be?
For those of you who have been subscribers for several years, this may stir up a sense of déjà vu, as we have been here before. Think back to the market from 2013 through 2014. The bullish percent charts formed patterns of lower tops and lower lows, all the while the major market indices continued to better their highs along the way. Separating the concept of participation from performance is the first step in understanding "how" this can be.
The bullish percent indicators measure participation, literally providing a reading that corresponds to the percent of stocks on buy signals within a specific universe. Each stock is treated equally, which is to say a buy signal from Apple AAPL counts no more or no less than a buy signal from any other stock in the universe. Meanwhile, major market indices such as the SPX or the Dow Jones DJIA measure price change or "performance" of their underlying stock components. However, in this case, the stocks are not "equally weighted;" and so a price change in a stock such as AAPL contributes to a greater extent than a name like Texas Instruments TXN. In fact, in the case of the SPX, a price change in AAPL actually contributes ten-times as much as a price change in TXN to the index as a whole.
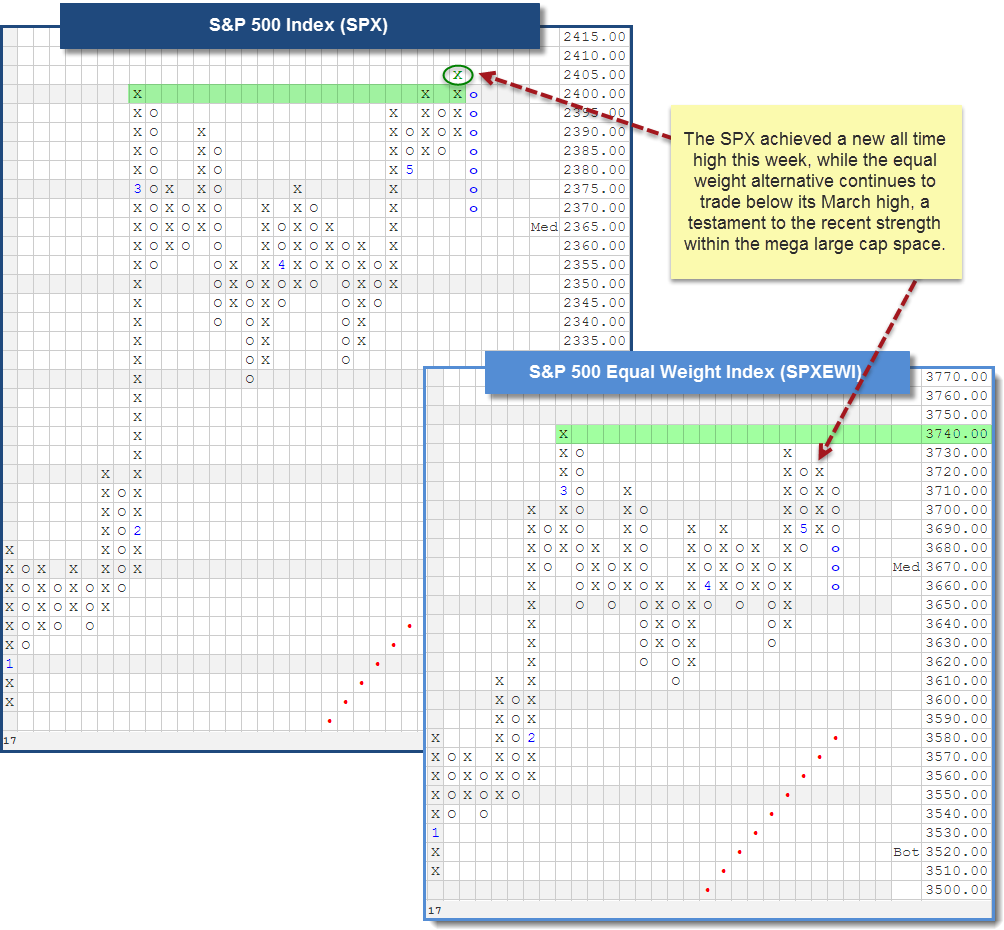
With the differentiation made between participation and performance, we can understand that declining participation (a column of Os in the BP) does not have to equal a decline in performance (negative return in an index). It all depends on which stocks are no longer participating to the upside, and the extent to which they affect the major indices. To help visualize this concept further, consider the two charts below. On the left we see the S&P 500 Index SPX, and the equal weight alternative SPXEWI is on the right. Notice that the SPXEWI has not been able to better its March high. However, the SPX accomplished that feat on Tuesday (visible on its 5-point chart below), telling us that there are individual stocks - presumably with a greater market cap and thus larger weighting in the SPX - that are driving the new highs.