
The first installment of the 2015 "Twelve Days of Christmas" series is a discussion around the absolute and relative improvement we have seen across the Financial sector.
Today, we begin our annual “Twelve Days of Christmas” series. Each year we produce twelve feature articles throughout the last few weeks of the year, all revolving around one central concept. In the past, we have used this series to discuss anything from the basics of Point & Figure and Relative Strength, to tips for effectively communicating the process, to education around new tools and other innovations on the website. This year, all twelve articles will revolve around the topic of “Themes to Know” as we move into a new year. 2016 was a difficult year for relative strength. The market underwent several leadership changes, some of which seem to have more room to go, and others, which proved to be short-lived. This ultimately made for a very bumpy ride for trend adapting strategies such as RS. When we look at where the last 12 months has left us with respect to our indicators, key charts, and other relationships, there are several themes we feel are particularly noteworthy and can be leveraged within your portfolios.
Day 1 - Sector Themes: The Rise of the Financials Sector
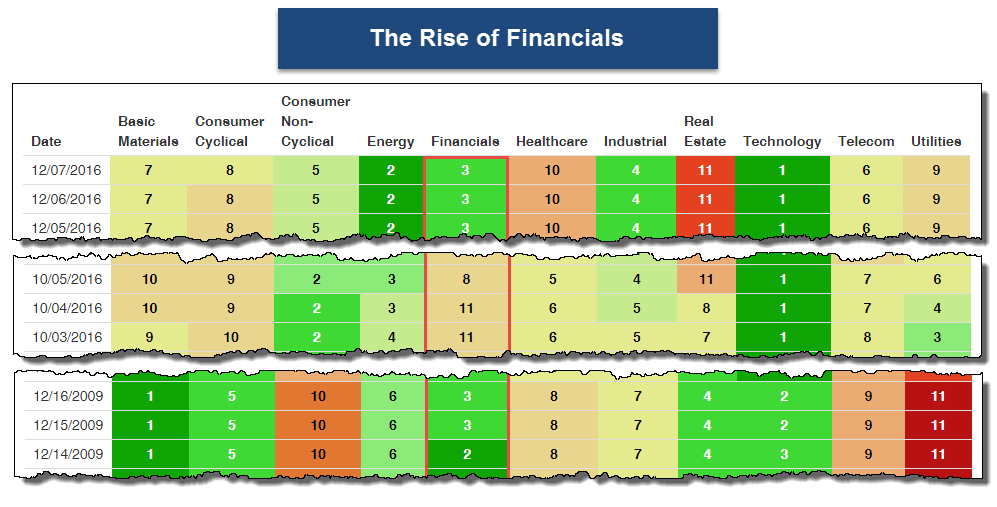
We will kick off the series today by focusing on the relative and absolute improvement seen within the Financials sector, making it one of the new themes to be aware of as we head into 2017. Much of the improvement within the sector is relatively new and has come during the fourth quarter. As it stands today, Financials ranks 3rd (out of 11) in the DALI sector rankings, and prior to this recent climb up the rankings, as recently as October 4th, 2016, Financials had ranked 11th (or last). This abrupt rise up to 3rd place in DALI is notable and it is the highest the sector has ranked since December 2009. Initially, the improvement within the sector left many wondering if this improvement was legitimate, or if this was just another short-term blip on the radar during 2016. As we get closer to the end of the year, we have continued to see positive evidence mount for Financials and help validate some of the action that has occurred. Throughout the rest of the piece, we’ll look to present other positive technical developments that have occurred within the Financials sector.
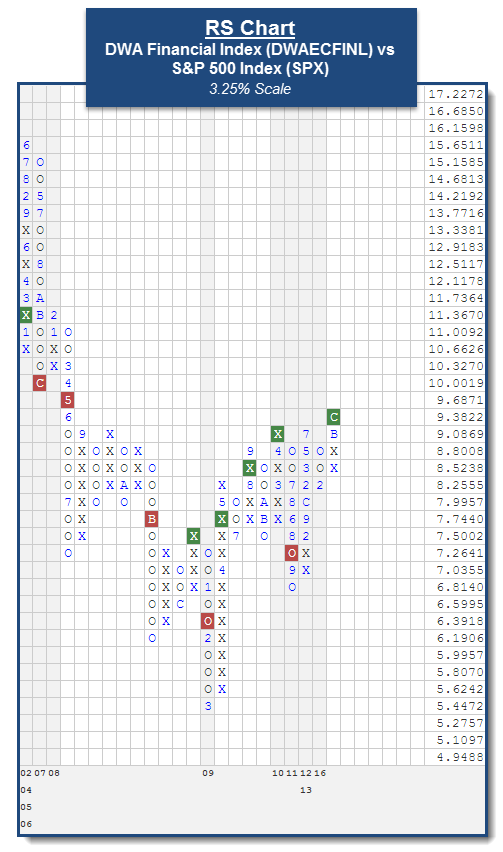
Not only have we seen broader Financials improve relative to other sectors, but we have also seen it improve against the broader market, as defined by the S&P 500 Index . Evidence of this development can be seen on a relative strength chart that compares the DWA Financials Index to the S&P 500 Index . Using a 3.25% scale, DWAECFINL gave a RS buy signal versus the market earlier this week on December 7th. This is the first time since August 2011 that the RS chart has been on a buy signal, favoring Financials. This Index, along with a number of stocks and ETFs within the Financials and Banking space, like J.P. Morgan Chase & Co. and the SPDR S&P Bank ETF , gave relative strength buy signals recently as well. We’ll touch on those two, as well as other potential stocks and ETF ideas, later on in the article. First, we wanted to highlight some of the noteworthy action that has occurred on the various indicators for broad Financials as well as its sub-sectors. Our observations from these indicators are listed below the image.
Indicator Observations:
- Within the broad Financials space, we have seen some of the indicators reach levels that have not been seen in a number of years. From a trending standpoint, the Bullish Percent for Financial is in X’s at 72%, which is the highest level since January of 2014, while the Positive Trend for Financial is in X’s at 70%. On a relative basis, the RS in X’s for Financial indicator, which measures the percent of stocks that are in a column of X’s on their market RS chart, is in X’s at 58%. This indicator gave a buy signal at 56% in November of this year after it had been on a sell signal since July of 2014. Additionally, the RS Positive for Financial indicator, which measures the percent of stocks that are on a market RS buy, is in X’s at 44% (see image below). From here, if the indicator is able to climb above the 46% level this would be the first buy signal to occur on the chart since initially giving a sell signal in November of 2009.
- At this time, the Bullish Percent indicators for the DWA sectors that fall within broader Financials (Banks , Finance , Insurance , Saving & Loans , and Wall Street ) all reside in X’s on their charts. The and reside at 86% and 96%, which are the highest levels we have seen on the charts since 2004. Additionally, the , , and are at 62%, 76%, and 72%, respectively. For these three BP charts, it is the highest levels we have seen since early 2014.
- The Positive Trend for Banks , Finance , Insurance , Saving & Loans , and Wall Street all reside in X’s at 80%, 56%, 76%, 96%, and 68%, respectively. For , this is the highest level we have seen on the chart since October of 2003.
- Each one of the RS in X’s (RSX) indicators for these DWA sectors reside in X’s and are above 50% at this time. The and are at 74% and 52%, which are the highest levels on these chart since October 2008 and August 2008. More importantly, these RSX charts are on buy signals, which is accounted for in the Sector Status ratings.
- Each of the RS Positive (RSP) indicators for these DWA sectors are in X’s at this time. More notably, the and reside at 56% (see below) and 66%, respectively. These are the highest levels we have seen on these charts since January of 2009 (BANK) and February of 2005 (FINA).

As we noted, the weight of the evidence for broader Financials is overwhelmingly positive. With that in mind, we wanted to present a couple of shopping lists for broad Financials. The first list will consist of ETFs, while the second will feature stocks. Please note that in a number of cases these ETFs and stocks still reside in highly overbought territory. Because of that, we would look to gain exposure to these names on a pullback to more buyable ranges on their overbought/oversold readings or dollar cost average into a position as the chart normalizes. The criteria used to construct these lists can be found in the paragraphs below, and we have also highlighted an ETF and a stock from each list.
Financial ETFs Shopping List
|
| Symbol |
Name |
Price |
Score |
Trend |
Yield |
Overbought/Oversold Reading |
|
Fidelity MSCI Financials Index ETF |
35.15 |
5.82 |
Positive |
1.80 |
|
|
First Trust Financials AlphaDEX Fund |
27.49 |
3.67 |
Positive |
1.37 |
|
|
iShares U.S. Regional Banks ETF |
45.68 |
5.73 |
Positive |
1.54 |
|
|
iShares U.S. Financial ETF |
103.02 |
4.48 |
Positive |
1.57 |
|
|
iShares Dow Jones U.S. Financial Service ETF |
108.54 |
4.70 |
Positive |
1.22 |
|
|
SPDR S&P Bank ETF |
44.05 |
5.74 |
Positive |
1.35 |
|
|
PowerShares KBW Bank Portfolio |
48.08 |
5.68 |
Positive |
1.44 |
|
|
SPDR S&P Insurance ETF |
83.19 |
4.48 |
Positive |
1.48 |
|
|
SPDR S&P Regional Banking ETF |
55.91 |
5.82 |
Positive |
1.43 |
|
|
PowerShares S&P SmallCap Financials ETF |
53.06 |
4.72 |
Positive |
2.22 |
|
|
First Trust NASDAQ ABA Community Bank Index Fund |
53.18 |
5.77 |
Positive |
1.07 |
|
|
Vanguard Financials ETF |
60.39 |
5.84 |
Positive |
1.77 |
|
|
Financial Select Sector SPDR Fund |
23.70 |
5.80 |
Positive |
2.15 |
|
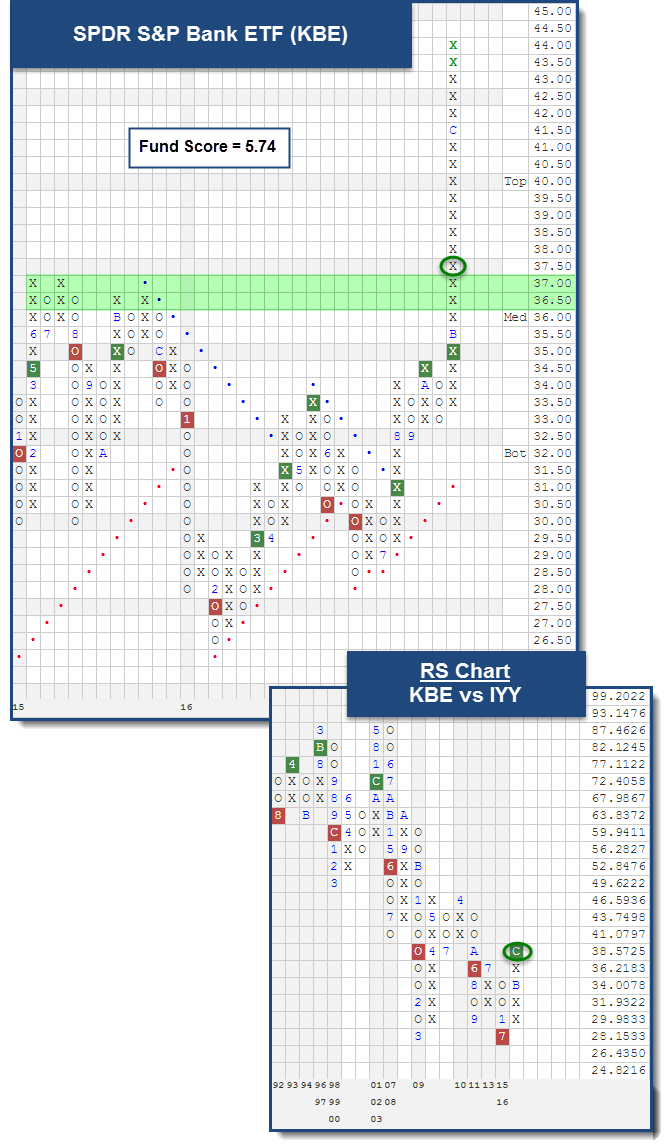
Our criteria for the ETF query consisted of Financials funds that have fund scores of 3 or higher, average volume greater than 10,000 shares, net assets north of $250 million, and are trading in a positive trend. One ETF from our list is the SPDR S&P Bank ETF . With action in early November, KBE rallied above resistance in the $36.50 and $37 range to reach a new 52-week high. Since that time, KBE has continued to better those highs and recently hit the $44 level. This move to $44 caused KBE to give a buy signal on the market RS chart versus IYY. This buy signal is the first to occur on the chart since initially giving a sell signal back in June of 2008. Overall, KBE has a fund score of 5.74 and is quite strong at this time. It's also extremely overbought, as it's trading at +192% on its ten week trading band. So those who are looking to take exposure to KBE should look for the chart to normalize at these levels and dollar cost average into a position.
Financial Stocks Shopping List
|
| Symbol |
Name |
Price |
Tech Attribute |
Yield |
Overbought/Oversold Reading |
|
Acadia Realty Trust |
33.91 |
3  |
3.51 |
|
|
American Homes 4 Rent |
21.04 |
3 |
0.95 |
|
|
Aon Corporation |
112.89 |
4 |
1.17 |
|
|
Alexandria Real Estate Equities, Inc. |
110.62 |
4 |
3.00 |
|
|
Brookfield Asset Management |
33.17 |
3  |
1.57 |
|
|
BlackRock, Inc. |
390.33 |
4 |
2.35 |
|
|
BioMed Realty Trust, Inc. |
23.81 |
4 |
4.37 |
|
|
BNC Bancorp. |
32.60 |
4 |
0.61 |
|
|
Bank of Hawaii |
88.80 |
4 |
2.16 |
|
|
Popular, Inc. |
44.48 |
5 |
1.35 |
|
|
Chubb Ltd |
132.20 |
4 |
2.09 |
|
|
Commerce Bancshares |
58.82 |
3 |
1.53 |
|
|
Mack-Cali Realty Corporation |
29.17 |
3 |
2.06 |
|
|
Colony Capital Inc |
20.77 |
3 |
7.70 |
|
|
Comerica Incorporated |
69.62 |
5 |
1.32 |
|
|
Communications Sales & Leasing Inc |
25.78 |
3 |
9.31 |
|
|
City National Corporation |
89.60 |
4 |
1.56 |
|
|
Douglas Emmett, Inc. |
38.61 |
4 |
2.28 |
|
|
CommonWealth REIT |
29.24 |
3 |
0.00 |
|
|
Equinix, Inc. |
346.46 |
4 |
2.02 |
|
|
Essent Group Ltd |
33.01 |
4 |
0.00 |
|
|
Empire State Realty Trust Inc. |
20.51 |
3 |
2.05 |
|
|
E*trade Group, Inc. |
35.44 |
5 |
0.00 |
|
|
First American Financial Corporation |
37.45 |
3 |
3.63 |
|
|
First Financial Bankshares, Inc. |
46.15 |
5 |
1.56 |
|
|
Fidelity National Financial, Inc. |
34.16 |
3 |
2.93 |
|
|
First Republic Bank of San Francisco |
90.61 |
5 |
0.71 |
|
|
Highwoods Properties Inc |
49.56 |
3 |
3.43 |
|
|
Homestreet Inc |
31.05 |
4 |
0.00 |
|
|
Healthcare Realty Trust Incorporated |
30.59 |
3 |
3.92 |
|
|
IHS Markit Ltd |
35.72 |
4 |
0.00 |
|
|
J.P. Morgan Chase & Co. |
85.12 |
5 |
2.26 |
|
|
Kennedy-Wilson Holdings |
21.60 |
3 |
2.59 |
|
|
LPL Investment Holdings Inc |
35.91 |
4 |
2.79 |
|
|
Liberty Property Trust |
40.48 |
3 |
4.69 |
|
|
Mastercard Inc. |
104.82 |
5 |
0.84 |
|
|
PacWest Bancorp |
55.34 |
4 |
3.61 |
|
|
Principal Financial Group |
60.86 |
3 |
2.83 |
|
|
Primerica Inc. |
71.30 |
5 |
1.01 |
|
|
Starwood Waypoint Residential Trust. |
30.62 |
3 |
2.87 |
|
|
Select Income Reit |
25.61 |
3 |
7.97 |
|
|
State Street Corporation |
81.44 |
3 |
1.87 |
|
|
Urban Edge Properties |
27.86 |
4 |
3.16 |
|
|
ING US Inc. |
40.64 |
3 |
0.10 |
|
|
Webster Financial Corporation |
54.32 |
5 |
1.84 |
|
|
Wells Fargo & Company |
57.29 |
3 |
2.65 |
|
|
W. R. Berkley Corporation |
64.78 |
3 |
0.80 |
|
|
Washington Real Estate Investment Trust |
32.42 |
3 |
3.70 |
|
|
Wintrust Financial Corporation |
71.13 |
5 |
0.68 |
|
|
Zillow Group Inc. Class C |
36.97 |
5 |
0.00 |
|
Our criteria for the stock query consisted of optionable Financial stocks that have at least $20 in price, have at least 3 technical attributes, are in a positive trend, have an average volume of 250,000 shares, and offer a reward to risk ratio north of 2. A stock from our list that many have wondered about is J.P. Morgan Chase & Co. . JPM was able to rally above resistance at the $69 and $70 range during the early part of November and rally up to the $80 level to reach a new all-time high. JPM briefly pulled back, establishing a higher bottom at $77, and then moved back into a column of X’s to form a double top at $80. As we moved into December, JPM rallied above the $81 level to break a double top for a second consecutive buy signal. JPM has since moved up to the $85 level to better its all-time high. From a relative standpoint, JPM was able to give a RS buy signal versus the S&P 500 Equal-Weighted Index . This is the first buy signal on the chart since initially giving a sell signal back in September of 2011. This buy signal brought JPM up to a 5 for 5’er in technical attribute rating. Like KBE, since it's so overbought, we would look to dollar cost average into a position at this time. Unlike KBE, JPM has been able to establish a higher bottom to offer up support closer to current trading levels.

