Most Requested Symbols

The “New Economy” seems to have an age-old ball and chain bound to its leg – the “Old Economy.”
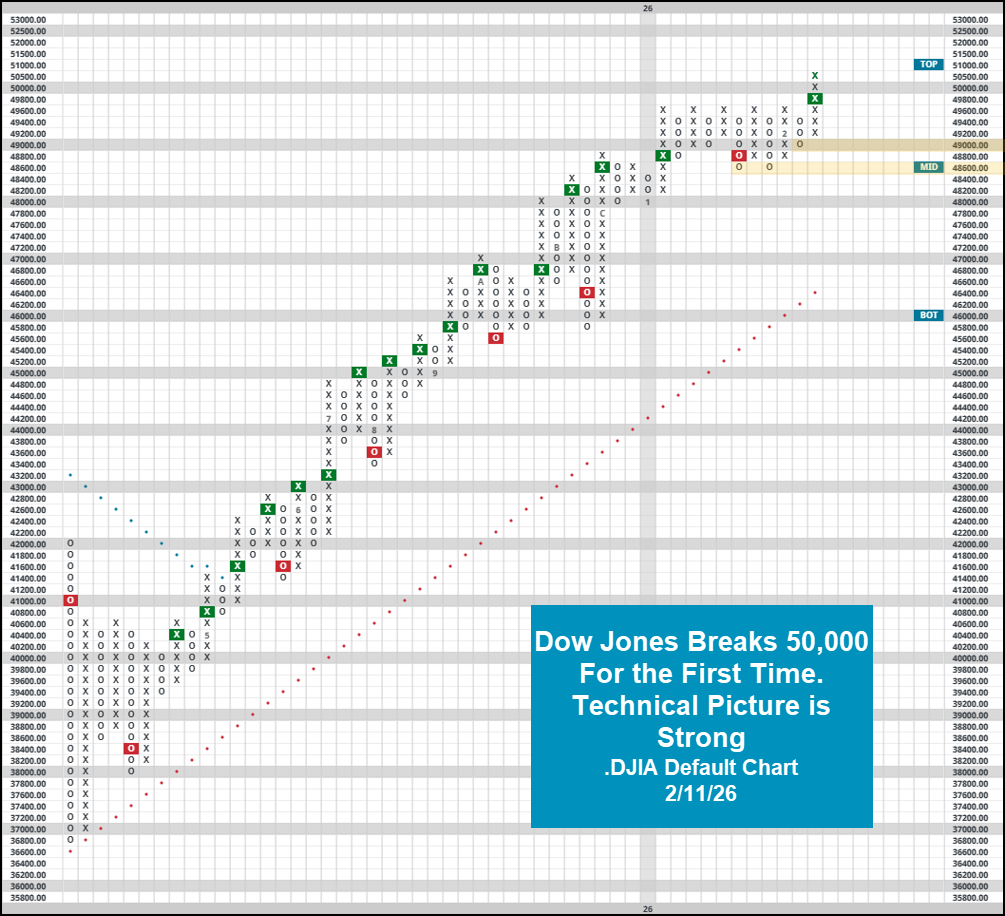
The Dow crossed above 50,000 for the first time in its history on February 6th, 2026.
Weekly Rundown Video – Feb 11, 2026
Weekly rundown with NDW analyst team covering all major asset classes.
Weekly rundown with NDW analyst team covering all major asset classes.
The “New Economy” seems to have an age-old ball and chain bound to its leg – the “Old Economy.” The development of AI software and the hardware, semiconductors, needed to run that software were the initial beneficiaries of increased demand as investors thought of the possibilities of rapidly progressing technology. In the mania around AI, one important thing was seemingly forgotten, the infrastructure necessary to build out what was needed for AI’s scale. Companies have quickly realized the amount of spending necessary to make their AI dreams a reality. Microsoft, Alphabet, Amazon, and Meta are projected to combine for over $600 billion in artificial intelligence investments in 2026 (Yahoo Finance). The economic reality of the AI buildout is that it is going to be expensive and reduce the financial flexibility of many large tech companies. Large cash balances and strong free cash flows were a couple of the supporting arguments for mega-cap technology names’ lofty valuations, but that has taken a hit as these companies must now spend this cash and even take on extra debt to now meet their forward AI expectations at the expense of share buybacks and elasticity.

The building out of data centers, semiconductor plants, and energy infrastructure has led this money to flow from the “New Economy” sectors into the “Old Economy” sectors. The best-performing SPDR sector funds are energy (XLE), industrials (XLI), and basic materials (XLB). All three gained more than 10% year-to-date with XLE leading the pack up nearly 20%. On the other hand, financials (XLF), communication services (XLC), technology (XLK), and consumer cyclical (XLY) are the only four sectors down this year, albeit none are down more the 3% year-to-date. The dispersion in performance has led to sector rankings and signal counts in DALI making notable changes. Energy entered the year ranked ninth but has gained 58 signals and is now ranked fourth. Industrials and basic materials were doing well entering the year but now make up the top two ranked sectors, respectively. On the other side of the coin, technology fell from the top-ranked sector down to fifth, the starkest drop in any sector. While the tech behind AI will still be the spearhead, the buildout necessary to support such ventures will require the “Old Economy” in a way potentially not seen in decades.


A new car. A European getaway. A luxury watch. Lots of things come to mind when you talk about $50,000. For many clients, that sum is much more than pocket change and is a major psychological landmark along our financial journey. While not measured specifically in dollars, the Dow Jones Industrial Average notched its own respective landmark over the last week… crossing above 50,000 for the first time in its history on February 6th, 2026. While updates of our 1,000 point landmark piece are much less frequent than they were just a few years ago, notable landmarks like 50,000 give us an opportunity to look back at where we have come from in an effort to predict where we might be going as we move through 2026.
Before diving into the table, we will provide a brief technical comment on the Dow Jones as of 2/11. While other domestic benchmarks have struggled this year, the Dow has been able to put together a rather constructive opening to 2026. .DJIA has advanced roughly 4% as of the time of this writing, edging out the likes of NDX or SPX which have struggled as growth names have pulled back. This is partially due in part to the overall weighting methodology differences between the indices- the Dow is price weighted while others are market cap weighted. This means that the likes of AMZN, AAPL or NVDA have less of an overall impact on movement than higher priced names like CAT, GS or AMGN. This difference can help in some markets and hurt in others, but less overall reliance on big technology names have helped the index so far this year. This is quite evident on the default chart for .DJIA. After struggling to break through 49,600 a total of five times to open the year, it finally broke a quintuple top to crest 50,000 for the first time ever to start February. With support littered between 48,600 and 49,000, the technical picture is strong and improving.
With that said, we can journey into an analysis of other notable instances during which the Dow broke past important “landmarks.” Before going further, it is worth defining what we mean as “notable”. At this point, a 1,000 point move represents a mere 2% move off current levels… a metric that could seemingly come at any point in today’s fast moving environment. With this in mind, we adjusted our table from showcasing every 1,000 point move to those which represented a ~5%-10% move from the previous landmark, starting from 10,000. Said more plainly, the 3,000 point advance from 47,000 to 50,000 is the roughly same mathematical gain as moving from 16,000 to 17,000 back In 2013. The point of this is to observe moves on a more level playing field rather than hyperfocus on a move that could happen in the course of a trading week. Some interesting, high level statistics:
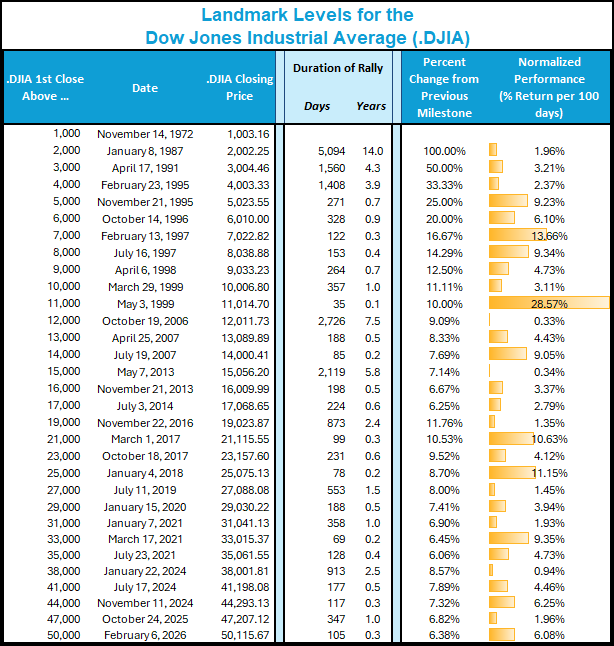
Judging by these metrics alone, the next 3,000-point move (~6% gain from current levels) would come by August 11th, 2026. While there is certainly no guarantee that such an advance is coming down the pipeline, the overall technical posture remains strong for the Dow… and domestic equities in general despite some growing signs of changing leadership. As always, keep an eye on the charts in the event of further shifts worth monitoring.
Each week the analysts at NDW review and comment on all major asset classes in the global markets. Shown below is the summary or snapshot of the primary technical indicators we follow for multiple areas. Should there be changes mid-week we will certainly bring these to your attention via the report.
| Universe | BP Col & Level (actual) | BP Rev Level | PT Col & Level (actual) | PT Rev Level | HiLo Col & Level (actual) | HiLo Rev Level | 10 Week Col & Level (actual) | 10 Week Rev Level | 30 Week Col & Level (actual) | 30 Week Rev Level |
|---|---|---|---|---|---|---|---|---|---|---|
| ALL |
|
42% |
|
38% |
|
66% |
|
56% |
|
48% |
| NYSE |
|
56% |
|
54% |
|
80% |
|
70% |
|
62% |
| OTC |
|
36% |
|
34% |
|
58% |
|
50% |
|
50% |
| World |
|
46% |
|
44% |
|
|
|
60% |
|
54% |

Remember, these are technical comments only. Just as you must be aware of fundamental data for the stocks we recommend based on technical criteria in the report, so too must you be aware of important data regarding delivery, market moving government releases, and other factors that may influence commodity pricing. We try to limit our technical comments to the most actively traded contracts in advance of delivery, but some contracts trade actively right up to delivery while others taper off well in advance. Be sure you check your dates before trading these contracts. For questions regarding this section or additional coverage of commodities email james.west@nasdaq.com.
Data represented in the table below is through 2.11.26:
| Symbol | Name | Price | PnF Trend | RS Signal | RS Col. | 200 Day MA | Weekly Mom |
|---|---|---|---|---|---|---|---|
| CL/ | Crude Oil Continuous | 63.96 | Positive | Sell | O | 62.25 | + 7W |
| DBLCIX | Deutsche Bank Liquid Commodities Index | 468.52 | Positive | Sell | O | 460.74 | - 31W |
| DWACOMMOD | NDW Continuous Commodity Index | 1082.35 | Positive | Buy | O | 1016.55 | - 1W |
| GC/ | Gold Continuous | 5003.80 | Positive | Buy | X | 3826.95 | + 6W |
| HG/ | Copper Continuous | 5.90 | Positive | Buy | X | 5.06 | - 3W |
| ZG/ | Corn (Electronic Day Session) Continuous | 428.75 | Positive | Sell | O | 425.01 | - 7W |

Average Level
41.81
| < - -100 | -100 - -80 | -80 - -60 | -60 - -40 | -40 - -20 | -20 - 0 | 0 - 20 | 20 - 40 | 40 - 60 | 60 - 80 | 80 - 100 | 100 - > |
|---|---|---|---|---|---|---|---|---|---|---|---|
|
Buy signalgsg
|
|||||||||||
|
Buy signaluso
|
|||||||||||
|
Buy signalhyg
|
Buy signalijr
|
||||||||||
|
Sell signalONEQ
|
Sell signallqd
|
Buy signalIJH
|
|||||||||
|
Sell signalVOOG
|
Buy signalSPY
|
Buy signaltlt
|
Buy signaliwm
|
Buy signalVOOV
|
Buy signalEEM
|
||||||
|
Buy signalQQQ
|
Sell signalief
|
Buy signalshy
|
Buy signalfxe
|
Buy signalGLD
|
Buy signaldvy
|
||||||
|
Sell signaldx/y
|
Buy signalXLG
|
Buy signalgcc
|
Buy signalagg
|
Buy signaldia
|
Buy signalrsp
|
Buy signalicf
|
Buy signalefa
|
||||
| < - -100 | -100 - -80 | -80 - -60 | -60 - -40 | -40 - -20 | -20 - 0 | 0 - 20 | 20 - 40 | 40 - 60 | 60 - 80 | 80 - 100 | 100 - > |
| AGG | iShares US Core Bond ETF |
| USO | United States Oil Fund |
| DIA | SPDR Dow Jones Industrial Average ETF |
| DVY | iShares Dow Jones Select Dividend Index ETF |
| DX/Y | NYCE U.S.Dollar Index Spot |
| EFA | iShares MSCI EAFE ETF |
| FXE | Invesco CurrencyShares Euro Trust |
| GLD | SPDR Gold Trust |
| GSG | iShares S&P GSCI Commodity-Indexed Trust |
| HYG | iShares iBoxx $ High Yield Corporate Bond ETF |
| ICF | iShares Cohen & Steers Realty ETF |
| IEF | iShares Barclays 7-10 Yr. Tres. Bond ETF |
| LQD | iShares iBoxx $ Investment Grade Corp. Bond ETF |
| IJH | iShares S&P 400 MidCap Index Fund |
| ONEQ | Fidelity Nasdaq Composite Index Track |
| QQQ | Invesco QQQ Trust |
| RSP | Invesco S&P 500 Equal Weight ETF |
| IWM | iShares Russell 2000 Index ETF |
| SHY | iShares Barclays 1-3 Year Tres. Bond ETF |
| IJR | iShares S&P 600 SmallCap Index Fund |
| SPY | SPDR S&P 500 Index ETF Trust |
| TLT | iShares Barclays 20+ Year Treasury Bond ETF |
| GCC | WisdomTree Continuous Commodity Index Fund |
| VOOG | Vanguard S&P 500 Growth ETF |
| VOOV | Vanguard S&P 500 Value ETF |
| EEM | iShares MSCI Emerging Markets ETF |
| XLG | Invesco S&P 500 Top 50 ETF |

| Symbol | Company | Sector | Current Price | Action Price | Target | Stop | Notes |
|---|---|---|---|---|---|---|---|
| JPM | J.P. Morgan Chase & Co. | Banks | $318.28 | lo 300s - mid 320s | 380 | 256 | 5 TA rating, top 25% of favored BANK sector matrix, LT RS buy, LT pos trend, buy-on-pullback |
| EWBC | East West Bancorp, Inc. | Banks | $120.54 | mid 100s - mid 110s | 157 | 92 | 4 for 5'er, top third of favored BANK sector matrix, LT pos peer RS, one box from mkt RS buy, spread quad top |
| ULTA | Ulta Beauty, Inc. | Retailing | $679.28 | 632 - hi 600s | 840 | 568 | 4 TA rating, top 10% of RETA sector matrix, LT RS buy, consec buy signals |
| APTV | Aptiv PLC | Autos and Parts | $85.15 | hi 70s - low 80s | 100 | 69 | 5 for 5'er, top half of AUTO sector matrix, successful trend line test |
| GS | Goldman Sachs Group, Inc. | Wall Street | $948.99 | mid-800s - mid-900s | 1416 | 736 | 5 TA rating, top 10% of WALL sector matrix, LT RS buy, LT pos trend, buy-on-pullback |
| PHM | PulteGroup, Inc. | Building | $137.33 | hi 120s - mid 130s | 168 | 110 | 4 for 5'er, top half of BUIL sector matrix, LT pos peer & mkt RS, bullish catapult |
| META | Meta Platform Inc. | Internet | $670.72 | 650s - 690s | 1040 | 552 | 4 for 5'er, top 20% of INET sector matrix, LT pos peer & mkt RS, triple top, buy on pullback |
| BFH | Bread Financial Holdings Inc. | Business Products | $77.11 | 74-lo 80s | 94 | 64 | 5 TA rating, top 20% of BUSI sector matrix, LT RS buy, buy-on-pullback |
| ATO | Atmos Energy Corp | Gas Utilities | $174.17 | 170s | 202 | 148 | 4 for 5'er. top 20% of GUTI sector matrix, LT pos peer RS, 3.3% yield |
| Symbol | Company | Sector | Current Price | Action Price | Target | Stop | Notes |
|---|
| Symbol | Company | Sector | Current Price | Action Price | Target | Stop | Notes |
|---|---|---|---|---|---|---|---|
| BCO | The Brink's Company | Protection Safety Equipment | $131.49 | mid 110s - low 120s | 152 | 104 | Removed for earnings. Raise stop to $114. Earn. 2/25 |
| ENVA | Enova International Inc | Finance | $157.79 | hi 150s - 160s | 190 | 142 | ENVA has fallen to a sell signal. OK to hold here. Raise stop to $146. |
| Comment | |||||||
|---|---|---|---|---|---|---|---|
|
|
|||||||
ATO Atmos Energy Corp R ($176.04) - Gas Utilities - ATO is a 4 for 5'er that ranks in the top quintile of the gas utilities sector matrix and has been on a peer RS buy signal since 2015. After giving two consecutive sell signals, ATO returned to a buy signal in last week's trading when it broke a double top at $172. Long exposure may be added in the $170s and we will set our initial stop at $148, a potential spread triple bottom break on ATO's default chart. We will use the bullish price objective, $202, as our target price. ATO also carries a 2.3% yield.
| 25 | 26 | ||||||||||||||||||||||||||||
| 180.00 | X | 180.00 | |||||||||||||||||||||||||||
| 178.00 | X | X | O | 178.00 | |||||||||||||||||||||||||
| 176.00 | X | O | X | O | 176.00 | ||||||||||||||||||||||||
| 174.00 | X | O | X | O | X | 174.00 | |||||||||||||||||||||||
| 172.00 | A | O | X | C | 1 | X | 172.00 | ||||||||||||||||||||||
| 170.00 | X | B | O | X | O | 2 | 170.00 | ||||||||||||||||||||||
| 168.00 | X | X | O | X | O | X | Mid | 168.00 | |||||||||||||||||||||
| 166.00 | X | X | O | X | O | O | X | 166.00 | |||||||||||||||||||||
| 164.00 | X | O | X | O | X | O | 164.00 | ||||||||||||||||||||||
| 162.00 | 5 | O | 8 | 9 | 162.00 | ||||||||||||||||||||||||
| 160.00 | X | O | X | X | • | 160.00 | |||||||||||||||||||||||
| 158.00 | X | O | X | O | X | • | 158.00 | ||||||||||||||||||||||
| 156.00 | 4 | X | O | X | O | X | • | 156.00 | |||||||||||||||||||||
| 154.00 | 3 | X | O | X | O | X | O | X | • | Bot | 154.00 | ||||||||||||||||||
| 152.00 | X | X | O | X | O | X | O | X | 6 | X | • | 152.00 | |||||||||||||||||
| 150.00 | X | O | X | O | X | O | X | X | O | 7 | • | 150.00 | |||||||||||||||||
| 148.00 | X | O | X | O | X | O | X | O | X | • | 148.00 | ||||||||||||||||||
| 146.00 | X | C | X | 2 | O | O | X | O | X | • | 146.00 | ||||||||||||||||||
| 144.00 | X | X | O | 1 | O | X | O | X | O | • | 144.00 | ||||||||||||||||||
| 142.00 | X | O | X | O | X | O | X | O | • | 142.00 | |||||||||||||||||||
| 140.00 | A | O | X | O | X | O | • | 140.00 | |||||||||||||||||||||
| 138.00 | X | B | O | • | 138.00 | ||||||||||||||||||||||||
| 136.00 | X | • | 136.00 | ||||||||||||||||||||||||||
| 134.00 | 9 | • | 134.00 | ||||||||||||||||||||||||||
| 132.00 | X | • | 132.00 | ||||||||||||||||||||||||||
| 130.00 | 8 | • | 130.00 | ||||||||||||||||||||||||||
| 128.00 | X | • | 128.00 | ||||||||||||||||||||||||||
| 126.00 | X | • | 126.00 | ||||||||||||||||||||||||||
| 124.00 | X | • | 124.00 | ||||||||||||||||||||||||||
| 122.00 | X | • | 122.00 | ||||||||||||||||||||||||||
| 120.00 | 7 | • | 120.00 | ||||||||||||||||||||||||||
| 118.00 | O | 6 | • | 118.00 | |||||||||||||||||||||||||
| 116.00 | O | X | • | 116.00 | |||||||||||||||||||||||||
| 114.00 | O | X | • | 114.00 | |||||||||||||||||||||||||
| 112.00 | O | • | 112.00 | ||||||||||||||||||||||||||
| 25 | 26 |
| ALB Albemarle Corp ($176.15) - Chemicals - ALB returned to a buy signal Wednesday when it broke a double top at $176. Wednesday's move adds to an already positive technical picture as ALB is a 4 for 5'er that ranks in the top third of the favored chemicals sector matrix. From here, overhead resistance sits at $194, ALB's all-time high. Meanwhile, support can be found at $158. |
| CBRE CBRE Group, Inc. ($148.21) - Real Estate - Shares of CBRE were dragged down by its peers, falling double digits while moving back into a negative trend. The now 4 for 5'er continues to display relative strength, keeping it in buy territory for the time being. The stock is also in oversold territory near the bottom of its ten week trading band, indicating the potential for some reversal over the next couple weeks. From here, initial support lies at $136 then $120. |
| CIEN CIENA Corporation ($298.42) - Telephone - Another productive move for CIEN as it moved to new 2026 highs on its way to posting a second consecutive buy signal on its default chart. Now up nearly 30% so far this year, this perfect 5/5 has an overwhelmingly strong technical picture. While there isn't notable resistance nearby, do keep in mind we are a bit overbought around current levels, so look for some normalization on the default chart before adding further. Pullbacks to $284 would be constructive. Keep in mind, the 4.20 RRisk score suggests the name can move around somewhat quickly... a point to keep in mind when we consider suitability. |
| CVNA Carvana Company ($365.40) - Autos and Parts - CVNA reversed into Os, falling from above $400 down to break a double bottom at $360 as shares fell to $348. The move returns the stock to a sell signal and violates the bullish support line, shifting the trend to negative. This follows the market RS chart reversing into Os during last week's trading, and this breakdown will cause the stock to reverse into Os on its peer RS chart, dropping CVNA down to a 2 for 5'er. From here, support now lies in the $308 to $312 range, while additional can be found in the $280 range. |
| GDDY GoDaddy Inc. ($90.96) - Internet - GDDY fell Wednesday to break a double bottom at $92 before falling to $91 intraday. This marks the third consecutive sell signal and a new 52-week low. The weight of the technical evidence is favorable and weakening. Long exposure should be avoided, however, the stock is heavily oversold. This creates a potential sell-on-rally candidate for any remaining holders. Note that earnings are expected on 2/24. |
| INTU Intuit Inc. ($398.50) - Software - INTU declined Wednesday to break a double bottom at $408 before falling to $396 intraday. This 0 for 5'er moved to an RS sell signal against the market last month and has now given four consecutive sell signals. The weight of the technical evidence is weak, however, the stock is deeply oversold. This creates a potential sell-on-rally candidate. Initial overhead resistance may be seen at $456. Earnings are expected on 2/26. |
| NEM Newmont Corp ($123.83) - Precious Metals - After giving two consecutive sell signals NEM returned to a buy signal Wednesday when it broke a double top at $122. Wednesday's move adds to a modestly positive technical picture as NEM is a 3 for 5'er. From here, overhead resistance sits at $134, NEM's all-time high. Meanwhile, support can be found at $110. |
| NI Nisource, Inc. ($44.95) - Gas Utilities - NI broke a double top at $45 for a fourth buy signal since May 2024 and to mark a new all-time chart high. The stock has been a 5 for 5'er since July 2025 and currently ranks within the top third of the Gas Utilities sector matrix while maintaining a yield of 2.7%. Okay to consider here on the breakout or on a pullback to $42 on the chart. Initial support lies at $41, while additional can be found at $39 and $36. |
| Z Zillow Group Inc. Class C ($45.15) - Real Estate - Shares of Z absolutely plummeted on poor earnings, falling 17.5% on the day for its third consecutive sell signal. The 0 for 5'er continues to be a named to avoid, but is now in heavily oversold territory, so it could see a dead cat bounce over the next two weeks. |
| Name | Option Symbol | Action | Stop Loss |
|---|---|---|---|
| RTX Corp. - $196.85 | O: 26E200.00D15 | Buy the May 200.00 calls at 11.60 | 178.00 |
| Name | Option | Action |
|---|---|---|
| CME Group, Inc. ( CME) | Mar. 270.00 Calls | Stopped at 34.60 (CP: 33.00) |
| Hilton Worldwide Holdings Inc ( HLT) | Mar. 300.00 Calls | Raise the option stop loss to 26.60 (CP: 28.60) |
| The TJX Companies, Inc. ( TJX) | Apr. 145.00 Calls | Stopped at 11.15 (CP: 9.60) |
| Citigroup, Inc. ( C) | May. 120.00 Calls | Stopped at 8.80 (CP: 7.10) |
| Name | Option Symbol | Action | Stop Loss |
|---|---|---|---|
| NIKE, Inc. - $62.47 | O: 26Q62.50D15 | Buy the May 62.50 puts at 4.85 | 68.00 |
| Name | Option | Action |
|---|---|---|
|
|
||
| Name | Option Sym. | Call to Sell | Call Price | Investment for 500 Shares | Annual Called Rtn. | Annual Static Rtn. | Downside Protection |
|---|---|---|---|---|---|---|---|
| Enphase Energy Inc $ 50.25 | O: 26D50.00D17 | Apr. 50.00 | 4.30 | $ 22,222.60 | 64.09% | 47.69% | 7.83% |
| Name | Action |
|---|---|
| Alcoa Inc. ( AA) - 61.76 | Sell the March 60.00 Calls. |
| Intel Corporation ( INTC) - 47.13 | Sell the May 49.00 Calls. |
| The Gap, Inc. ( GAP) - 27.68 | Sell the March 29.00 Calls. |
| Dollar General Corp. ( DG) - 146.25 | Sell the May 150.00 Calls. |
| Freeport-McMoRan Inc. ( FCX) - 63.26 | Sell the March 65.00 Calls. |
| Fortinet Inc. ( FTNT) - 85.53 | Sell the May 90.00 Calls. |
| Name | Covered Write |
|---|---|
|
|
|
Daily Equity & Market Analysis
LISTEN TO PODCAST
Feb 12, 2026
NDW MORNING UPDATE
Feb 12, 2026
Loading, Please Wait...
