Weekly Feature
Published: October 18, 2018
This content is for informational purposes only. This should not be construed as solicitation. The general public should consult their financial advisor for additional information related to investment decisions.
There are no changes to the ALPS Target Income Model this week. Please note that as of October 25th, this model and report will be discontinued. Over the last couple of weeks, both US and International Equities have come under some selling pressure. This is evident by the fact that much of the market has moved into oversold territory.

There are no changes to the ALPS Target Income Model this week. Please note that as of October 25th, this model and report will be discontinued. Over the last couple of weeks, both US and International Equities have come under some selling pressure. This is evident by the fact that much of the market has moved into oversold territory. We track the overbought and oversold characteristics of a security by calculating a security's weekly distribution using a 10-week trading band. When a security is above the middle of the band, then it's considered to be in overbought territory, and when it's below the middle, it's in oversold territory. When you aggregate this data and plot the securities on a curve, the Weekly Distribution Curve provides broader context and perspective about the overbought and oversold nature of the market. On the curve, the middle of the bell curve represents areas of the market that are "normally" distributed, with the far right being 100% overbought on a weekly distribution and the far left being 100% oversold on a weekly distribution.


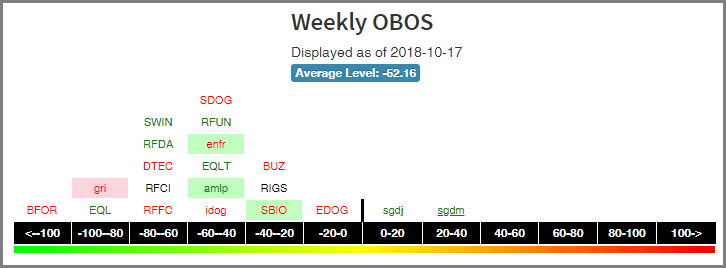
With the exception of the Sprott Junior Minors Gold ETF SGDJ and the Sprott Gold Miners ETF SGDM, all of the Alps ETFs are in oversold territory with the average level being 52.16%. Most of the Alps Funds occupy the -60 to -40% area. The most oversold fund at this time is the Barron’s 400 ETF BFOR extreme reading of -118%. The least oversold fund at this time is the SGDM with an OBOS% reading of +34%. That said, investors can use this time to work into positions, especially those that are oversold yet still possess strength and are holding up on a technical basis. 

Back to report

DISCLOSURE

ALPS has arranged with Dorsey, Wright & Associates (“DWA”) to provide this specialized Funds page on Company sponsored products. The Point & Figure analysis, models and resulting rankings, including any information, data or commentary included herein, are created and provided solely by DWA. Such analysis, models and rankings should not be considered an offer to purchase or sell, or a solicitation of an offer to buy or purchase any security. Unless otherwise stated, the examples presented do not take into consideration dividends, commissions, tax implications, or all potential transactions costs. Neither DWA, nor ALPS themselves through this Fund page provide investment advice or recommendations regarding any security, fund or market. As the investment professional making the final decision with respect to allocations, including any related suitability, fiduciary or other legal obligation, please remember to adhere to all applicable laws, regulations, and rules including FINRA Rules 2090 and 2111 (Suitability), or other such similar rules and regulations. The percentage of the portfolio devoted to any Fund is at the sole discretion of the financial advisor or the customer, and not DWA or Company. If you are not familiar with the Point & Figure methodology, we suggest you read “Point & Figure Charting, Fourth Edition” by Thomas J. Dorsey and visit the PnF University. If you are not familiar with the ALPS products, we suggest you call 866-759-5679. You should consider each ALPS product’s investment objectives, risks, and charges and expenses carefully before investing. Contact ALPS at 866-759-5679 to obtain a prospectus, which contains this and other information about the ALPS products. Read it carefully before you invest.